Xrp - The expected rally of +50%!Xrp - CRYPTO:XRPUSD - is still clearly bullish:
(click chart above to see the in depth analysis👆🏻)
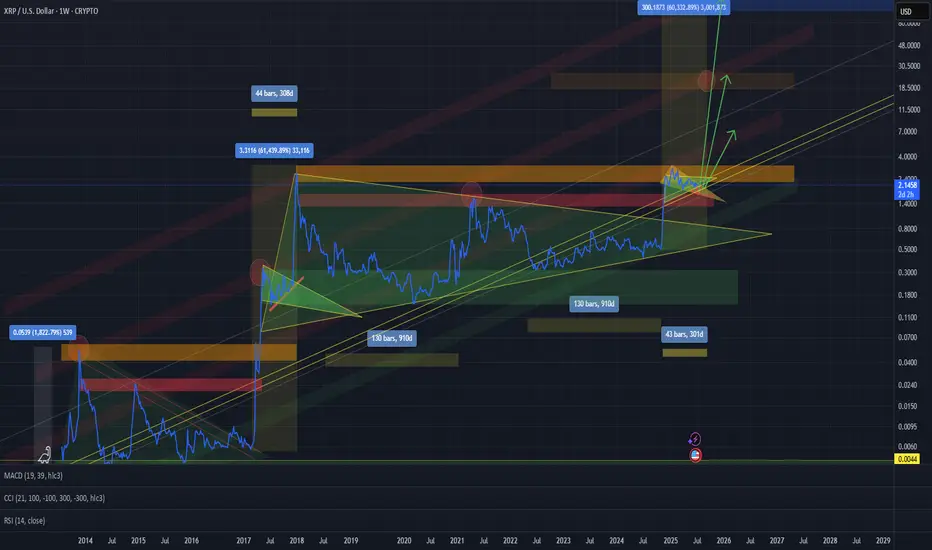
Ever since Xrp rallied more than +550% in the end of 2024, we have been witnessing a quite expected consolidation. However Xrp still remains rather bullish and can easily retest the previous all time highs again. Maybe, we will even see another parabolic triangle breakout.
Levels to watch: $3.0, $10.0
Keep your long term vision!
Philip (BasicTrading)
XRPUSD.P trade ideas

XRP - The stage is set...This is the moment we've been waiting for.
We will only go to from here. I hope you've prepared yourself for how high we are about to go. Have an exit strategy and protect your wealth.
Thank you for being here with me, enjoy.

XRP/USD – Bearish Rejection from Resistance Zone Targets 2.0686XRP/USD Bearish Reversal Setup – H1 Chart 🕐
Analysis:
Entry Point: Price entered a short zone near 2.21828, which aligns with a previous resistance zone.
Bearish Rejection: The price formed a rejection wick and bearish candle at the resistance, signaling a potential reversal.
EMA Confluence: The price is testing below the red 50 EMA, and the 200 EMA (blue) is acting as dynamic support.
Support Zone Retest: The recent price pullback suggests a possible retest of the small support zone around 2.19106.
Target: The projected downside target is 2.06869, aligned with the prior demand zone.
Stop Loss: Positioned above resistance at 2.21828, just outside the upper rejection area.
📌 Summary:
Trend Bias: Bearish
Entry: Around 2.21828
Target: 2.06869 (≈ -6.67%)
Stop Loss: Above 2.21828

XRP LIQUIDITY SWEEP before breakdownThis is a classic example of the liquidity sweep. As you can see the price was in an accumulation phase, then a manipulation phase where institutions push the price up temporarily to grab the liquidity sitting above or below, in this case above, the accumulation phase. This extra liquidity will help fuel the push down. Let me know your thoughts guys! 👍

XRP breakdown...Looks like she's gonna break down to $2.06 area being that it ran up and we're in a current downtrend. Let me know your thought guys?

XRP/USDExpecting something like this on most alts.
I've been waiting patiently for a real correction in everything, but my timing was drastically off. Looks like FOMO is still in charge. My guess, stock market to ATH after ATH for a while and a final wave of FOMO for crypto will enter the air.
I believe the majority are expecting a COVID-like rebound, followed by rally continuation, but the majority tends to be wrong.
What I can tell you is the true crypto bull run will not begin on optimism, as it has been...
It will begin on pessimism.

XRPUSD – Squeeze After SurgeXRP exploded out of a compression base near $2.04 and surged to $2.19 before stalling. Price has since gone flat in a very tight $2.17–$2.19 band, suggesting strong distribution or a bullish flag. Expect a big move: breakout above $2.195 could re-ignite the trend; a break below $2.165 opens downside retrace toward $2.12.

Xrpusd 15m correction Gives good sell signal to 2.11-2.09 before it's journey to 2.4-2.6
This correction risk reward really good
Happy Sunday:)


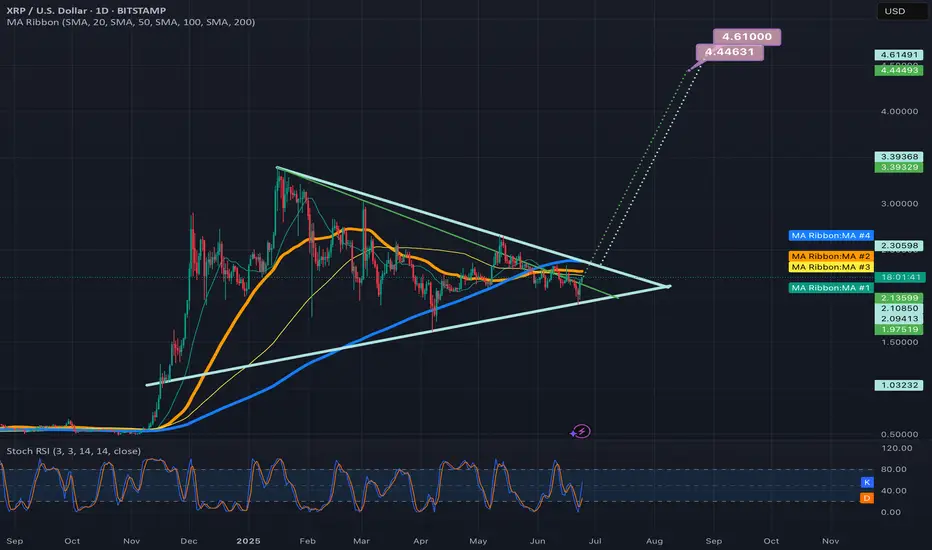
xrp cup and handle target 3.16beautifull cup and handle on the daily
are we breaking out??
if so we could go back to $3.16
stochastic rsi curving up
macd turning back above 0 line
only time will tell
Target 3.16
stop loss 1.86 (below previous wick at 1.91)
never risk more than you are willing to lose
lets go

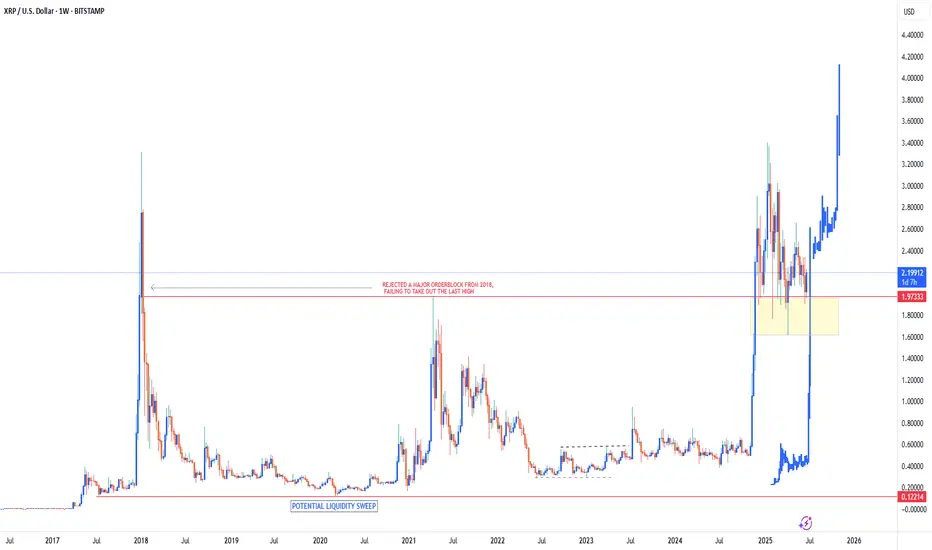
XRP Bullish to ATH of $4.10Since breaking out of its 6 year price range of $0.12 - $1.97 in November 2024, Ripple has remained within a bullish territory, sitting just above its support zone of $1.60 - $1.97.
As long as price can remain above this support zone I do believe that Ripple has much more upside to come in the next few YEARS. This definitely won’t be a fast move as there’s still a lot of legal situations involving XRP which is keeping price limited to the upside. But, as these legal battles come to an end & they will, it will slowly give XRP room to move to the upside.
I definitely see $4.1 as an achievable target for Ripple as the first target in the future. Once this price is reached, market structure & price action will give us a better indication of whether or not we can see high prices above the $4.1 target.
For now just be patient & let XRP play out in accordance with its external macro factors.
XRP XRPUSD XRPUSDTAs before, previous highs often turn into support levels — price respects history. The targets I’m sharing are long-term and global.
At the moment, I’m watching a triangle formation. It could break out to the upside, or we might see a pullback to retest support, likely near one of the prior highs.
XRP WAVE COUNTXrp Elliot wave count. Completed ABCDE corrections, now onward and upward. No we’re not gonna hit $30 this cycle. but $6-10 is possible. $4-6 likely. NFA DYOR

XRP to $3? Searches Surge as Whale Activity Hints at Price Boom
XRP, the cryptocurrency developed by Ripple Labs, has long been a subject of intense speculation and debate within the crypto community. Despite facing regulatory hurdles and market volatility, XRP has maintained a dedicated following, fueled by its potential to revolutionize cross-border payments. Recently, searches for "XRP to $3" have surged, reflecting renewed optimism among investors as the token exhibits signs of increased whale activity, institutional buying, and rising retail interest.
This article delves into the factors driving the renewed interest in XRP, examining the recent price movements, whale activity, and technical indicators that suggest a potential surge to $3. We will analyze the significance of the breakout above $2.20, the consolidation phase below this level, and the potential for XRP to reach $3.40. Furthermore, we will explore the factors that could either support or hinder XRP's ascent, providing a nuanced perspective on the potential for this cryptocurrency to reach new heights. By synthesizing these insights, we aim to offer a comprehensive overview of the factors that could shape XRP's price trajectory in the coming months.
Whale Activity and Institutional Buying: A Bullish Signal?
One of the key factors driving the renewed interest in XRP is the observed increase in whale activity. Whales, defined as individuals or entities holding large amounts of a particular cryptocurrency, can have a significant impact on market prices due to their ability to execute large buy or sell orders.
Recent data suggests that whales have been accumulating XRP, with whale-to-exchange transfers dropping to zero. This indicates that whales are not selling their XRP holdings, but rather holding onto them or even buying more. This accumulation by whales is often seen as a bullish signal, as it suggests that they believe the price of XRP is likely to increase in the future.
In addition to whale activity, there are also signs of increasing institutional buying of XRP. Institutional investors, such as hedge funds, asset managers, and corporations, are increasingly allocating capital to cryptocurrencies, including XRP. This increased institutional adoption can drive up the price of XRP and provide a more stable foundation for its long-term growth.
Breakout Above $2.20: A New Support Level
Another factor driving the renewed interest in XRP is the recent breakout above $2.20. This breakout is significant because it confirms a new support level for XRP. A support level is a price level at which buyers are likely to step in and prevent the price from falling further.
The breakout above $2.20 suggests that there is strong buying pressure for XRP at this level. This buying pressure could be driven by a combination of factors, including whale activity, institutional buying, and rising retail interest.
Consolidation Below $2.20: A Pause Before the Next Rally?
After breaking out above $2.20, XRP has entered a period of consolidation below this level. This consolidation phase is a normal part of the market cycle, allowing the market to digest the recent gains and prepare for the next leg up.
During the consolidation phase, the price of XRP is likely to fluctuate within a narrow range. This fluctuation can create opportunities for traders to buy low and sell high, but it can also be a period of uncertainty for investors.
The key question is whether the consolidation phase is a temporary pause before another rally or a sign that the breakout above $2.20 was a false signal. If the price can hold above $2.20 and eventually break out above the upper resistance levels, it would confirm the validity of the breakout and increase the likelihood of XRP reaching $3.
Potential for XRP to Reach $3.40: A Technical Target
Several analysts have suggested that XRP could potentially reach $3.40 in the near future. This target price is based on technical analysis, which involves studying price charts and other market data to identify patterns and predict future price movements.
One of the technical indicators that suggests a potential rally to $3.40 is the bull flag pattern. The bull flag is a bullish continuation pattern that signals a continuation of an existing uptrend. If XRP can break out above the upper trendline of the bull flag, it could potentially reach $3.40.
Another technical indicator that suggests a potential rally to $3.40 is the Fibonacci retracement levels. Fibonacci retracement levels are horizontal lines that are drawn on a price chart to identify potential support and resistance levels. If XRP can break above the Fibonacci retracement levels, it could potentially reach $3.40.
Technical Indicators: CMF and MACD Show Bullish Momentum
In addition to the bull flag pattern and Fibonacci retracement levels, other technical indicators also suggest that XRP is poised for a potential rally.
The Chaikin Money Flow (CMF) is a technical indicator that measures the amount of money flowing into or out of an asset. A positive CMF value indicates that money is flowing into the asset, which is a bullish signal. The CMF for XRP is currently positive, suggesting that there is strong buying pressure for the cryptocurrency.
The Moving Average Convergence Divergence (MACD) is a technical indicator that shows the relationship between two moving averages of an asset's price. A bullish MACD crossover occurs when the MACD line crosses above the signal line, which is a bullish signal. The MACD for XRP is currently showing a bullish crossover, suggesting that the cryptocurrency is poised for a potential rally.
Factors Hindering XRP's Ascent
While there are several factors that suggest XRP could reach $3 or even $3.40, it is important to acknowledge that there are also factors that could hinder its ascent.
• Regulatory Uncertainty: XRP has faced regulatory challenges in the past, and ongoing regulatory uncertainty could dampen investor sentiment and prevent the cryptocurrency from reaching its full potential. The lawsuit filed by the Securities and Exchange Commission (SEC) against Ripple Labs continues to cast a shadow over XRP's future.
• Market Volatility: The cryptocurrency market is known for its volatility, and sudden price swings could wipe out gains and deter investors.
• Competition: XRP faces competition from other cryptocurrencies and traditional payment systems.
• Demand Fades: If demand for XRP fades, the price could fall back to previous support levels, such as $1.54.
XRP Bulls On Alert: 'This Trendline Is Everything'
Despite the potential challenges, XRP bulls remain optimistic about the cryptocurrency's future. Many analysts have emphasized the importance of a key trendline, stating that "this trendline is everything." This trendline represents a critical support level that must be maintained for XRP to continue its upward trajectory.
If XRP can hold above this trendline, it would signal that the bullish momentum remains intact and that the cryptocurrency is on track to reach its potential targets. However, if the price breaks below this trendline, it could indicate that the bullish momentum is fading and that a further correction is likely.
XRP Price Prediction: Possible Bullish Moves Ahead
Based on the current market conditions, technical indicators, and whale activity, there are signs that suggest possible bullish moves ahead for XRP. However, it is important to remember that the cryptocurrency market is inherently unpredictable, and there is no guarantee that XRP will reach $3 or $3.40.
Investors should carefully consider the risks involved and conduct thorough research before making any investment decisions. It is also important to diversify your portfolio and avoid putting all of your eggs in one basket.
Conclusion
Searches for "XRP to $3" have surged, reflecting renewed optimism among investors as the token exhibits signs of increased whale activity, institutional buying, and rising retail interest. The breakout above $2.20, the consolidation phase below this level, and the potential for XRP to reach $3.40 are all factors that have contributed to this renewed interest.
However, it is important to acknowledge that there are also factors that could hinder XRP's ascent, such as regulatory uncertainty, market volatility, and competition. Investors should carefully consider the risks involved and conduct thorough research before making any investment decisions.
Ultimately, the future of XRP's price will depend on a complex interplay of technical factors, market sentiment, and fundamental developments. By staying informed and using proper risk management techniques, investors can position themselves to potentially profit from XRP's continued growth and success. As always, remember to consult with a qualified financial advisor before making any investment decisions. The potential for XRP to reach $3 offers a tantalizing glimpse of potential gains, but prudent analysis and risk mitigation are essential for navigating the volatile world of cryptocurrency.
$XRP Massive Move Loading – XRP is moving inside a clear sidewaCRYPTOCAP:XRP Massive Move Loading –
XRP is moving inside a clear sideways channel between $1.90 support and $3.38 resistance. The structure signals accumulation, and such ranges often lead to explosive breakouts once the upper level is breached.
🔸 Support at 1.90:
This support has consistently held since early 2025. It's a strong accumulation zone and ideal area for smart money entries.
🔸 Upside Target: $5.0
If price breaks and closes above $3.38 on the weekly timeframe, XRP could rally toward $4.20 and then $5.00+, supported by fresh ETF and regulatory news.
🔸 Risk Level at 1.8257:
Break and close below this zone would invalidate the bullish bias and could open the door to further downside.
🔸 Outlook:
It’s better to accumulate near the bottom of the range (around $1.90) rather than chasing highs. Look for strong bullish candles or volume spikes near the support. Wait for a confirmed breakout and retest above $3.38 for trend continuation setups.
🔥 Fundamentals Heating Up:
• 🇨🇦 First Spot XRP ETF approved
• US Crypto regulation in final stages
• Regulated stablecoin issuers backing XRP
• Arthur Hayes re-enters the XRP talk after 13 years 👀
#btc #eth CRYPTOCAP:BTC CRYPTOCAP:XRP

XRP BULL FLAG This xrp looks very bullish. I think we are just waiting on some major positive news developments for a catalyst to shove the price to new all time highs. Looking at the daily and weekly time frames, XRP bag holders should see some parabolic growth very very very soon.

XRPUSDBearish Flag valid , Instant entry! Plan shared in chart EP SL TP
Open two trades tp1 1:1, tp2 1:1.5

Bearish Setup Forms for XRP Below $2.21FenzoFx—XRP trades around $2.18 after forming a long-wick bearish candlestick above $2.17 support.
Stochastic reads 83.0, indicating overbought conditions. A close below $2.16 with a bearish engulfing candle could lead to $2.08. A close above $2.21 would invalidate the bearish outlook and open the door to $2.33.

Xrpusd cup and handle targetIf xrp triggers the current bullflag its in on the daily chart it should take price ell above the neckline of the cup and handleshown here on this chart and trigger its breakout as well which has a breakout target around $6.70. *Not financial advice*


2 potential breakout targets for the symmetrical triangle on xrpDepends on if the green trendline is the more valid top trendline or the light blue one is. *not financial advice*
Ripple Stock Chart Fibonacci Analysis 062325Trading Idea
1) Find a FIBO slingshot
2) Check FIBO 61.80% level
3) Entry Point > 1.96/61.80%
Chart time frame:B
A) 15 min(1W-3M)
B) 1 hr(3M-6M)
C) 4 hr(6M-1year)
D) 1 day(1-3years)
Stock progress:A
A) Keep rising over 61.80% resistance
B) 61.80% resistance
C) 61.80% support
D) Hit the bottom
E) Hit the top
Stocks rise as they rise from support and fall from resistance. Our goal is to find a low support point and enter. It can be referred to as buying at the pullback point. The pullback point can be found with a Fibonacci extension of 61.80%. This is a step to find entry level. 1) Find a triangle (Fibonacci Speed Fan Line) that connects the high (resistance) and low (support) points of the stock in progress, where it is continuously expressed as a Slingshot, 2) and create a Fibonacci extension level for the first rising wave from the start point of slingshot pattern.
When the current price goes over 61.80% level , that can be a good entry point, especially if the SMA 100 and 200 curves are gathered together at 61.80%, it is a very good entry point.
As a great help, tradingview provides these Fibonacci speed fan lines and extension levels with ease. So if you use the Fibonacci fan line, the extension level, and the SMA 100/200 curve well, you can find an entry point for the stock market. At least you have to enter at this low point to avoid trading failure, and if you are skilled at entering this low point, with fibonacci6180 technique, your reading skill to chart will be greatly improved.
If you want to do day trading, please set the time frame to 5 minutes or 15 minutes, and you will see many of the low point of rising stocks.
If want to prefer long term range trading, you can set the time frame to 1 hr or 1 day.

XRPI'm expecting a $1.80 tap before we take off.
We should begin moving up around the second week of July, after peace talks with Iran end. LOCK IN. 🔐
