Why the 95% failIt's no secret that over 90% of retail traders lose money. I am not talking about throwing some money into crypto and hoping for the moon type wins or losses. I mean actually trading and making a living from it.
You see, when you start, you are hungry for information - what's the best course, who has the best strategy, what if I trade 25 instruments on a 1-minute timeframe. Surely more profits...
After doing this for over 25 years, you get to see people come and go, sometimes they come back with a new idea and more funds to give the market.
But overall, some of the core problems are - all the gear and no idea.
Not only do people invest in screens, the latest hardware and of course the legendary Bloomberg subscription for 24/7 news.
What about indicators?
Has your screen ever looked a little bit like this?
The issue with more indicators is the majority of them lag to price action, re-paint or are simply not needed. Then combine that with the lack of experience, and you are left questioning do I buy or sell if my RSI is up but the moving average just crossed down?
You are not alone, most traders have been there if not all!
It is hard enough when even the brokers and exchanges fight against you - have you ever seen a scam wick directly to your stop and bounce?
What about the A-book vs the B-book?
In an A-book model, the broker passes their clients' trades directly to the market. Essentially, the broker acts as a middleman, executing trades on behalf of clients in the open market. This means that the broker's profits come primarily from commissions and spreads rather than trading against the client.
B-book, the broker takes the opposite side of the client's trades, essentially acting as the counterparty. Instead of sending trades to the open market, the broker keeps them internally.
The next one that always tickles me is the 100% win rate strategy that someone automated and for a few hundred dollars, it's all yours!!
Look, if there was a silver bullet, a 100% winning strategy you could buy off the shelf - we wouldn't have any other profession on the planet! The world's population would be professional traders. You know the saying " if it sounds too good to be true, it probably is".
You see Elliott waves where they have no right to be. Simply no logic or using them on a tick chart and hoping for miracles.
How about getting some financial advice from a spotty teen who rented a sports car for a video shoot this afternoon? Yeah, sounds like a good plan to help you retire young!
==============================
So, how to avoid all of these things?
Well, to start with, your tradingview chart, on a regular laptop or desktop with one screen, removing all the indicators and increasing the timeframe.
Then you reduce the number of pairs you look at and get to know them. Treat them like a new language. Learn the character traits, how they behave around major news events, what happens to them if the dollar goes up or oil drops 5%.
Don't treat trading like a game.
Instead, treat it like a business, use hours that suit your lifestyle. Deploy proper risk management. Don't see it as a one trade one win type concept. Treat it with respect and profit from it weekly.
You will find, when you learn to manage risk correctly, you care very little about markets going up or down. You tend to sleep with ease and a growing bank balance.
The market has plenty of soldiers fighting on its side, and it does its best to recruit you to fight against yourself!
In summary, less screens, less data inputs (indicators), less instruments, higher timeframes, ignore the influencers, Proper risk management and learn to understand there is no silver bullet.
Trading is statistics and that's all it is.
You can be very profitable with a low strike rate and a large risk-to-reward ratio. Or as simple as a 2% gain per 1% loss and a 50/50 win rate still makes you money!
Disclaimer
This idea does not constitute as financial advice. It is for educational purposes only, our principal trader has over 25 years' experience in stocks, ETF's, and Forex. Hence each trade setup might have different hold times, entry or exit conditions, and will vary from the post/idea shared here. You can use the information from this post to make your own trading plan for the instrument discussed. Trading carries a risk; a high percentage of retail traders lose money. Please keep this in mind when entering any trade. Stay safe.
XRPUSD trade ideas

RippleHow we feeling? This chart is very bullish. We didn't even get a retrace of the two prior peaks, so the price wants higher. Way higher. When you look at it in log, it's clear that $30 is in the headlights. It's kind of hard to deny.
I got into VVPR, and sold half in the profit, but the other half is lagging. I'll probably go heavier.
Good luck out there, and peace be with you.

XRP/USDFirst attempt at making a chart. I wanted something to refer to while watching XRP. Constructive criticism welcomed!
XRP SELL SETUP, Short from $3.35
SELL SETUP
Short from $3.35
Currently $3.35
Stoploss $3.70
Targeting $3.26 or Down
(Trading plan XRP go up to $3.46
will add more shorts)
Follow the notes for updates
In the event of an early exit,
this analysis will be updated.
Its not a Financial advice

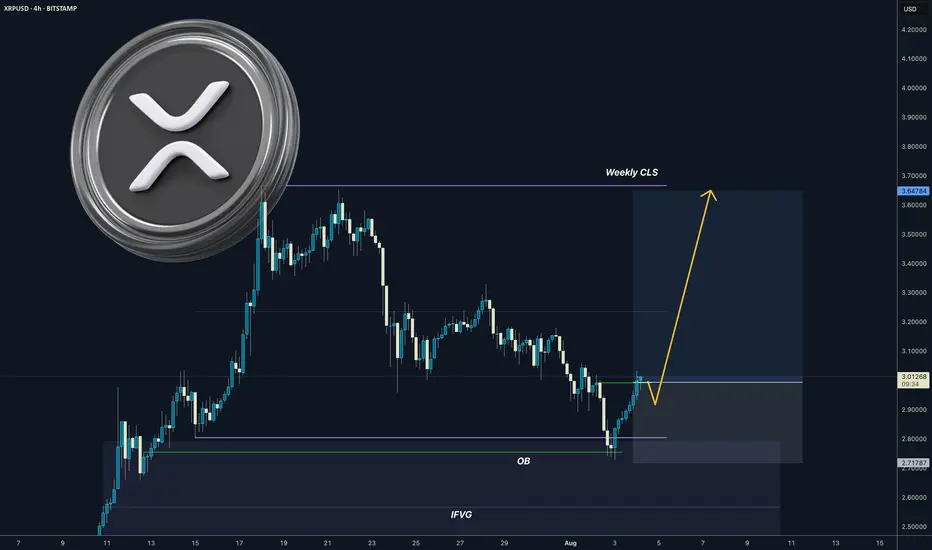
XRP I Weekly CLS I Model 1 I OB confirmations - Highs in playYo Market Warriors ⚔️
Fresh Crypto Analysis— if you’ve been riding with me, you already know:
🎯My system is 100% mechanical. No emotions. No trend lines. No subjective guessing. Working all timeframes. Just precision, structure, and sniper entries.
🧠 What’s CLS?
It’s the real smart money. The invisible hand behind $7T/day — banks, algos, central players.
📍Model 1:
HTF bias based on the daily and weekly candles closes,
Wait for CLS candle to be created and manipulated. Switch to correct LTF and spot CIOD. Enter and target 50% of the CLS candle.
For high probability include Dealing Ranges, Weekly Profiles and CLS Timing.
“Adapt what is useful. Reject whats useless and add whats is specifically yours.”
David Perk aka Dave FX Hunter
💬 Comment any Coin I ll give you my quick view
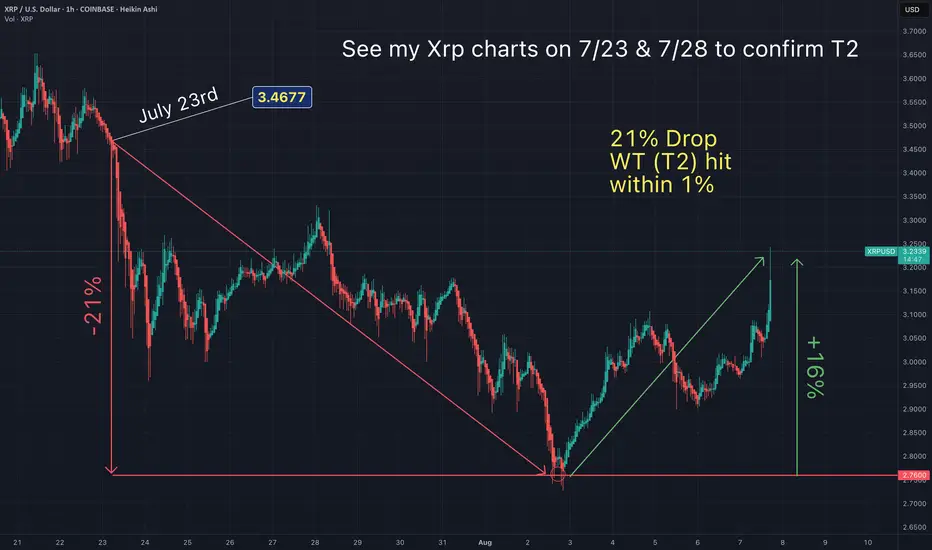
XRP short term price action (the next 1-3 days).Xrp has bounced 24% since my T2 target hit (see below). Now what!?
Here is my anticipated short term price action. I will be monitoring Xrp closely to dertermine
when and where I will be raising my stops. Anticipating price action helps me prepare for this and lets me know if/when my trading ideas get invalidated. I want to give my alt coins room to move, but I also want to keep my profits...as the market likes to "round trip" our gains.
May the trend be with you.
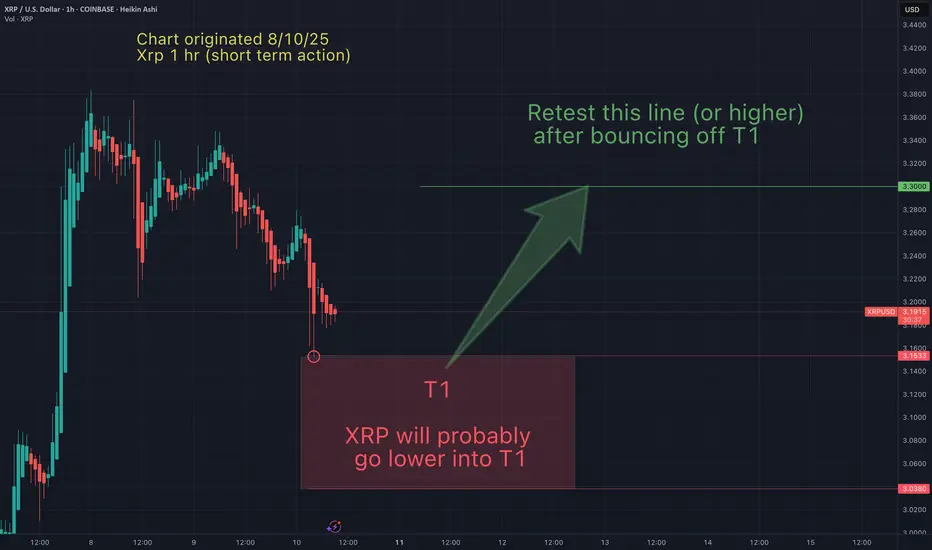
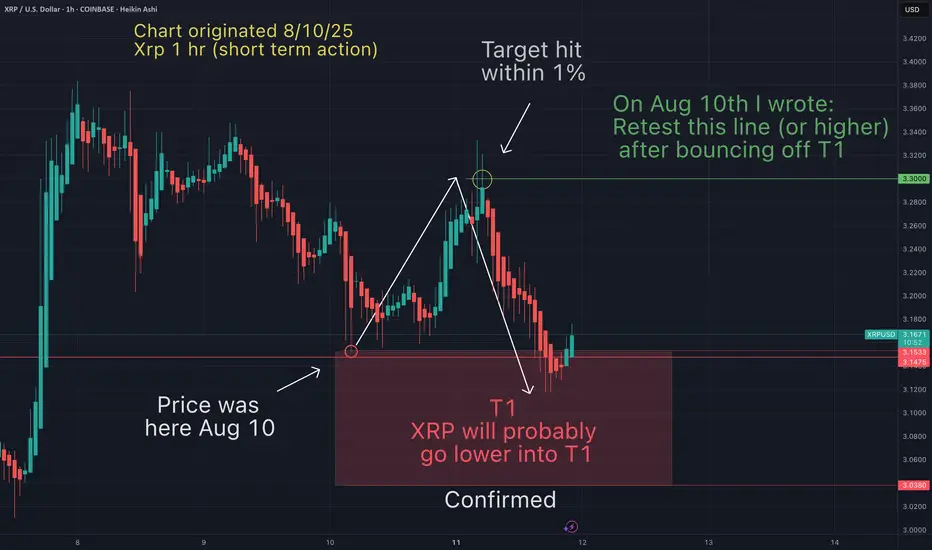
You will ask yourself "how did he know Xrp would do that"?On Aug 10th I suggested the following (see Aug 10th chart below to confirm):
1-My T1 (red box) had been hit, and expecting a bounce (confirmed)
2-Xrp would bounce up to hit $3.3 (confirmed within 1%)
3- After hitting $3.3, "Xrp will probably go lower into T1 (confirmed as of today)
4-Suggested this price action would complete within 1-3 days (confirmed)
Strangely accurate again. These patterns just keep repeating over and over. I can teach you how to identify them (currently accepting 2 new private students).
This chart illustrates that TA works in the short term as well (24hr period)). These principles can applied on ANY timeframe on ANY asset.
Once again I keep stats on my accuracy, and I would do the same for anyone I would follow. How else would I know if they are worth following.
May the trends be with you.
RippleI put Ripple in a fib channel. If we look at the potential within this channel, we can see that there's room to run. Ripple is a crypto, so I like to look to the .786 in crypto, but the .618 in stocks. Crypto just seems to do a little bit more. Let's assume the price spikes on Monday up to the .618. That's around $28 or so. I've been saying "$30 (sell $28)" for ages and ages. And now the moment is here.
I do think Ripple will blow through my $30 target, but when you look at my XRP/BTC charts - which is what you should be looking at), then you can see that after the $30 pump, a huge retrace comes right after with a $5-7 landing, before making an even higher swing high in the price and in satoshis.
You need to look at the XRPUSD and the XPRBTC, with both of them being of equal importance. If you're watching just one, then you're only seeing half the picture.

XRP Settlement August 15th, 2025 $33.00 & $1,031 May 23, 2026XRP is positioned for a major move on August 15th, 2025
when XRP reaches $30.00 - $33.00, it has two algorithmic delivery paths:
Path 1 (blue): Targeting $300 by August 23, 2026.
Path 2 (red): Parabolic extension to $1,031 by May 23, 2026.
“By the time you hear about it, it’s already too late.”
"News is the excuse for the moves."

Xrp - It all comes down to this!🚀Xrp ( CRYPTO:XRPUSD ) has to break structure:
🔎Analysis summary:
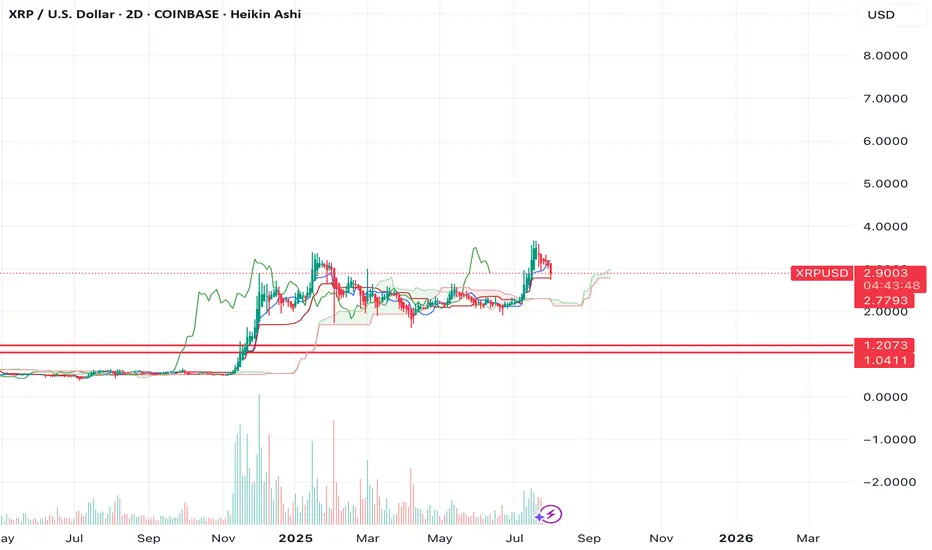
After Xrp created the previous all time high in 2018, we have been seeing a consolidation ever since. With the recent all time high retest however, Xrp is clearly showing some considerable strength. It all comes down to bulls being able to push price higher, above the massive horizontal structure.
📝Levels to watch:
$3.0
SwingTraderPhil
SwingTrading.Simplified. | Investing.Simplified. | #LONGTERMVISION

$XRP ENJOYERRRs see ya at $1.04-$1.20If we look at the chart of XRP, you can see that since the move in fall of 2024, we've had a massive lack of balance on the chart.
We ran up quickly without testing any levels as support.
That makes me think we're going to see the lack of balance get corrected and the same move is now going to happen in the opposite direction.
The $1.04-1.20 region looks like a good area of support to me.
You will ask yourself "how did he know Xrp would do that?Here's a simplified summary of my prediction made on 7/23 & 7/28 for my ideal entry.
Feel free to review my Xrp charts on those days to confirm.
I keep stats on my accuracy and so should you.
How else would you know what influencer to actually follow?
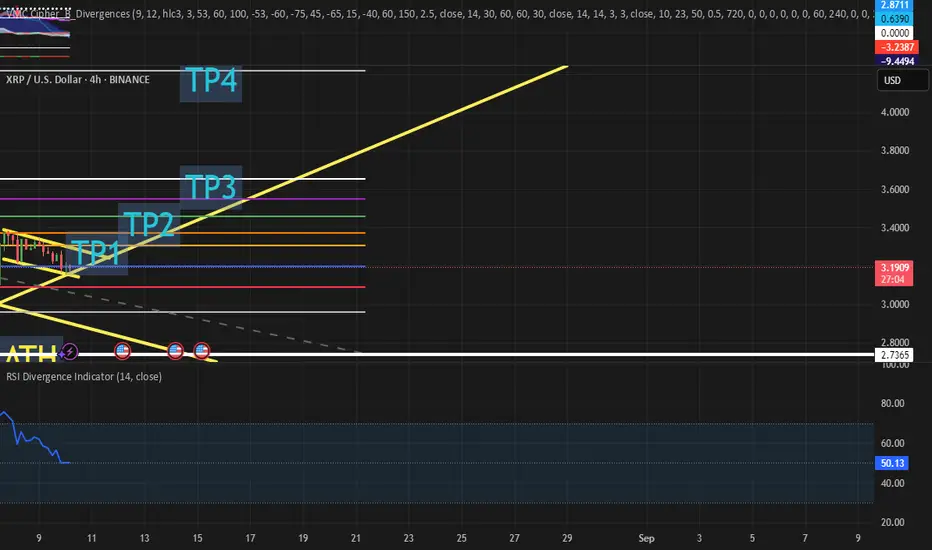
T2 bounce now confirmed. Are XRP and alts now heading to my T3?On July 23rd my chart anticipated a 25% crash. Then a bounce.
That has been now been confirmed. I have taken taken profits at the top of this current bounce on alts. But now I am anticipating Eth and alts to drop to T3?
I will post my altcoin T3 targets if/when they hold resistance below my recently hit T2 targets. But I assume alts will bottom when Eth hits my T3 target posted on July 23rd ($2950)

XRP Price Forecast: The SEC Case is Over — What’s Next for XRP?XRP Price Forecast: The SEC Case is Over — What’s Next for Ripple’s Token?
📅 Date: August 8, 2025
📈 Current Price: ~$3.33–$3.37 (+11% in 24h)
1. The Legal Battle is Finally Over
After more than three years of uncertainty, Ripple and the U.S. SEC have jointly filed to dismiss all remaining appeals, officially ending their long-standing legal dispute. The 2023 ruling stands: XRP sales on secondary markets are not securities — a regulatory green light that removes the biggest cloud hanging over Ripple’s future.
Why this matters:
Opens the door for institutional adoption without fear of legal backlash.
Boosts confidence among payment providers, banks, and fintech platforms to integrate XRP.
Positions Ripple as a credible player in global cross-border settlement.
2. Market Reaction in the Past 48 Hours
Price Surge: XRP jumped 11–13% in less than 24 hours, adding nearly $20B in market cap.
Volume Spike: Trading volume up ~200%, signaling entry of “smart money” and institutional flows.
Short-Term Targets: Market momentum hints at a move towards $3.50–$4.00.
3. Technical Analysis
Support Zones: $3.10–$3.20 (primary), $2.90 (secondary).
Resistance Levels: $3.50, then $4.00.
Indicators: RSI at ~68 (approaching overbought), Golden Cross formed — a strong bullish signal.
4. Fundamental Drivers Ahead
Expansion of RippleNet’s banking partnerships.
Growing role in cross-border payments — a $150T annual market.
Participation in CBDC infrastructure projects.
5. Price Forecast Scenarios
Timeframe Likely Scenario Bullish Scenario Key Triggers
Next Month $3.50–$3.80 $4.00+ Momentum, positive news
End of 2025 $4.50–$5.50 $6.00+ ETF approval, new banking deals
By 2030. $10–$15 $20+ Global adoption, CBDC integration
6. Entry & Exit Points
🎯 Short-Term Trade:
Entry: ~$3.30
Exit: $3.80–$4.00
📊 Medium-Term Position:
Entry: ~$4.20
Exit: ~$6.00
🌍 Long-Term Hold:
Entry: ~$8.50
Exit: $20+
7. Risks to Watch
Global crypto market corrections.
Slower-than-expected institutional adoption.
New regulatory hurdles outside the U.S.
💬 Final Take:
The removal of legal uncertainty turns XRP into one of the most asymmetric risk/reward opportunities in the current crypto landscape. Volatility will remain, but the medium-to-long-term upside potential is significant — especially if Ripple captures a larger share of the global payments market.
📌 This is not financial advice. DYOR and manage your risk accordingly.

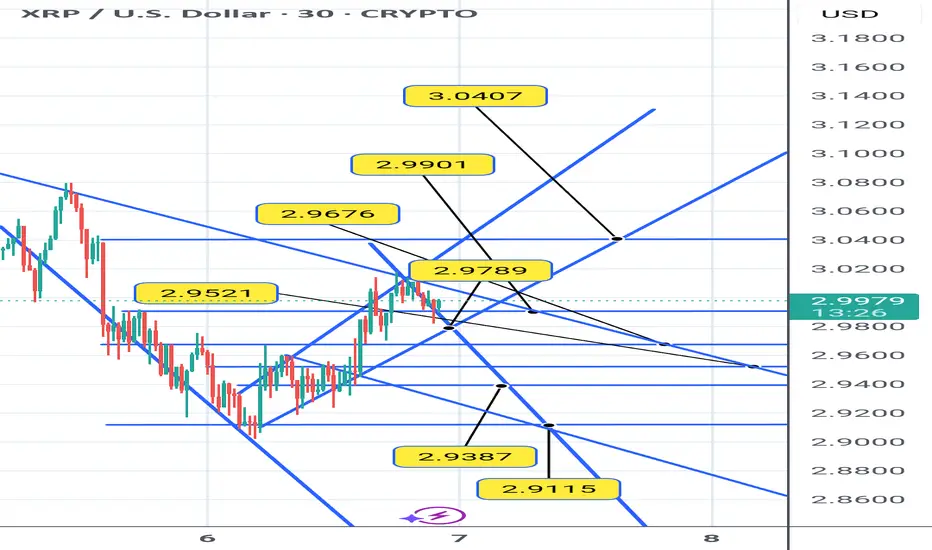
XRP Look For Buy As It Is Showing Trend Continuation PatternXrpUsd, peesonally for me it is showing trend continuation pattern per current market structure. Ideally it should not go down break below 2.9033. Look for your buy set ip before entering.
Target ideally above 3.6606 or the best case 4.1364.
Dont risk over 1% for this trade.
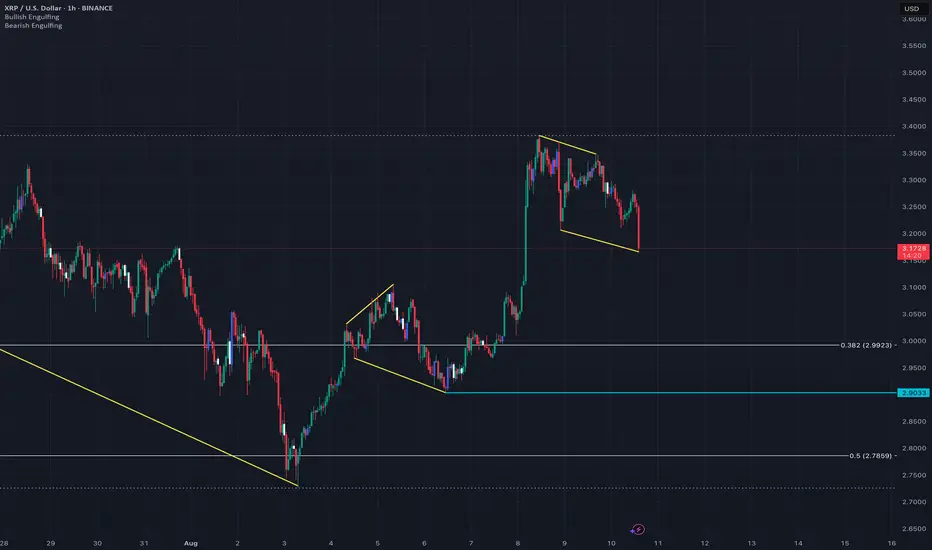
XRP long.. plan 8/10Xrp bouncing off the trend line from the most recent bounce from $2.72.. that was the 618 fib from April. strong level.. so its make it or break it from this $3.16/17 range. easy Sl under the wicks.. If it fails Id be looking for a $3.00 XRP.. would need to watch for conformations maybe a fail retest.. but well see .. Using the Fib levels as Tps.
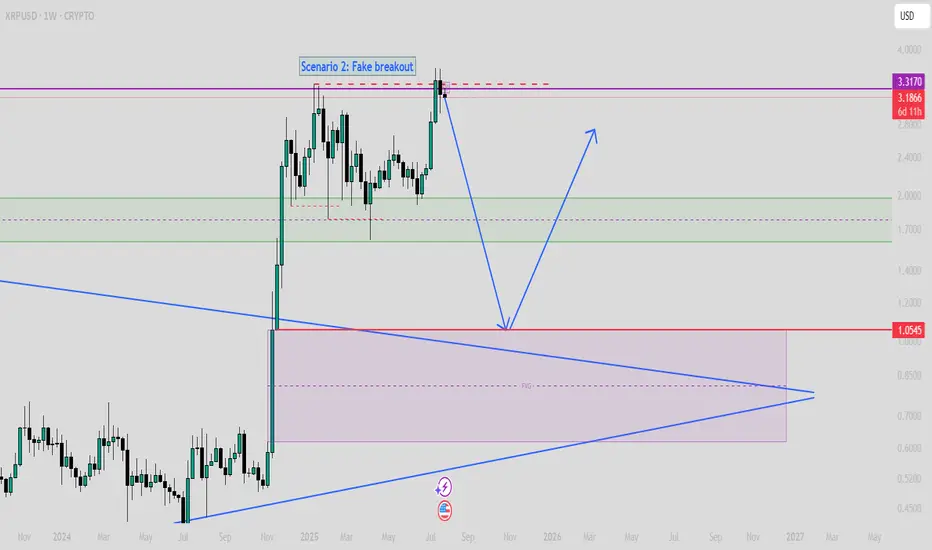
$XRP SCENARIO 2: Fake Breakout (Read caption)If XRP can't close strongly upper than $3.5 on the weekly time frame, then we must consider this scenario!
In this scenario, the first target will be $1.6, and then, based on time, even value around $1 is achievable.
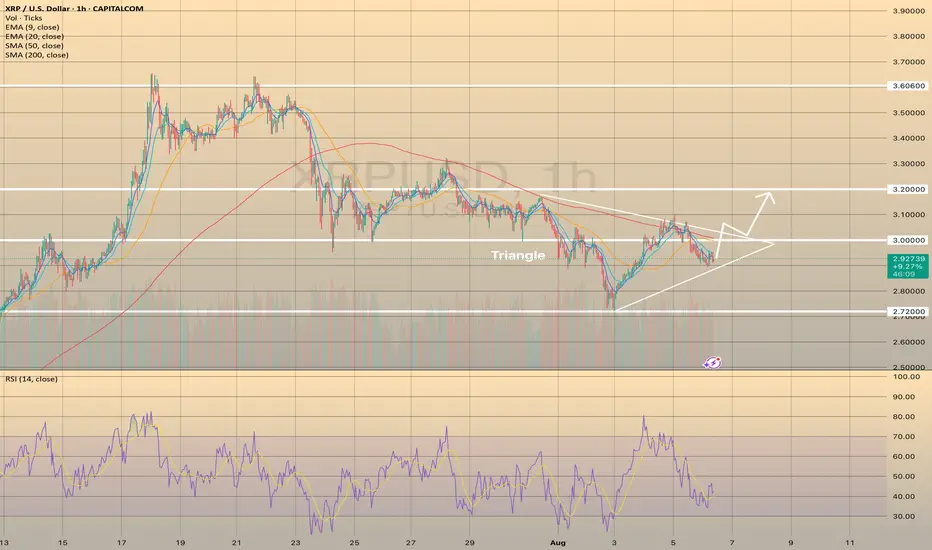
XRPUSD formed the Triangle pattern. The price may increase.XRPUSD formed the Triangle pattern. The price may increase.
XRPUSD has been declining since July 23, reaching the lowest mark at 2.72000 on August 3. Since then the price started to form the triangle pattern. It is not a reversal chart pattern, however, RSI indicator started to show some strength of the bullish momentum. In this case, if the price breaks through the SMA200 on hourly chart and holds above it and the level of 3.00000, the following rise towards 3.20000 is expected.
Xrp - This is the bullrun breakout!🔑Xrp ( CRYPTO:XRPUSD ) breaks the triangle now:
🔎Analysis summary:
After the recent bullish break and retest, Xrp managed to already rally another +100%. This is a clear indication that bulls are still totally in control of cryptos and especially Xrp. It all just comes down to the all time breakout, which will then lead to a final parabolic rally.
📝Levels to watch:
$3.0
SwingTraderPhil
SwingTrading.Simplified. | Investing.Simplified. | #LONGTERMVISION

XRP/USD – Failed Bounce, Bears in Control🔴 SHORT below $3.21 – targets $3.15 and $3.10
XRP failed to hold above $3.28 and dropped under its 200 SMA. RSI at 43 shows sellers still holding momentum. A close below $3.21 could send price toward the $3.15 zone quickly.
📊 Keywords: #XRPUSD #TrendBreak #CryptoShort #MomentumFade #BearishBias

XRPUSD – Fade then HoldXRP saw an early-week fade from the $3.12 zone and is now trying to hold support above the 200 SMA ($2.96). RSI is gradually turning back up (44.27 to 50+ range soon), showing first signs of stabilization.
XRP Path to 200XRP is so bullish.
Based on FIBS and Camarillas, this is a realistic path for the next 6 months to a year.
Gl hf.

XRPUSD Watches for Bearish Cypher PatternOn the daily chart, XRPUSD is consolidating at a high level. Currently, we can pay attention to the resistance near 3.4620, which is the short position of the bearish Cypher pattern. At the same time, this position is in the previous supply area.
