XRPU correction My vision where going price next wek.
Important area 2.350 if break it down price will fall to 2.250 and lower.
XRPUSD trade ideas

Ripple (XRP) Could Rally If Support HoldsFenzoFx—Ripple (XRP) has extended its downtrend from 2.650 to the key support at 2.30. XRP is currently trading slightly above this level.
The smart money index reads 1.28, matching prior lows where price previously bounced.
Support remains at 2.26. As long as XRP stays above this, a move toward the 2.44 resistance is likely.
Bearish Scenario: A drop below 2.26 would invalidate the bullish outlook, potentially opening the path to 2.06.

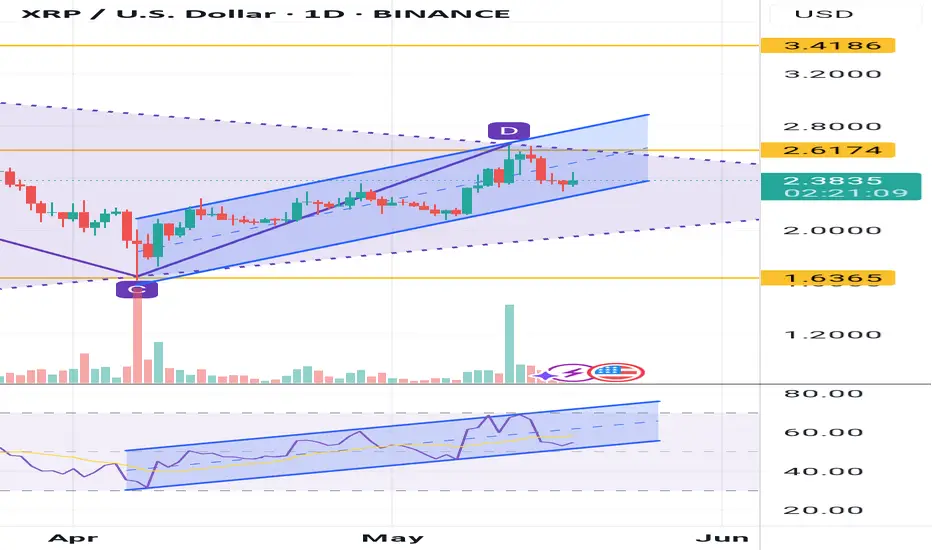
Xrp priceIf xrp stays in this daily channel . We must expect xrp break the weekly triangle in the next week . According to my last idea...if xrp breaks this triangle we would see a huge pump . It may rest above 3.68 fib mark which is 14 to 20 dollars.
What is XRP's actual potential? Technically and fundamentally, I see XRP reaching a maximum of $13, which is its technical target given the current range in which it is trading.

Ripple - what's next?
Ripple. This assumed wave II green may still under way as nothing impulsive of the blue degree has yet formed to convince that wave III.1 green (or 1st blue in the IIId) is underway. XRP possibly (optimistically) can continue going up now (will take a lot to explain), to that upper brown line (imo, channeling techniques), but not to the red one. Timing considerations send to end of July for the start of the next big wave, with the last corrective part (Z) tapping 3d time on the current trendline candidate and printing likely some reversal pattern. XRP is not out of the woods yet, but can go up locally, not more.

XRP at $7 in 50 days!Like the rest of the market XRP has been stalling a bit for the last few days.
The coming 50 days will give us several new ATHs, though.
For this scenario to play out, we need a strong break out from $2.57 and a strong support from $2.60.
Look at the chart and find the minor pullbacks going up to around $7 !
God speed to all of you !

XRPXrp has had a great pump from the bottom ,reclaimed the 200 day and the 20 (in green).went back retested the 200 broke out of its downward channel now currently retesting the 20.. if market conditions stay as they are with no surprise black swan events the ship can get going real soon.

XRP/USD – Bullish Reversal in Progress After Wave 5 Completion📊 XRP/USD – Bullish Reversal in Progress After Wave 5 Completion
Timeframe: 1H
Structure: Elliott Wave + Divergence + Break of Structure
Indicators Used: Awesome Oscillator (AO), Fibonacci Retracement, Market Structure
⸻
🧠 Wave Count & Structure Analysis
We’ve just completed a clean 5-wave Elliott impulsive structure to the downside:
• ✅ Wave 1–5 clearly marked with strong bearish momentum
• ✅ Wave (3) and Wave (5) show bullish divergence on the Awesome Oscillator (AO) – a classic sign of weakening bearish momentum and potential reversal
• ✅ Wave (5) completed at the bottom with confluence from price action and AO divergence
⸻
🔁 Break of Structure & Confirmation
• ✅ Break of structure (BoS) occurred at 2.35064, confirming the end of the bearish impulsive wave and the start of a potential ABC corrective phase
• ✅ The BoS also coincides with a dominant structure break, giving higher confidence in the trend shift
⸻
🟦 Current Price Action: ABC Corrective Wave Forming
We’re now in the early stages of a bullish corrective wave (ABC):
• 🔹 Wave A has likely completed
• 🔹 Currently expecting a retracement to form Wave B
• 🔹 Wave C target is projected based on Fibonacci extensions between 1.618 to 1.88, offering a high-probability take-profit zone (TP1)
⸻
🎯 Trade Setup
Pending Buy Entry:
• 📍 Entry Zone: Fibonacci retracement between 0.382 – 0.618 of Wave A
• 🎯 TP1: Fibonacci extension of Wave C between 1.618 – 1.88
• ❗ SL: Just below Wave (5) low or below 0.618 zone, depending on risk tolerance
⸻
🧩 Confluences for Bullish Setup
• ✅ Elliott Wave completion (Wave 5)
• ✅ Bullish Divergence on AO
• ✅ Break of Market Structure (BoS + Dominant BoS)
• ✅ Retracement into Fibonacci golden zone (0.382–0.618)
• ✅ Measured C wave extension to 1.618–1.88
⸻
📝 Summary
The market has shown strong technical signals for a bullish corrective move after a clean Elliott 5-wave completion. With a confirmed divergence, break of structure, and upcoming ABC retracement, this setup offers a solid risk-to-reward opportunity. Watching the buy zone closely for a pending long trigger.
⸻
🔔 Disclaimer:
This is not financial advice. Always conduct your own analysis and manage your risk accordingly.

XRPHighly likely XRP retest $2.20 before moving higher.
Long-term investors are looking for lower prices before a tariff deal with China. A liquidity sweep is needed before we move higher, or we will continue moving lower.
We break $2.50 and we will see $3 quickly after. ETF going Live on the 19th, China deal, SEC case ending will all catapult price.
LOCK IN 🔐

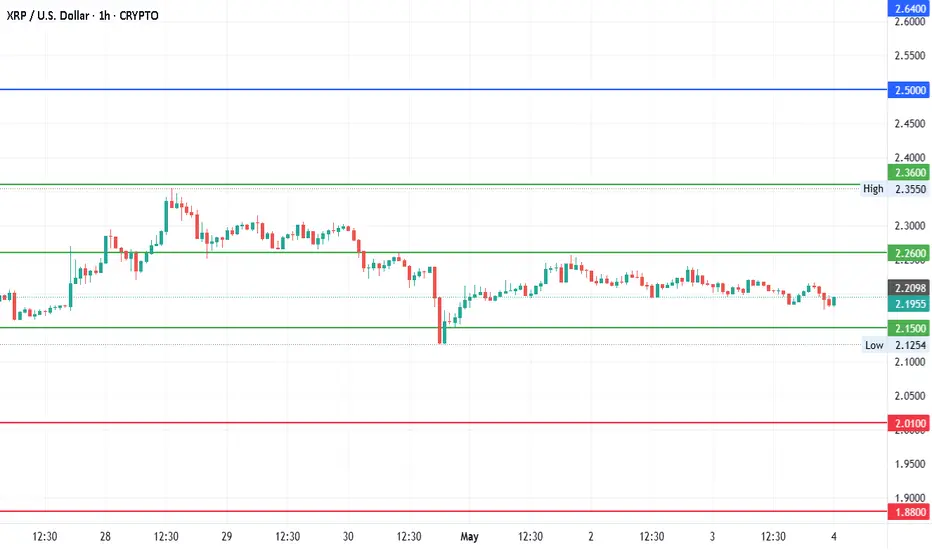
XRP/USD Bullish Reversal Setup – Demand Zone Reaction Confirmed!Hey traders! Here's a fresh 1H chart analysis for XRP/USD, and things are getting interesting...
Key Highlights:
Support Held Strong: XRP bounced perfectly off the key demand zone at 2.31246 - 2.37028, marked by strong historical buying pressure.
Reversal Signal: Price rejected the bottom of this zone with a bullish engulfing candle and is now trading at 2.37583, confirming a potential reversal.
Target Zones:
TP1: 2.49390 – previous structure and mid-supply level.
TP2: 2.60317 – major supply zone where price previously sold off.
Watch For: Volume confirmation and candle closings above 2.375 to validate continuation.
Indicators Used:
LuxAlgo Supply & Demand Visible Range
Price Action + S&R
Market Structure
Bias: Bullish – As long as price holds above 2.37028, we remain in a buy zone.
Strategy Idea: Long from current levels or on retest of 2.370 support. SL below 2.31246. Trail SL as price approaches TP1.
Let me know your thoughts below! Are you buying XRP here or waiting for a stronger breakout?
#XRP #Crypto #PriceAction #SupplyAndDemand #TradingView #TechnicalAnalysis #Altcoins

Xrp priceBased on weekly triangle . By the end of july xrp should make a move, if it breaks the triangle based on fib it may go to 3.68 mark . Which is 14dollars.

XRP/USD – Still Bullish Despite the Pullback
We’ve seen a temporary rejection at the $2.65 zone, but make no mistake — the macro structure is still intact.
📉 Current price action on the 14D shows a pullback, but zooming out across the 2D and 12H confirms consolidation within the bullish continuation pattern.
🔹 $2.21 is holding
🔹 Trendline from the 20H low remains respected
🔹 No break of structure — just retracement, not reversal
🧠 Most traders get shaken out during pullbacks like this. But if you know structure, you know the game plan stays the same.
#XRP #Ripple #CryptoCharts #TechnicalAnalysis #PullbackNotPanic #BullishMarketStructure #SwingTrading

XRP LONGConsolidating nice here, Hodling this baby, $6 soon, based on fibs, Log, Wouldnt $32 be nice by Jan 2027!
Did anyone expect the first pattern to get a full 100% extension! NOOOOOOOOOO.

XRPWe are fixing to witness a run to $3 in a hurry.
New outlets, governments, banks, institutions, are all diving into crypto. An ounce of great news for XRP sends us moving up in a HURRY.
Have an exit strategy in place to take profits, and cycle some profits into other assets to continue to build your wealth.
Lock In.

XRPUSD - Looking for wave c completion.Trend:
Major Trend : Bullish
Minor Trend : Retracement
Note:
Looking for the completion of Sub-wave C of Wave ii.
This is just my point of view. No trade recommendation. Please do your own analysis before placing any trade. TAYOR.

Price targets for the upcoming Ripple plansIf all plans with etf and tokenization of assets are realized we may see XRP prices around 10$

XRP - WHATS HAPPENING HERE?Good Morning,
Hope all is well. Where is XRP heading ?
Initially when I look at this chart, I do see some rejection at the 2.65$ mark. I found a secondary rejection at the 2.57$ mark. Also noted that there is some divergence in volume in between the last short term high and most recent short term high.
There is still some gusto in the RSI area to go up again however I would not hold my breath. If XRP continues to drop it would suggest a pull back to earlier trend.
Right now there is not much direction as to where XRP would go after reaching the short term support at 2.37$
Lets keep our eyes on this one.
ENJOY!

XRP to $11XRP has a lot of patterns and things to show us the price about $11.
The first pattern is the double bottom on weekly from 2018 till now, and the target of that is $11. The second thing is the Fibonacci extension for the 100% movement of the recent movement on XRP from November 2024, and that is $11.
The last pattern is the bull flag that XRP made recently and the target of that is $11.

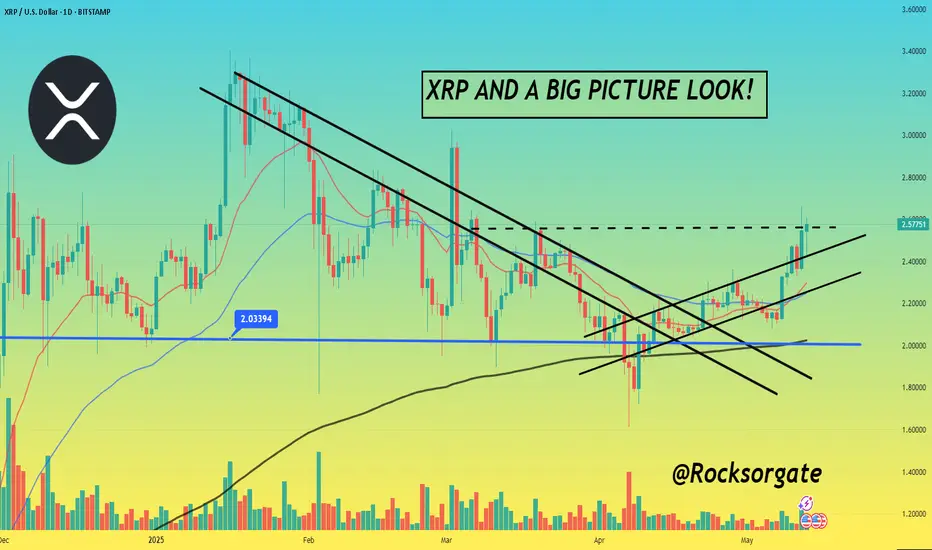
XRP AND A BIG PICTURE LOOK!🥂 Hey hey, hope everyone's doing well! Great to see how things have been moving this week for the market as a whole, especially for digital assets with XRP leading the pact, been a while since we did a big picture look at our technical so figured we'd do a quick update and as always thanks for giving me a few minutes of your day.
🥂 First thing off the bat is XRP breaking $2.5, in our latest idea we spoke on XRP and we're watching for a retest of that $2.48-5 level which proved to be successful and we kept within our ascending channel even breaking out of it as I'll show in the chart below on the hourly time frame:
🥂 So not only did we keep within the ascending channel but we broke out of it and have kind of formed this new channel which is gonna gave a much better look on the shorter time frames now that we know we can watch this for bullish or bearish trends, pivots.
🥂 Main challenge on the hourly is to keep above that channel and if we do retrace and enter the channel next goal would then be to avoid falling out of that channel, keep pushing much like we did with our ascending channel that helped us get the confirmation we wanted and see that $2.5 successfully get retested and beat.
🥂 Next thing up is our chart below, I went ahead and added a Fib. Retracement to give us some clarity on where we stand right now for a big picture view and we can see that as we stand right now, we're at this pivot basically. $2.5 is that make or break it point so now we'll have to see if bulls can sustain enough pressure to keep above $2.5.
🥂 One good thing to note is that each time we retest these levels we have more and more support and positive sentiment behind XRP and Ripple which continues to build and form partnerships thus every time we hit these levels there are more and more people and financial institutions that believe in XRP and the coin only grows stronger with every retest and with each and every single day.
🥂 Whether we keep the pressure and break, keep pushing upwards or retrace and fall back the same fact will stand true, XRP will continue to build it's backing and continue working towards it's goals and cementing itself in the future as we know it. I can definitely see XRP hitting $3-5 within the next few months if the company keeps playing it's cards right and the SEC approves a Spot XRP ETF which would be a solid win to say in the least.
🥂 Definitely keep all this in mind and feel free to add to your own charts, we're at a pivot point on the daily and for the hourly I would watch those channel's and that EMA, that's about the main things for right now.
🥂 And as always, thank you so much for the support, really appreciate it and hope everyone's having a great day, and many blessings, let's keep at it and stay tuned for more!
Best regards,
~ Rock'
XRP Inverted Head and Shoulders – Watching for Resistance!🚀 CRYPTOCAP:XRP Inverted Head and Shoulders – Watching for Resistance! 📈
CRYPTOCAP:XRP has formed an inverted head and shoulders pattern and has broken out of the neckline (purple zone). However, we’re approaching a red resistance zone, and when the price reaches this level, there could be some retracement before continuing upward. 📊
Let’s monitor this move closely! 💼💸

XRP Roadmap: 30-Day Scenarios Toward Wave 3 BreakoutXRP Outlook – What to Watch Next
XRP is still coiling inside the ascending triangle with key resistance at $2.65. A confirmed 4H candle close above $2.65 with rising volume could trigger a breakout toward $2.72, $2.84, and potentially $3.35.
If price breaks below the trendline, watch support at $2.44 and the golden zone around $2.30 for possible re-entries.
Volume is the key — no breakout happens without it. Keep an eye on the triangle apex as we approach it.
Scenario 1: Standard Breakout – Wave 3 Unfolds (Most Likely)
• Trigger: 4H or 1D close above $2.65 with volume surge
• Progression:
• $2.72 (minor resistance / psychological level)
• $2.84 (Fib 0.618)
• $3.35 (Wave 1 extension match)
• $3.99–$4.39 (1.618–2.0 extension of Wave 1)
• Timeline: This could happen in 10–21 days, with fast moves once $3.00 is cleared
• What to Watch: RSI entering 75–85 zone, followed by volume cooling at targets (TP zones)
⸻
Scenario 2: Shallow Pullback, Delayed Breakout
• Trigger: Small rejection at $2.65, triangle holds
• Action: Price dips back to $2.48–$2.44, finds support, builds a new base
• Outcome: Another squeeze toward $2.65+, eventually breaks by late May
• Timeline: Slower grind, breakout could occur around May 20–25
⸻
Scenario 3: Deep Retest Before Blastoff
• Trigger: Triangle breaks down, sentiment dips
• Action: XRP pulls back to $2.30 or even $2.13–$2.20 (EMA 200 area)
• Outcome: Strong bounce forms Wave 2 low — then Wave 3 initiates from a deeper base
• Upside still intact, just a cleaner setup for large players
• Timeline: 2–3 week base, followed by sharp breakout in late May/early June
⸻
Scenario 4: Immediate Parabolic Spike (Low Probability, High Reward)
• Trigger: Breakout + major catalyst (BTC dominance drop, Ripple news, SEC headline)
• Action: XRP surges straight through $2.65 → $3.00 → $3.50 → $5.00+
• Outcome: Blow-off Wave 3 in under 2–3 weeks
• Watch for: RSI over 90, unsustainable vertical moves, volume going exponential
• Timeline: Rapid — all within 10–14 days max

XRP / USDCurrent Price:2.1950
Mid-range: Between 2.15 and 2.36
Upside: 2.50, 2.64, 2.78 and 2.92
Downside: 2.01, 1.88, 1.73 and 1.59
Weekly trading plan for XRPIn this idea I marked the important levels for this week and considered a few scenarios of price performance
It is better to consider the risks at local resistance and in case of correction we expect to see a reversal above the pivot point
Write a comment with your coins & hit the like button and I will make an analysis for you
The author's opinion may differ from yours,
Consider your risks.
Wish you successful trades ! mura
