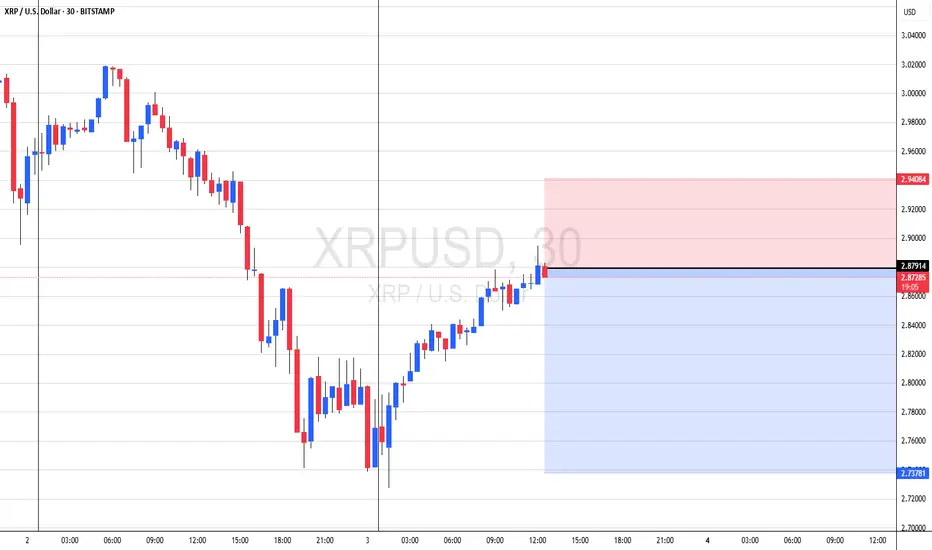
XRP/USD Long Setup – Bullish Bounce from Key Demand Zone!XRP is showing early signs of a bullish reversal after a strong rejection from the $2.74–$2.90 demand zone. Price has started to push upward, forming a higher low structure on the 4H timeframe, suggesting a possible continuation toward higher levels.
🔍 Technical Breakdown:
Demand Zone (Support): $2.74 – $2.90 (Strong buy zone highlighted in orange)
Current Price: $2.987 (Trading above the demand zone with higher lows forming)
First Target (TP1): $3.231 (key structure resistance)
Second Target (TP2): $3.549 (supply zone where previous selloff began)
✅ Bullish Confluences:
Price bounced cleanly from demand zone
Bullish market structure with higher low
Visible volume support at current levels (LuxAlgo VRVP)
Room to move into imbalance above
📌 Trade Setup:
If momentum continues and XRP holds above $2.90:
Entry Zone: $2.95 – $3.00 (current level)
SL: Below $2.74 (beneath demand zone)
TP1: $3.231
TP2: $3.549
🧠 Notes:
Break and close above $3.231 would open the path to higher levels
Watch for consolidation before breakout
Supply zone at $3.549 is significant — partial TP is wise
🟢 Bias: Bullish
XRPUSD trade ideas

XRP - IH&SLike I said in my last post, xrp was to hit 2.80. Nailed it. Right on the money!
Now, it seems like we're printing an IH&S. No other real patters are matching up l well. We finally have some liquidity in the market to chart some rough patterns.
I'm seeing a little push up off the bottom BB - to 3.12 ish? But rejection back down to the daily pivot for the right shoulder. And acuminate there prior to any news from the SEC. And then were primed and strapped to a rocket!
But honestly, who really knows what these MM have in store. So stay light on your feet in this area.
Roll them bones for it!

Ripple (XRP/USDT) – $4 Breakout in SightTrend:
XRP remains in a strong uptrend on both Daily and 4H timeframes.
Price is holding above 50 EMA and 200 EMA, confirming bullish structure.
Pattern:
Ascending triangle forming with resistance at \$3.50.
Higher lows indicate aggressive buying pressure.
Breakout target from the pattern projects toward \$4.00 – \$4.20.
Key Levels:
Support: \$3.15 – \$3.20 (major demand zone)
Resistance: \$3.50, then \$4.00
Breakout Trigger: \$3.50 (4H close with strong volume)
Indicators:
RSI in bullish territory (above 60) but not overbought.
MACD showing steady bullish momentum.
Volume spikes align with upswings, suggesting institutional buying.
Trade Plan:
Entry (Breakout): \$3.50 – \$3.55 on 15m/1H close above resistance with volume.
Stop-loss: \$3.25 (below last higher low)
TP1: \$4.00
TP2: \$4.20 – \$4.30 (extended breakout target)
Bias: Bullish while price remains above \$3.25 support.
📈 XRP is coiling just below multi-month resistance. A confirmed breakout above \$3.50 could open the door to a fast rally toward \$4.00 and beyond.

Can XRP hit 10$ in 2025 ?Can XRP hit 10$ ???
if you see this XRP CRYPTOCAP:XRP chart, all 12 years of history, you can see simple & clean,
12 years ago XRP price was 0.00286$ only, and recentl XRP created ATH 3.66$
in 2017 XRP Price 0.003$ and from there XRP Showing big Rally
The past 8 years 1,22,000% price increase
i'm highly confident we can see 10$ mark as well,
The next target is already mentioned in the chart, along with price details.
Share with others and follow now @GlobalRashid for more content like this.

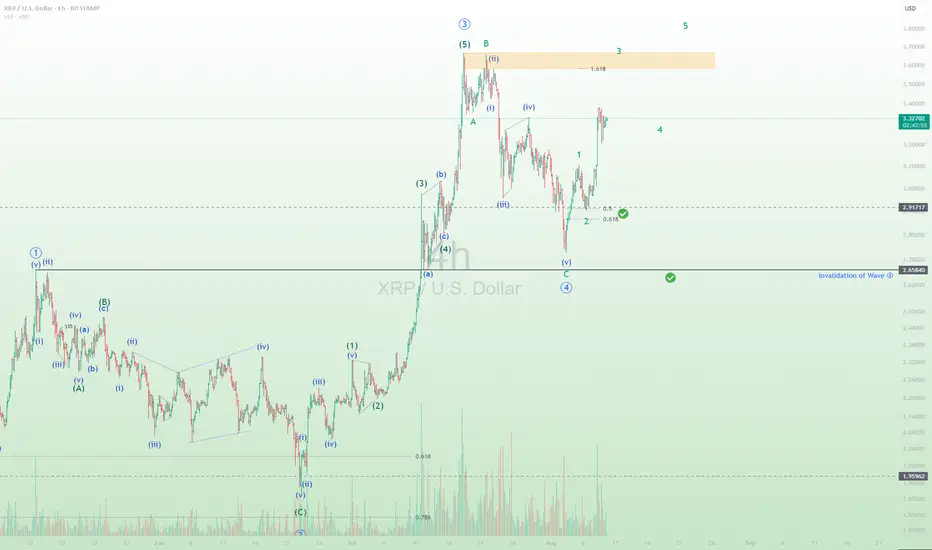
XRPUSD is going for Wave 3Trend: Uptrend continuation.
The price already completed wave 2 at 50% retracement and now continues her journey to wave 3 in 5 subwaves. The minimum target of Wave 3 is near the resistance level of the previous high, as shown in the chart.
This is only my perspective of EW counting for XRPUSD. Not recommended to trade based on my perspective, as it may be wrong. Advice: Do your own TA prior to trade.
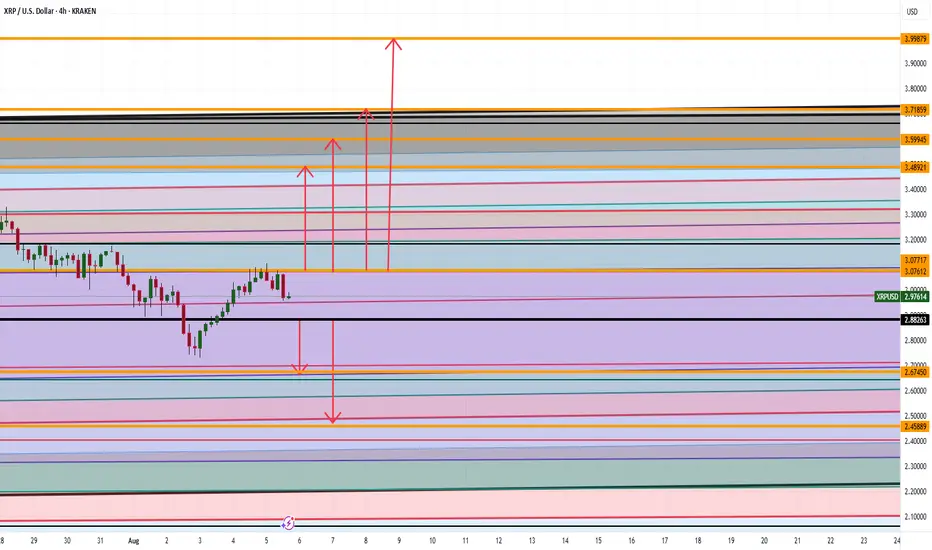
XRP ARE WE GOING TO $4 ANALYSIS Good afternoon
So looking at XRP we can spot a couple things :
Bullish Side: If we can break the high at 3.07 then 3.48,3.59,3.71, and 3.99 makes sense
Bearish Side: If we go below 2.88 then a drop down to 2.67 then 2.45 makes sense
Trade Smarter Live Better
Kris
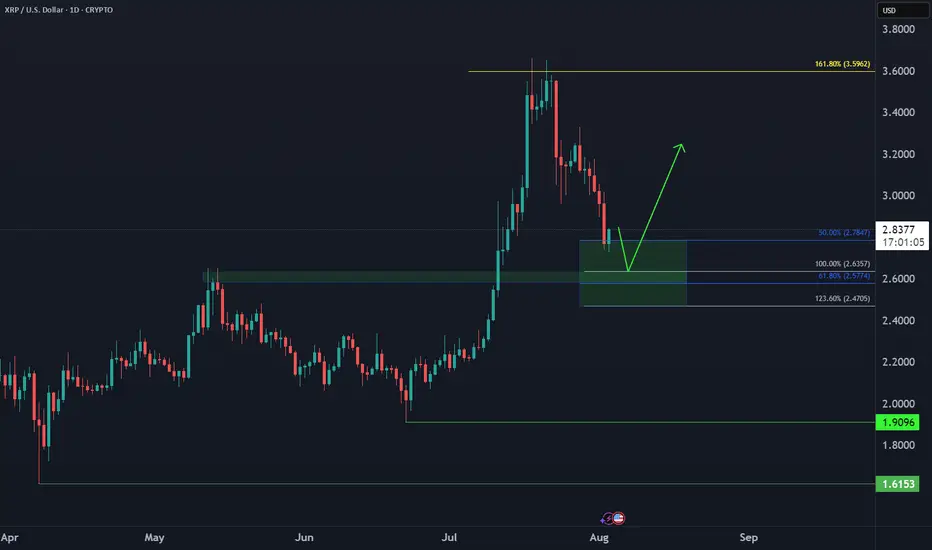
Ripple XRP Bullish Reversal📈 CRYPTO:XRPUSD dropped in 3 swings vs June low, now in buy zone $2.78–$2.47. Marginal lows still possible, but bounce expected next week from this extreme area.
XRP breaking wedge2 for 2 on here now. IH&S went according to plan. Rested on the daily pivot and now its off on good news for their appeal drop.
Now were breaking out of the falling wedge. Next target is 3.56 supply then 3.74, daily r1 pivot.
Watch inflow for support. Could see some shake downs. Remember, this bad boy, and others like it are ONLY MOVED by institutions. Market Makers. You and me, we don't have the capital to drive them one red cent. So, any real quick move was for a reason. And its not for the sake of retail.
Follow for more bangerz

#XRPUSD Shows incomplete Seq, and its a BUYBINANCE:XRPUSD Currently misses one more swing higher to complete its 5th swing. So we strongly recommended buying this Crypto for one more push higher.

Working to move to the upsideMy views on XRP still hasn't change since my last article. The price action has been quite volatile, but if you look at it in the higher time frames such as monthly/weekly/daily, I think XRP is still working to move to the upside.
Daily:
1) The price has found the temporary support at Fib 0.5 level and EMA55.
2) yesterday's daily candle closed above $3.07 area (previous major resistance area)
3) Both RSI and MACD are still in the bull zone.
4) Stochastic has reached the oversold territory the lines have crossed and now are moving to the upside.
XRPUSD Is Heading Up, The Best Case Above 3.66Possibility for xrpusd as well to go up. As we have complete h4 expanding flat.
The stop could be below the low of the latest low of bullish engilfing candle. The best case we can go all the way up above the high of July 2025, 3.66.
Dont risk more than 1 % for this trade.


XRP — Weekly Outlook (9–16 Aug 2025)Short-term bias tilts bullish-neutral, with a breakout above $3.42 potentially triggering a rally toward $3.70. On-chain metrics are improving, derivatives remain balanced, and the post-SEC-case momentum is still alive — but all eyes are on the upcoming US CPI release for the next decisive move.
Current Price: $3.32 | Market Cap: ~$197B | 24h Volume: ~$7.5B
📰 Market Context
Regulatory breakthrough — the SEC vs. Ripple case has officially ended with a $125M fine and a ban on direct institutional sales. This removes a major legal overhang while keeping some restrictions in place.
On-chain activity shows XRPL transactions and active accounts (7-day moving average) trending higher compared to June, indicating renewed network usage post-July rally.
Derivatives market remains balanced: Open Interest is steady at ~$3.4B with only ±1% daily change. Funding rates are slightly positive at +0.01%, showing mild bullish sentiment but no overextension. Liquidations in the last 24h are ~$15–16M — within normal range.
📊 Technical Levels
Main support is at $3.15 (20-day MA). If that breaks, next supports are $3.05–$2.95, then $2.70.
Immediate resistance is $3.40–$3.42; a breakout here could open the path to $3.60–$3.66.
RSI (14D) is between 55–62, suggesting moderate bullish momentum. MA-20 sits at $3.15, MA-50 at $2.61.
📅 Key Macro Event
The US CPI report for July will be released on 12 Aug 2025 at 12:30 UTC. Expect volatility as inflation surprises can shift USD strength and global risk appetite.
📈 Weekly Scenarios
Base (55%) Consolidation — consolidation between $3.15 and $3.42 if price holds above $3.15 with neutral OI and funding.
Bullish (30%) Breakout — breakout above $3.42 on strong volume and a $200–300M rise in OI could push price toward $3.60–$3.70, possibly retesting $3.66.
Bearish (15%) Pullback BITSTAMP:XRPUSD — break and close below $3.15 with rising long liquidations could trigger a move to $2.95–$3.05, and in extreme conditions down to $2.70.
✅ Action Points
Watch for a breakout above $3.42 with confirmation from OI and trading volume.
Track XRPL active accounts and payments — if they rise with price, the move is more likely sustainable.
Consider adjusting leverage or widening stops around CPI release time to handle potential volatility.
💬 My view: Short-term bias is bullish-neutral, with upside potential if $3.42 breaks on strong volume. Macro data and on-chain metrics will determine if the rally can extend.

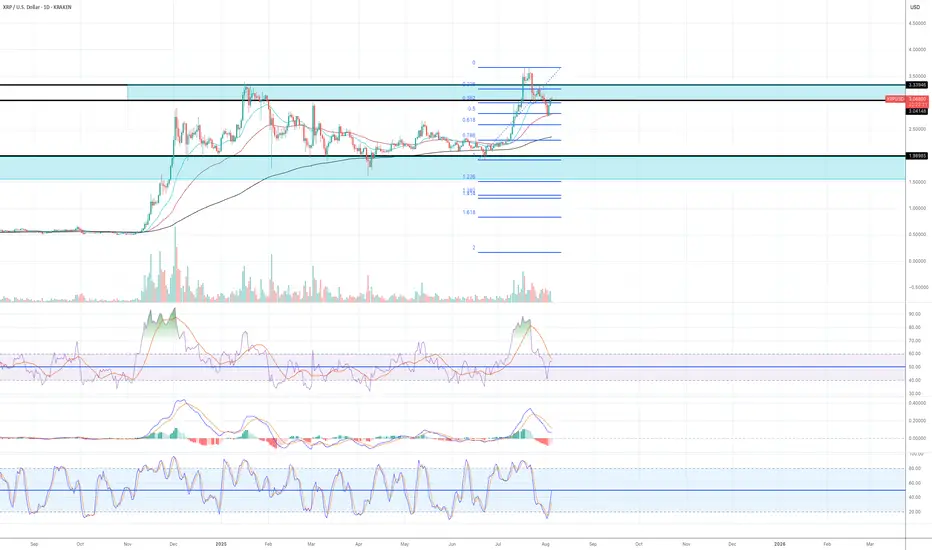
XRP retracement levelsWhere is XRP next likely to head next?
$2.65 is the next price level down with 4 points of contact. This level was also a weekly high as well as the 0.5 fibbonachi.
Next level down is $2.34 with 6 points of contact.
There is a downtrend forming so a breakout of this trend could be bullish for XRP 📈
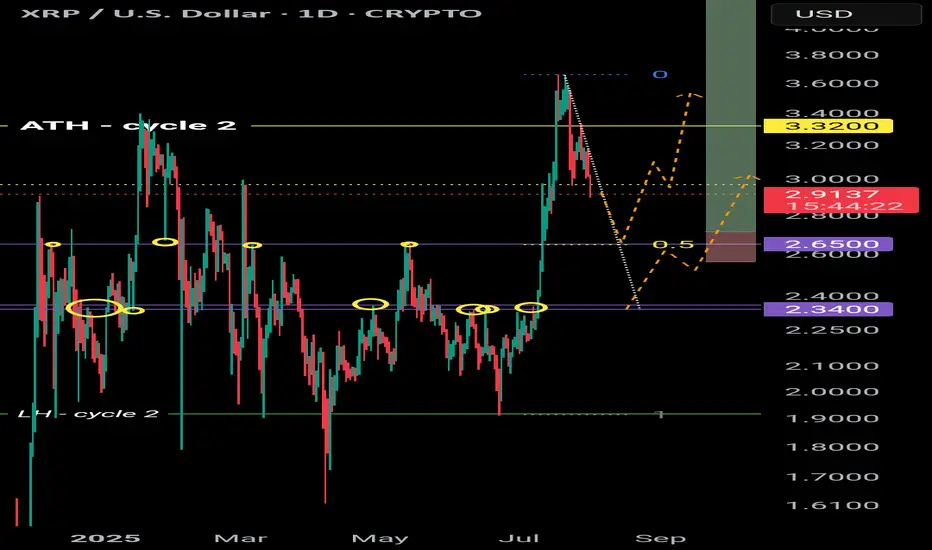
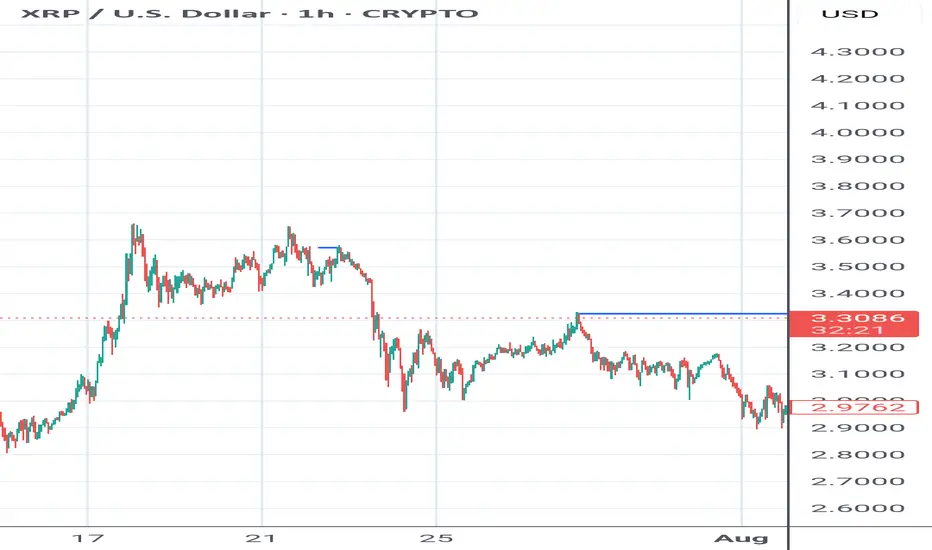
XRP/USDNew chart following the spike.
Currently battling at previous 2 week high around the 3.31 mark. I see a retract back to the 3.11 mark with a return to 3.76 region.
If we are lucky enough to reach the 3.57 mark i am planning to do a healthy profit grab with anticipation of a possible quick drop.
This is my second chart. I have enjoyed learning and observing everyone's charts. I am open to any suggestions on how to improve accuracy.
XRP ?
Hi
Don't miss 3-3.05 range
I think it's a value area for now.
Risking 0.05c only
Potential Upside as per previous analysis, AI etc
All the best
Not a guru

XRP Consolidation pattern breakout imminentLooks to me like XRP is breaking out of a rectangle or consolidation pattern as we speak.
Pattern formed since NOvember 2024 and since then XRP has been trading in this range.
Our current weekly candle is clearly in the process of attempting a breakout above the upper band or resistance trendline of the consolidation pattern.
We still have a day for candle close of this week.
Look to see if a potential engulfing candle print occurs or not.
Also note, this is by no means confirmation of the pattern break. We would need a concise bullish candle pattern for the next week to print for COnfirmation.
If we do confirm breakout. XRP will be back in price discovery mode like BTC. And i personally wouldn't sleep on it.
Its one of the better performers in crypto and seems like to me with every passing day a major player like BTC. (Opinion based on TA)
I would also monitor the MACD indicator. Observe for increasing histogram bars and deep green color as well as bullish cross.
On Macro timeframes, being above the 0 line on MACD is always bullish until we cross below.

XRP - The Unpopular Analysis!XRP printed a macro triangle from 2021-2024. Triangles are an Elliot wave pattern resulting in a terminal thrust up in a motif wave before price returns to the bottom of the triangle at $0.28! Now this seems extremely unlikely given whats going on fundamentally but I don't make the rules so don't shoot the messenger!
The motif wave appears to have completed wave 4 bull flag at the $1.6 swing low and wave 5 is underway (which can overextend). Elliot wave count would suggest we are near a major top after one more push up to new highs. More realistic price targets for a deep retracement would be $1.6 again which the ascending weekly 200EMA would catch up to for confluence.
Interested to hear from the other Elliot wave specialists on this count!
Analysis is invalidated below $1.6
New long signals are building in the DEMA PBR and Price Action strategies so keep an eye out on the Trade Signals Substack as we have made very good profits lately in these markets!
Safe trading

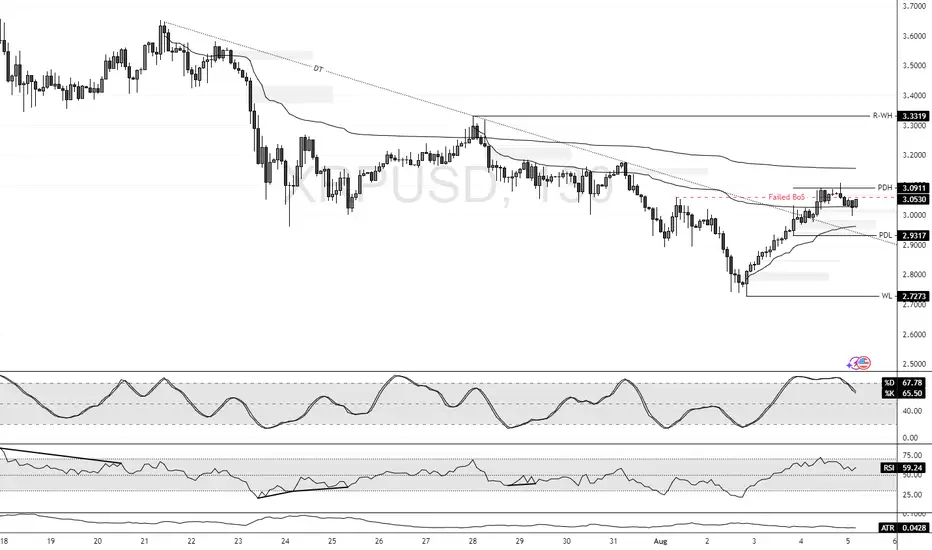
XRP's Failed Structure Break Signals Further ConsolidationFenzoFx—XRP/USD currently trades around $3.045 in a low-momentum market. Stochastic exited the overbought zone and is declining, signaling strengthening bearish momentum. The failed structure break in the New Session suggests a liquidity sweep with weak bullish interest.
Immediate resistance stands at $3.091. Technically, price is expected to decline toward the previous day's low at $2.931, a key liquidity zone. Please note that the bearish outlook is invalidated if price exceeds $3.091.
XRP VS AI ?Hi,
This is fun, come on XRP $4.95
Average Speed (Points/Day) 0.053
Retracement Amount (Points) 0.80
Retracement % 51.28%
Probability of Retracement % 5-10%
Projected Next Move Size (Points) 2.09
Next Projected High Price 4.95
Estimated Duration to Next Target 39.4 days
Projected End Date 2025-09-10
All the best
Not a guru

Xrp - The final bullish breakout!💰Xrp ( CRYPTO:XRPUSD ) will create new all time highs:
🔎Analysis summary:
After a consolidation of an incredible seven years, Xrp is finally about to create new all time highs. With this monthly candle of +40%, bulls are totally taking over control, which means that an altcoin season is likely to happen. And the major winner will simply be our lovely coin of Xrp.
📝Levels to watch:
$3.0
🙏🏻#LONGTERMVISION
SwingTraderPhil
