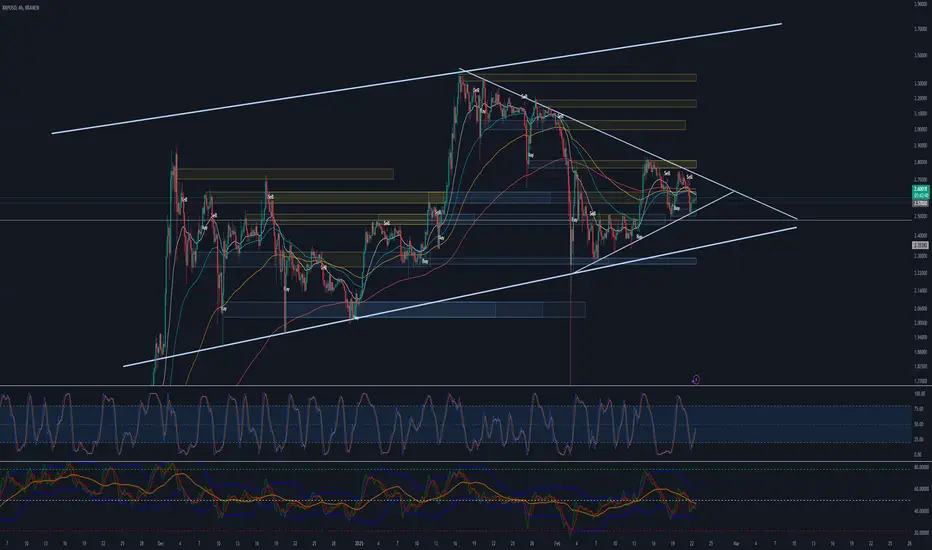
XRP price at a crucial decision point – massive breakout coming?XRP is currently trading at a critical support level, sitting within a 4-hour Fair Value Gap (FVG) around the $2.50 mark. This zone has proven to be a strong demand area, with price reacting and bouncing from it multiple times. However, XRP is now approaching a major trendline resistance, meaning a huge move is coming whether bullish or bearish depends on what happens next!
🔥 The Key Levels You Need to Watch Right Now
🟢 Bullish Scenario – A Breakout Could Send XRP Soaring!
The black descending trendline has been a strong resistance for XRP, capping price movement to the upside.
If price breaks above this trendline and successfully retests it as support, this would confirm a bullish breakout, likely leading to a surge in price.
A successful breakout could see XRP rally towards $2.70, $2.80, and possibly even higher, as there is less resistance above these levels.
🔴 Bearish Scenario – FVG Breakdown Could Spell Trouble!
The 4-hour Fair Value Gap (FVG) around $2.50 is a major support level, and price has already shown significant reactions here.
However, if XRP fails to break above the trendline and instead falls below the FVG zone, this could lead to further downside pressure.
A clean break below $2.50 could send XRP tumbling toward lower support levels, potentially $2.40 or even lower.
🚀 What’s Next for XRP? A Big Move is Coming!
With price consolidating between these key levels, a breakout is inevitable. The bullish momentum will be confirmed if price breaks and retests the descending trendline as support. However, if XRP loses the FVG zone, then we could be looking at a shift in trend toward bearish continuation.
Final Thoughts – Get Ready for Volatility!
Right now, XRP is at a make-or-break moment. The next move will likely set the tone for the coming days. Keep an eye on how price interacts with these levels—whichever side breaks first will determine XRP’s next big move!
__________________________________________
Thanks for your support!
If you found this idea helpful or learned something new, drop a like 👍 and leave a comment—I’d love to hear your thoughts! 🚀
Make sure to follow me for more price action insights, free indicators, and trading strategies. Let’s grow and trade smarter together! 📈✨
XRPUSD trade ideas

XRP RethinkEnd of a cycle, price is creating a HS pattern and with lawsuits on the way we might see a dump....

Now I'm going to show you how xrp gets thereNow I'm going to show you how xrp gets there.
I had shown you the other screen intentionally so you see the price that's going to fall down to around 65.74% or something like that a drop of 65 point 74% and most people won't even see it coming.
The WizardOfRealms13

Get it RIGHT - XRPLovely Design, pleasing to the eye... showing
MY INTERPRETATION of the Chart
as it's about to trap many people.
"MOST WILL BE BANKING FOR AN UP MOVE... it's natural!!! " a 50% Return is truly expected: $3.40÷(2) = $1.70
MOST WILL BUY IN THAT AREA...
FALL ASLEEP and be RUG-PULLED.
THERES A HUGE HEAD AND SHOULDERS PATTERN ON THE THREE MONTH CHART!!!
Yeah, how many people look at a 3 month chart? I do!
Do the OPPOSITE of what others are doing TAKES COURAGE and CONVICTION.
Buying in at: $1.18
Selling at: $2.09
Buying again at 0.8466
FOR MASSIVE GAINS!!!
The WizardOfRealms13

XRP - Food For ThougtThe total supply of XRP tokens is capped at 100 billion, ensuring that no more than 100 billion XRP tokens will ever be created. As of now, approximately 52% of the total supply is in circulation, with the remaining tokens held in escrow accounts by Ripple Labs.
Currently priced at $2.54 per token, transferring $1 billion via the XRP Ledger (XRPL) would require 393,700,787.4 XRP. However, if XRP were valued at $100,000 per token, only 10,000 tokens would be needed for the same transaction.
You might be thinking, "That would mean the XRP ecosystem, if fully distributed, would be worth $100 trillion... IMPOSSIBLE!" But let's delve into some numbers. Every day, approximately $5.7-6 trillion is transacted in the foreign exchange (FOREX) market. Annually, this equates to $2.1 quadrillion. If just 5% of that volume were moved across the XRPL, it would amount to $105 trillion. And this doesn't even account for the tokenization of stocks or real estate, which also see trillions in volume.
The Society for Worldwide Interbank Financial Telecommunication (SWIFT) system processes an average of nearly 50 million messages per day. While the exact monetary value of these transactions isn't publicly disclosed, it's estimated to be in the trillions of dollars daily. It's important to note that SWIFT and FOREX serve different functions in the financial world. So, in addition to FOREX moving $2.1 quadrillion annually and SWIFT handling another quadrillion, that's a massive volume of transactions. We now know that the XRPL ledger has recently been connected to SWIFT.
So, is a $100,000 XRP a pipe dream? Far from it. Bitcoin has hovered around $100,000 based on user sentiment. XRP represents an infrastructure of value.

XRP/USD – 30-Min Short Trade Setup!📌
🔹 Asset: XRP/USD
🔹 Timeframe: 30-Min Chart
🔹 Setup Type: Descending Triangle Breakdown Short Trade
📌 Trade Plan (Short Position)
✅ Entry Zone: Below $2.53464 (Breakdown Confirmation)
✅ Stop-Loss (SL): Above $2.54831 (Break of Resistance & Trendline)
🎯 Take Profit Targets
📌 TP1: $2.50994 (First Support Level)
📌 TP2: $2.46033 (Extended Bearish Target)
📊 Risk-Reward Ratio Calculation
📉 Risk (SL Distance): $2.54831 - $2.53464 = $0.01367 per XRP
📉 Reward to TP1: $2.53464 - $2.50994 = $0.0247 (1.80 R/R)
📉 Reward to TP2: $2.53464 - $2.46033 = $0.07431 (5.44 R/R)
🔍 Technical Analysis & Strategy
📌 Descending Triangle Breakdown Setup: XRP has been forming lower highs, signaling increased selling pressure.
📌 Support & Trendline Break: The price is testing $2.53464, and failure to hold this level would confirm a breakdown.
📌 Breakdown Confirmation: A strong bearish candle closing below $2.53464 with high volume would validate further downside.
📌 Momentum Shift Expected: If price stays below $2.53464, it could drop toward $2.50994 (TP1) and $2.46033 (TP2).
📊 Key Support & Resistance Levels
🔴 $2.54831 – Strong Resistance / Stop-Loss Level
🟡 $2.53464 – Entry / Breakdown Level
🟢 $2.50994 – First Support / TP1
🟢 $2.46033 – Final Target / TP2
🚀 Trade Execution & Risk Management
📊 Volume Confirmation: Ensure strong selling volume below $2.53464 before entering.
📉 Trailing Stop Strategy: Move SL to entry ($2.53464) after TP1 ($2.50994) is hit.
💰 Partial Profit Booking Strategy:
✔ Take 50% profits at $2.50994, let the rest run to $2.46033.
✔ Adjust Stop-Loss to Break-even ($2.53464) after TP1 is reached.
⚠️ Fake Breakdown Risk
❌ If price closes back above $2.53464, it could indicate a fake breakdown—exit early.
❌ Wait for a strong candle close below $2.53464 for confirmation before entering aggressively.
🚀 Final Thoughts
✔ Bearish Setup – Breaking below $2.53464 could lead to lower targets.
✔ Momentum Shift Possible – Watch for volume confirmation.
✔ Favorable Risk-Reward Ratio – 1:1.80 to TP1, 1:5.44 to TP2.
💡 Stick to the plan, manage risk, and trade smart! 🚀🏆
🔗 #CryptoTrading #XRP #BreakdownTrade #TechnicalAnalysis #MarketTrends #ProfittoPath #DayTrading #MomentumTrading #SwingTrading #TradingView #ShortTrade #TradeSmart #RiskManagement #CryptoBreakdown #Investing #CryptoAlerts #ChartAnalysis 🚀📉
Would you like any refinements or alternative trade ideas based on this chart? 📊🔥
You said:
SL os 2.58
ChatGPT said:
📌 XRP/USD – 30-Min Short Trade Setup (Updated with SL: $2.58)
🔹 Asset: XRP/USD
🔹 Timeframe: 30-Min Chart
🔹 Setup Type: Descending Triangle Breakdown Short Trade
📌 Trade Plan (Short Position)
✅ Entry Zone: Below $2.53464 (Breakdown Confirmation)
✅ Stop-Loss (SL): Above $2.58 (Break of Resistance & Trendline)
🎯 Take Profit Targets
📌 TP1: $2.50994 (First Support Level)
📌 TP2: $2.46033 (Extended Bearish Target)
📊 Risk-Reward Ratio Calculation
📉 Risk (SL Distance): $2.58 - $2.53464 = $0.04536 per XRP
📉 Reward to TP1: $2.53464 - $2.50994 = $0.0247 (0.54 R/R)
📉 Reward to TP2: $2.53464 - $2.46033 = $0.07431 (1.64 R/R)
🔍 Technical Analysis & Strategy
📌 Descending Triangle Breakdown Setup: XRP has been forming lower highs, signaling increased selling pressure.
📌 Support & Trendline Break: The price is testing $2.53464, and failure to hold this level would confirm a breakdown.
📌 Breakdown Confirmation: A strong bearish candle closing below $2.53464 with high volume would validate further downside.
📌 Momentum Shift Expected: If price stays below $2.53464, it could drop toward $2.50994 (TP1) and $2.46033 (TP2).
📊 Key Support & Resistance Levels
🔴 $2.58 – Stop-Loss Level
🟡 $2.53464 – Entry / Breakdown Level
🟢 $2.50994 – First Support / TP1
🟢 $2.46033 – Final Target / TP2
🚀 Trade Execution & Risk Management
📊 Volume Confirmation: Ensure strong selling volume below $2.53464 before entering.
📉 Trailing Stop Strategy: Move SL to entry ($2.53464) after TP1 ($2.50994) is hit.
💰 Partial Profit Booking Strategy:
✔ Take 50% profits at $2.50994, let the rest run to $2.46033.
✔ Adjust Stop-Loss to Break-even ($2.53464) after TP1 is reached.
⚠️ Fake Breakdown Risk
❌ If price closes back above $2.53464, it could indicate a fake breakdown—exit early.
❌ Wait for a strong candle close below $2.53464 for confirmation before entering aggressively.
🚀 Final Thoughts
✔ Bearish Setup – Breaking below $2.53464 could lead to lower targets.
✔ Momentum Shift Possible – Watch for volume confirmation.
✔ Favorable Risk-Reward Ratio – 1:0.54 to TP1, 1:1.64 to TP2.
💡 Stick to the plan, manage risk, and trade smart! 🚀🏆
🔗 #CryptoTrading #XRP #BreakdownTrade #TechnicalAnalysis #MarketTrends #ProfittoPath #DayTrading #MomentumTrading #SwingTrading #TradingView #ShortTrade #TradeSmart #RiskManagement #CryptoBreakdown #Investing #CryptoAlerts #ChartAnalysis 🚀📉

XRPUSD to watchThe price is in a symmetrical triangle, if the price goes below and maintains, it could reach support zones located lower.

Descending TriangleAlthough this is the most bullish we've seen XRP, it's notorious for parabolic pump and dumps.
It's been hitting it's head on this red trend line for over a month.
With a recent break above $2.52, it's now using that price point as support. But now forming a descending triangle.
I would wait for either the white support line or red resistance line to break before making any trades.
MACD on 1D is going from bullish to neutral/bearish.
-JumpStartCrypto


XRP Update | $2A deeper look on price action with the 4 Market Cycles, price is at the Contraction Phase and is looking to head back to Accumulation.
Also looks like we got a falling wedge pattern to add more confluence to a bearish direction.

XRPDue to the recent price action of xrp I believe we may see a breakout much sooner. Breakout could occur as fast as next week.

XRP Rocket Ready for Takeoff – 2-3 Digits in Sight 2025!🚀🔥 This Isn’t Just Another Move – This Is Liftoff! 🔥🚀
The pump window is set between February 14 and March 14, 2025, with key focus dates around February 14 and February 28. These align with algorithmic reversal points, signaling that volatility and a parabolic move are imminent.
💥 ATH will be completely obliterated – nothing is holding price back
💰 Smart money positioning confirmed – liquidity grabs fueling the next leg
📈 2-3 digit XRP in 2025 is Extremely likely
🔥 Massive momentum incoming – Expect a breakout that shatters all expectations. ATH will be left in the dust.
Good luck & Buckle up… Next stop: PRICE DISCOVERY!
-NeverWishing

Let us just admire how beautiful the XRP chart isWe are looking great guys! I've been buying since 45 cents and have take profit levels set on the way up. $10-$17 minimum this year is my prediction. People are waiting for a large dip that may never happen. Always set a stop loss and keep your long-term vision.
XRP Golden Cross"XRP is exhibiting strong bullish momentum, pushing above the Point of Control (POC) and breaking the Value Area High (VAH) twice. The third attempt appears poised to hold above VAH, potentially establishing it as a new support level. Price has found consistent support at the monthly VWAP (green) on two occasions, reinforcing buying interest. Additionally, XRP has broken above the 50-period moving average (orange) twice, further signaling robust buying pressure. Despite a recent death cross (50 MA crossing below the 200 MA), the current uptrend suggests the 50 MA may soon reclaim its position above the 200 MA, hinting at a golden cross and a powerful upside swing."

XRP bird viewHello Birdies,
XRP as you know wash out all its prior losses and investors are happy.
Let review what we are seeing right now...
- The bounce comes from the same log line which gives 2017 bull run
- Right now price is at the line which gives 2020 bull run
- I copied bar pattern from 2020 to mirror the move in 2025
- The price point I get is around $15
- We have a resistance ahead that can push the price down but you guiding line use your entry to model to enter in any direction.
Legen:
- The red circles and lines are presenting Resistance.
- The green circles and lines are presenting Support.
- The yellow one is showing 2020 move.
See you at the moon...!!

XRP area of interest - If it fails I'd love to buy below !⭐️ XRPUSD hasn't been up to much recently so nothing really to share on it. ⭐️
🟢SeekingPips🟢 remains strictly BULLISH and has been buying up the dips.
ℹ️ I would really like to see a big FU flush before the next move up BUT WHAT I WANT is irrelevant. As traders we have to do what the maket is doing and stick to OUR PLAN.
✅️ Just for the records tho sub $2 I fill my pockets again.

These are my next three targets for xrpThis is on the weekly chart.
A Drop to $1.21 BUY TARGET.
If it falls to $1.13 Don't chase it... add more!!!
A SELL TARGET no higher than $2.09
THEN A BUY TARGET AT 0.8646
AGAIN, don't chase the bottom... add more...
THEN, THIS WILL HISTORICALLY FLY to about $4.45
The WizardOfRealms13

XRP Bullish PredictionWith stability in the current area, price could return for one last time to areas near $2.15 before bullish continuation.

XRP Market outlook BIAS Here is my current thoughts on COINBASE:XRPUSD , What do you guys think will happen? Share your thoughts below, do you hold XRP?
Forex, Crypto and Futures Trading Risk Disclosure:
The National Futures Association (NFA) and Commodity Futures Trading Commission (CFTC), the regulatory agencies for the forex and futures markets in the United States, require that customers be informed about potential risks in trading these markets. If you do not fully understand the risks, please seek advice from an independent financial advisor before engaging in trading.
Trading forex and futures on margin carries a high level of risk and may not be suitable for all investors. The high degree of leverage can work against you as well as for you. Before deciding to trade, you should carefully consider your investment objectives, level of experience, and risk appetite.
There is a possibility of losing some or all of your initial investment, and therefore, you should not invest money that you cannot afford to lose. Be aware of the risks associated with leveraged trading and seek professional advice if necessary.
BDRipTrades Market Opinions (also applies to BDelCiel and Aligned & Wealthy LLC):
Any opinions, news, research, analysis, prices, or other information contained in my content (including live streams, videos, and posts) are provided as general market commentary only and do not constitute investment advice. BDRipTrades, BDelCiel, and Aligned & Wealthy LLC will not accept liability for any loss or damage, including but not limited to, any loss of profit, which may arise directly or indirectly from the use of or reliance on such information.
Accuracy of Information: The content I provide is subject to change at any time without notice and is intended solely for educational and informational purposes. While I strive for accuracy, I do not guarantee the completeness or reliability of any information. I am not responsible for any losses incurred due to reliance on any information shared through my platforms.
Government-Required Risk Disclaimer and Disclosure Statement:
CFTC RULE 4.41 - HYPOTHETICAL OR SIMULATED PERFORMANCE RESULTS HAVE CERTAIN LIMITATIONS. UNLIKE AN ACTUAL PERFORMANCE RECORD, SIMULATED RESULTS DO NOT REPRESENT ACTUAL TRADING. ALSO, SINCE THE TRADES HAVE NOT BEEN EXECUTED, THE RESULTS MAY HAVE UNDER-OR-OVER COMPENSATED FOR THE IMPACT, IF ANY, OF CERTAIN MARKET FACTORS, SUCH AS LACK OF LIQUIDITY. SIMULATED TRADING PROGRAMS IN GENERAL ARE ALSO SUBJECT TO THE FACT THAT THEY ARE DESIGNED WITH THE BENEFIT OF HINDSIGHT. NO REPRESENTATION IS BEING MADE THAT ANY ACCOUNT WILL OR IS LIKELY TO ACHIEVE PROFIT OR LOSSES SIMILAR TO THOSE SHOWN.
Performance results discussed in my content are hypothetical and subject to limitations. There are frequently sharp differences between hypothetical performance results and the actual results subsequently achieved by any particular trading strategy. One of the limitations of hypothetical trading results is that they do not account for real-world financial risk.
Furthermore, past performance of any trading system or strategy does not guarantee future results.
General Trading Disclaimer:
Trading in futures, forex, and other leveraged products involves substantial risk and is not appropriate for all investors.
Do not trade with money you cannot afford to lose.
I do not provide buy/sell signals, financial advice, or investment recommendations.
Any decisions you make based on my content are solely your responsibility.
By engaging with my content, including live streams, videos, educational materials, and any communication through my platforms, you acknowledge and accept that all trading decisions you make are at your own risk. BDRipTrades, BDelCiel, and Aligned & Wealthy LLC cannot and will not be held responsible for any trading losses you may incur.

XRP Ripple - Going Higher Now? Swing Divergence with BTCThis is a top down idea from the HTF
M > W > D1 > H4 charts
All the clues of the price action are indicating higher prices on crypto - explanation in video.
One thing I didn't mention is that we also have a weak DXY (Dollar) so that adds to the idea of strength in XXXUSD pairs.
Reasons for choosing XRP over BTC is that XRP created a higher low, indicating more strength than BTC.
Entry on LTF is dependent on a pullback to get a cheaper price.
Entry on HTF is more flexible.
Comment below if you have any questions. I read everything.
Thanks

XRP - GET READY TO DIVE / BIG OPPORTUNITY TO BUY AND HOLD LOWERXRP going for a big correction! Higher timeframes helping you spot the true range of prices!
Spot prices to buy on fibonacci:
100% (Risk Zone) - 0.60 - 0.95 cents (Neckline)
78.60% (Entry Zone) - 1.0284
66.66% - (reversal based on fibonacci timezones)1.3887
61.80% (Golden Zone) - 1.5353

XRP Weekly Summary: February 15–21, 2025Welcome back to my weekly XRP roundup! As of February 21, 2025, the XRP market has been buzzing with activity, reflecting both its resilience and the broader crypto landscape’s volatility. Here’s what’s been happening with Ripple’s flagship cryptocurrency this week.
Price Action: A Rollercoaster Ride
XRP kicked off the week with a notable surge, climbing over 20% to hit $2.76 by midweek. This rally was a breath of fresh air for holders, fueled by whispers of regulatory clarity and renewed investor confidence. However, as Bitcoin and other major cryptocurrencies faced downward pressure, XRP cooled off slightly, trading around $2.50–$2.60 by Friday morning. Posts on X highlighted this pullback, noting resistance near all-time high volume-weighted average price (VWAP) levels, suggesting the market might be testing a critical ceiling. Despite the dip, XRP’s weekly gains remain impressive, hovering around 15–17% depending on the hour—a solid performance amid a shaky broader market. Or, if 15-17% doesn't impress you much in one week, you always have the alternative to put your money in a CD at your local bank for 4.7% per year.
Legal Winds Blow in Ripple’s Favor
The big story this week? Legal developments surrounding Ripple’s long-standing battle with the SEC. Sentiment on X and crypto news circles suggests growing optimism that the tides are turning. Speculation is rife that the SEC’s case could weaken further, especially with chatter about the agency acknowledging Grayscale’s XRP ETF filing. While no official resolution has dropped as of Friday morning, the narrative of “SEC overreach” is gaining traction, boosting XRP’s appeal as a “sleeping giant” ready to awaken. If these legal clouds clear, analysts see a path to $3 or higher in the near term—exciting times ahead!
ETF Hype Heats Up
Speaking of ETFs, the XRP ecosystem is abuzz with ETF-related developments. Multiple firms have been pushing XRP exchange-traded fund applications, and this week, the buzz intensified. The idea of a BlackRock-backed XRP ETF even popped up in some enthusiastic X posts—though it’s still speculative at this stage. The potential for an approved ETF continues to drive bullish sentiment, with analysts suggesting it could unlock a “liquidity cascade” and propel XRP past its previous all-time highs. For now, it’s a waiting game, but the anticipation is palpable.
Another Financial Institution Connects to the XRP Ledger
On February 19, 2025, Braza Group, an international payment firm with over 15 years in the banking sector, announced the launch of its BBRL stablecoin on the XRP Ledger. Braza Group, while not a traditional bank itself, is a BACEN (Central Bank of Brazil) interbank player, meaning it operates within Brazil’s regulated financial ecosystem and facilitates interbank transactions. The BBRL stablecoin, pegged to the Brazilian Real, aims to provide a secure and efficient digital transaction option for individuals and businesses, leveraging XRPL’s capabilities.
Making Closer Ties Where Its Important
Brad Garlinghouse, the CEO of Ripple has been active in the public sphere recently, but the most notable events occurred earlier in February. On February 14, 2025, he shared on X about engaging with U.S. policymakers in Washington, D.C., including meetings with figures like Senator Tim Scott (Chairman of the Senate Banking Committee) and Representative Ritchie Torres. Photos from these meetings were posted, showing him alongside lawmakers such as Representatives William Timmons, Bill Huizenga, Bryan Steil, Zach Nunn, and French Hill. These discussions focused on advancing crypto regulatory clarity, but they fall just outside this week’s timeframe (February 15–21).
Market Sentiment and On-Chain Moves
On-chain data paints a picture of accumulation, with significant XRP outflows from exchanges reported earlier in the week—think tens of millions of dollars’ worth. This suggests big players might be stacking their bags, betting on a breakout. Meanwhile, X users are hyping up technical patterns like the “cup and handle,” hinting at a possible 18% jump to $3.30 if XRP clears key resistance around $2.82. The mood? Bullish, but cautious—everyone’s watching Bitcoin’s next move and the Fed’s hawkish stance for cues.
What’s Next?
As we wrap up this week, XRP stands at a crossroads. Will it smash through resistance and reclaim its glory above $3, or will market headwinds force a deeper correction? With legal clarity on the horizon, ETF speculation simmering, and strong community support, XRP is poised for a potentially historic moment. Stay tuned for next week’s update—we might just see fireworks!

XRP on bullish trendXRP is showing signs of a bullish trend. This may be a simplistic analysis but it shows a clear direction.
