XRP Cup & Handle Pattern on the Daily Chart.XRP is now forming the handle on a very nice cup-and-handle pattern on the daily chart, starting at the previous all-time high set on January 16th, 2025.
But this pattern isn’t all sunshine and rainbows. The price of XRP could drop down into the $2.50 range—toward the bullish fair value gaps I’ve outlined at the bottom of the handle—before making any credible gains or a major breakout to higher levels.
I do believe we’ll see much higher prices in XRP in the coming years as we continue moving into the new global digital financial system. However, for this pattern to fully play out, there will likely be some pain before the pleasure.
I’d keep a close eye on the pink area marked on the charts—spanning from August 23rd through September 8th—as a potential zone for bearish price action.
Luckily for me, my XRP bags have been filled since before the Trump election pump, so I don’t personally need to buy more—unless I see a clear buying opportunity.
Good luck, everyone!
XRPUSD trade ideas
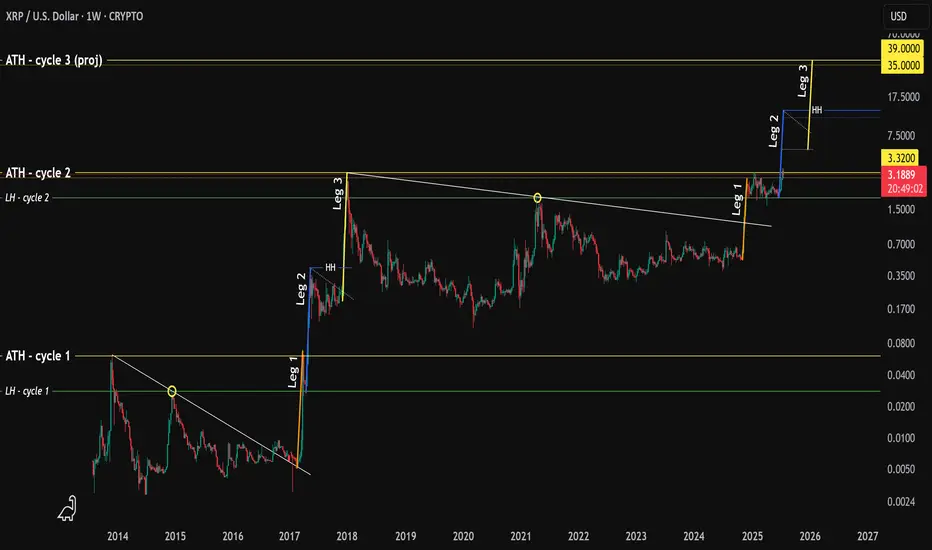
XRP - history repeating?Hello.
I'm going to walk you through what happened in the early years of XRP p.a. and how this fractal might play out today.
Here's what happened.
1. A high was printed in 2013 (ATH)
2. Followed by a lower high (LH)
3. XRP broke out of a downtrend 📈
4. In 2017 price increased 1,280% finding resistance @ ATH (we'll call this "Leg 1")
5. The LH then acted as support, followed by sideways price movement
6. Price increased 1,460% creating a higher-high (or "HH") which surpassed the ATH and this is "Leg 2"
7. Again, sideways price movement.
8. An increase of 1,560% creating a new ATH Dec 2017 - "Leg 3"
What's interesting here is that each leg takes 5 weeks to play out (that's 5 green weekly candles to put a finer point on it).
Fast forward in time - what do we see?
A high..
A lower high....
A breakout of the downtrend..
Followed by..... you guessed it... 5 green weekly candles
Hold on...
A rejection at the ATH
The LH acting as support...
With sideways movement .. 👀
The symmetry is quite profound and provides us with an idea of what will happen next.
If we consider the move in Nov 2024 as "Leg 1" then one could argue that "Leg 2" is currently in play.
Leg 1 was not as significant as the uplift we saw in 2017 (480% vs 1,280%)
However, if we assume that the variance between Leg 1 and Leg 2 rhymes then the projected uplift from the LH would be 550%.. making XRP price roughly $11-13
It follows that price will then move sideways/consolidate/capitulate for several months.
Followed by one last move to the upside which, using the variance between Leg 2 and Leg 3 put the final leg @ 585% or $35-39.
Wild guess but based on historical Bitcoin halving peaks and XRP ATH in both cycle 1 and 2 landed at the back end of Q4, it is assumed the same could happen (put simply: the end of 2025).
You're welcome.
XRP: Double zigzag correction scenario for Jun/July 2025 impulseA possible double zigzag pullback scenario correcting June & July's impulsive breakout, upon which normies & bears might say "head & shoulders" but then it climbs the wall of worry for a massive Wave 3 parabola.

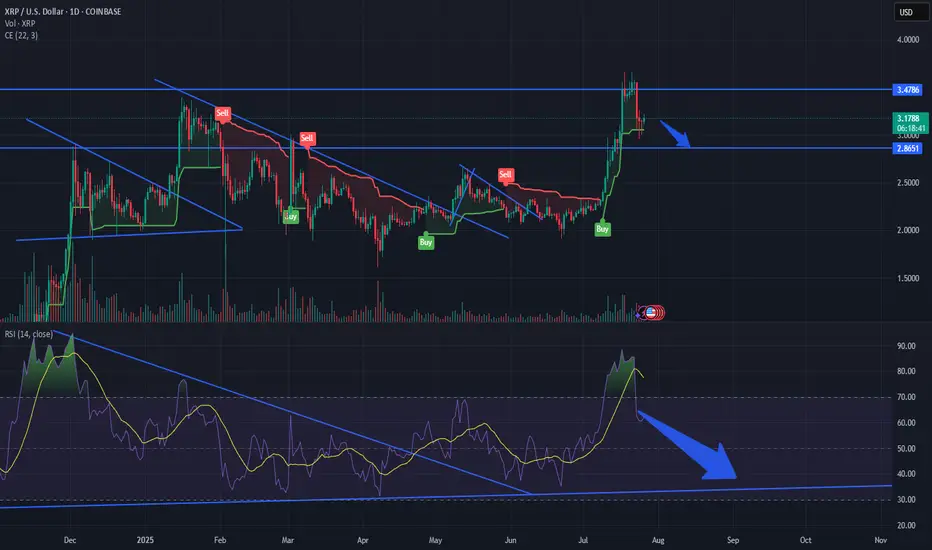
xrp correction time rsi indicates oversold RSI is oversold on the 1 day daily correction happening next stop $285 ish good luck
XRP/USD Chart Hack – Rob the Market Before the Bears Do🏴☠️💸 XRP/USD Crypto Market Heist Plan: Thief Trader Style 💰📈
"Break the Vault, Rob the Trend – One Candle at a Time!"
🌍 Hi! Hola! Ola! Bonjour! Hallo! Marhaba! 🌍
To all fellow money makers, day robbers & chart thieves... welcome to the vault!
We’re diving into the XRP/USD (Ripple vs. U.S. Dollar) with a bold Thief Trading™ Strategy, blending technical mastery and market intuition.
📊 THE PLAN: Rob the Resistance – Swipe the Highs
🔥 Based on Thief Trading-style TA & FA combo, here's the master heist setup:
Long Bias ⚔️
Target: The High Voltage Resistance Zone
Status: Overbought + Trap Level = High Risk, High Reward
Market Mood: Bullish but risky – consolidation & reversal zones ahead
Crowd Behavior: Bearish robbers strong above, but we strike below
🧠 Thief Wisdom:
“The vault's open, but not every vault is unguarded. Wait, plan, attack with strategy.”
📥 ENTRY PLAN
The Heist Begins at the Pullback...
Use Buy Limit Orders (Thief Style: DCA / Layering)
Entry Zones: Near recent swing lows or within 15–30 min pullbacks
Let the price come to your trap – precision is our weapon
🛡️ STOP LOSS STRATEGY
Guard Your Loot – Always Secure Your Exit
SL Example: 2.8500 (3H TF swing low)
Customize SL based on:
⚖️ Your lot size
🎯 Risk tolerance
🔁 Number of entry layers
Remember: We don’t chase losses – we protect capital like it's gold
🎯 TARGET
Final Take-Profit: 4.0000
But hey… Thieves escape before alarms ring!
💡 If momentum slows, don’t be greedy. Exit smart, exit rich.
📡 FUNDAMENTAL + SENTIMENTAL OVERVIEW
The bullish bias is supported by:
📰 Macro Events
📊 On-Chain Signals
📈 COT Reports
🔗 Intermarket Correlations
📢 Sentiment Analysis
👉 Stay updated with the latest data — knowledge is the thief’s ultimate tool.
⚠️ TRADING ALERT – News Can Wreck the Heist
To survive news spikes:
🚫 Avoid entries during high-impact releases
📉 Use trailing SL to protect your open profits
🛑 Adjust exposure during uncertain volatility
❤️ SUPPORT THE CREW – BOOST THE PLAN
If this plan added value, hit the 🔥BOOST🔥 button.
It helps grow the Thief Trading Team, and together we rob smarter, not harder.
💬 Drop your feedback, thoughts, or charts below – let’s build the crew!
💎 Every candle tells a story. We don’t follow the trend – we rob it.
💣 Stay alert, stay rogue, and I’ll see you at the next market heist.
💰 Until then… chart smart, trade savage. 🐱👤💵

6month log chart on xrpusd suggests crazy potential targetsThe bull pennant we are in shown here on the 6month time frame seems to have a symmetrical triangle for its flag. The breakout target for just the symmetrical triangle is in the $33 range. Factor in the pole of the flag and the potential target skyrockets to 1.2k. Definitely not financial advice and certainly no guarantee it will hit either target as it’s still up in the air if log chart targets reach their full target as reliably as linear chart patterns do. Even if it does hit these targets you can see the apex of the pennant in its current trendline trajectories doesn’t occur until 2026. The only way I see price remaining inside this triangle for that long is indeed if the SEC ripple case is extended through appeal and taken to the Supreme Court. Hopefully not but it isnt impossible. If this were to occur I would simply keep dollar cost average accumulating until it was to break out from the triangle which would give me more opportunity to take some profit at the first target but then also hold onto some of the asset in case it does indeed reach the full bullflag breakout somehow all the way up at 1.2k. Simply posting this hear so I can see how well price action chooses to follow this pattern over the next year or few. Once again *not financial advice*

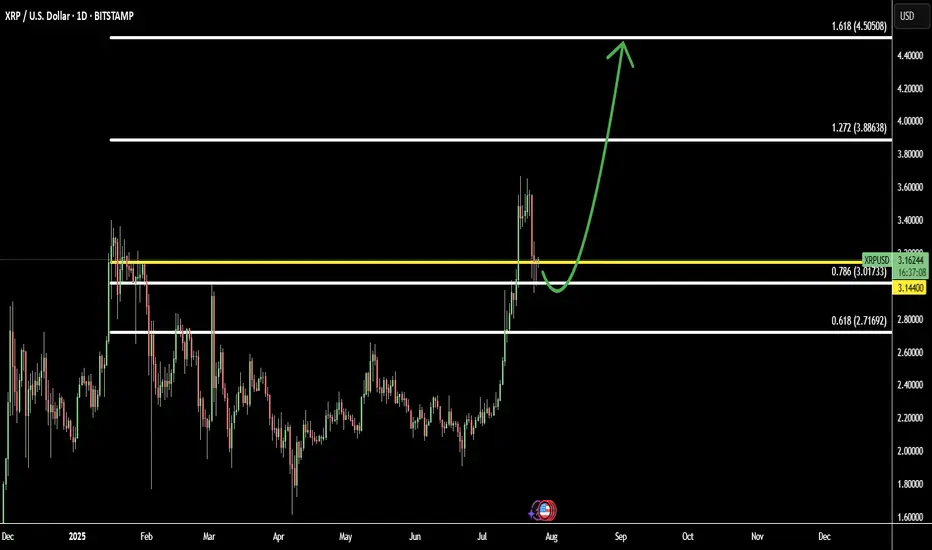
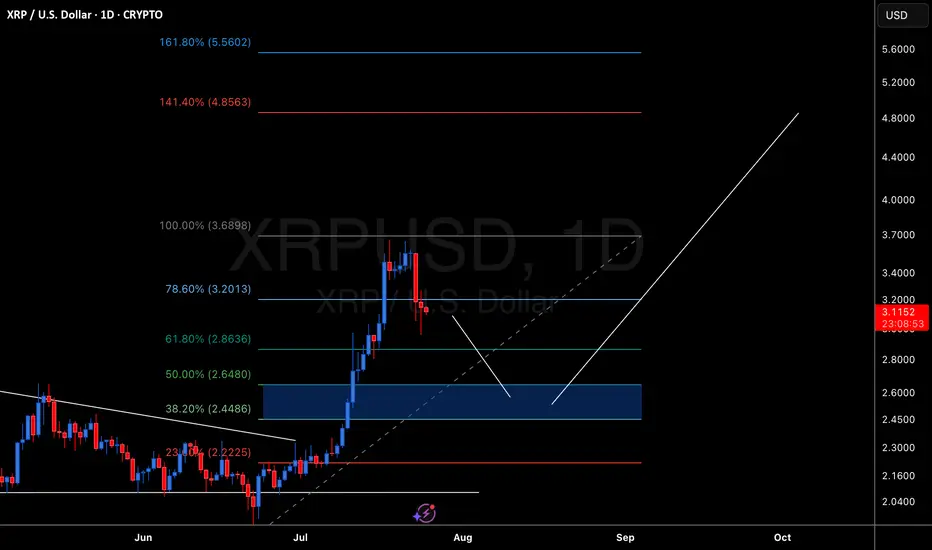
XRP Pullback Complete: Bulls Step In Toward Fibonacci TargetsAfter a healthy pullback, XRP (XRPUSD) is showing signs of renewed strength as new buyers re-enter the market. This correction phase appears to have attracted smart money, setting the stage for the next bullish leg.
The chart structure suggests XRP is now in a re-accumulation phase, with price aiming for mid-term Fibonacci targets:
Target 1: 1.272 Fib – 3.88 - continuation zone after breakout
Target 2: 1.618 Fib – 4.50 - strong extension level aligned with prior highs
If momentum holds and volume builds, XRP may resume its upward trajectory toward these targets in the coming weeks.
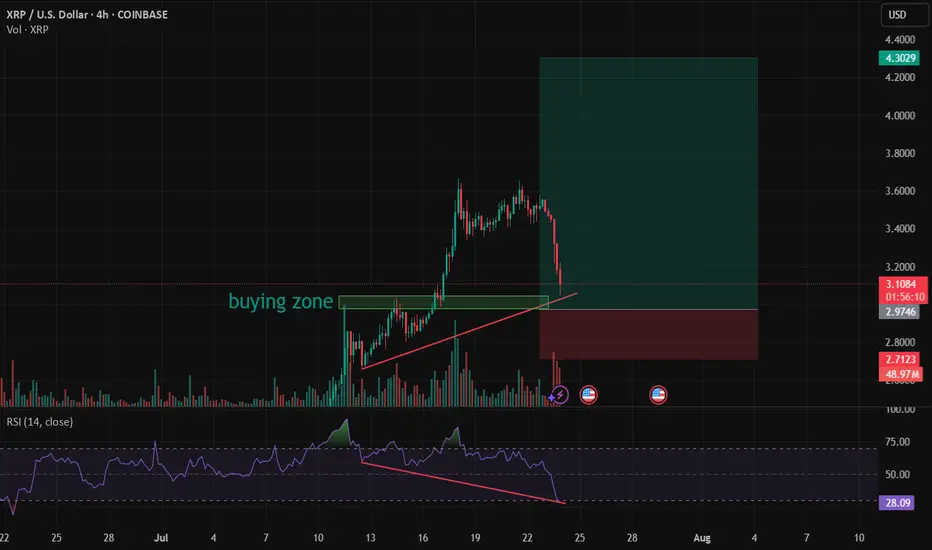
XRP to 2.80So, conjugate waveform or Elliot wave retracement is 5 steps. With 3 being the longest. 5 obviously the lowest. Once a demand or supply zone is tapped/broken into, they want the extreme of that zone. That's why I think 2.80 low.
With, 1234 break on Z out of the bearish Pennant into the demand. Forming the bottom of the, now larger C&H.
And aAaAway we go!

Relax and watch the show - target = 13 dollarDear,
In a bull market it is normal to see a 10, 20% pullback before the next impulsive wave.
It is a normal level for XRP to reject for now because we came near the ATH.
With the next test of ATH i believe we will move fast trough it.
My personal target for this bull run is 13 dollar. It can go higher but i believe the market will be overbought.
Currently the RSI levels are cooling of, the 1H and 4H oversold so i believe we will reverse soon.
Take care.
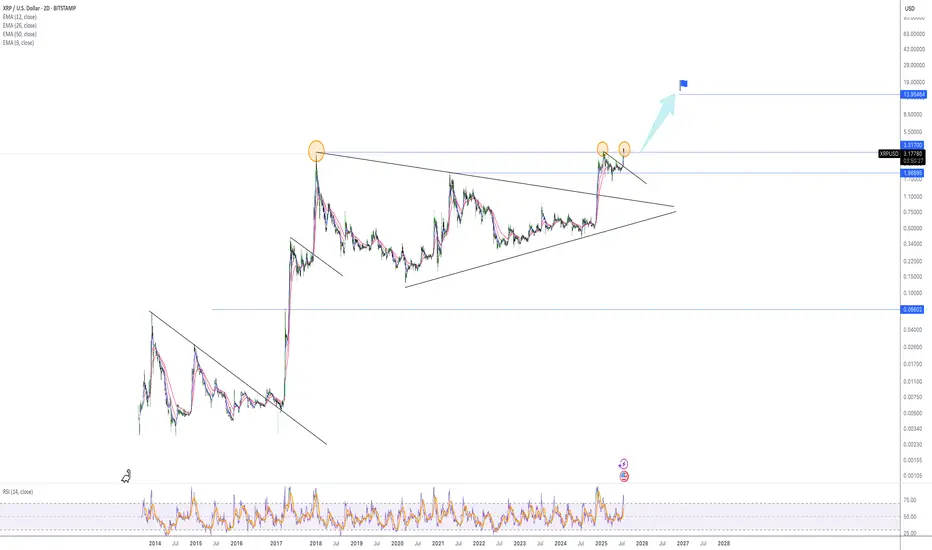
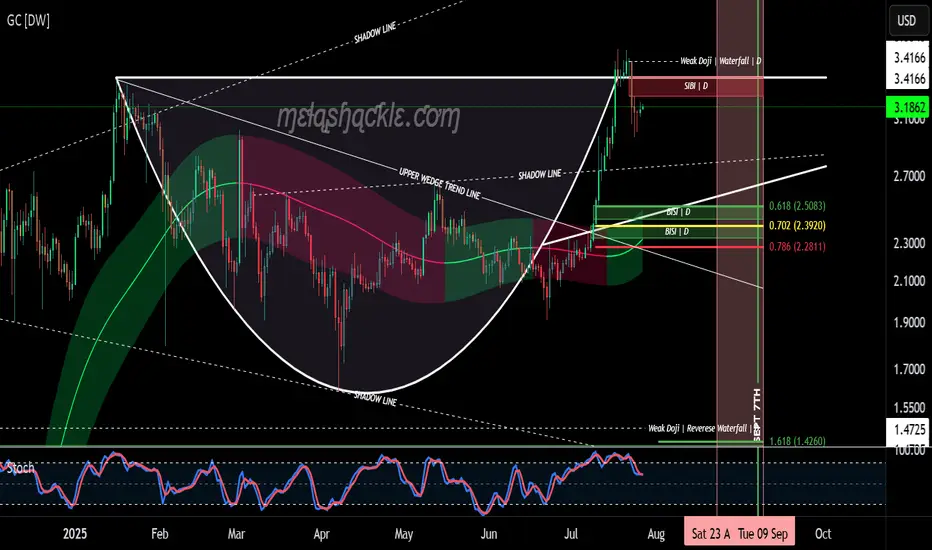
XRPUSD Massive break-out that can Top at $12.500XRP (XRPUSD) got out of its Accumulation Triangle (December 2024 - June 2025) making an aggressive break-out similar to the December 2017 one, which was after an identical Triangle pattern.
The fractals are so comparable that both mostly traded within the 1W MA50 (blue trend-line) and the Mayer Multiple (MM) 2 Stdev Above (orang trend-line).
As you can see, that MM trend-line was where the Top of the previous Cycle (April 2021) was priced and the one before was above the 3 Stdev Above (red trend-line).
Assuming that this Cycle will also go for the 'minimum' 2 Stdev Above test, it can make that contact by the end of the year on the 2.0 Fibonacci extension (Cycle Top-to-bottom) at $12.500.
-------------------------------------------------------------------------------
** Please LIKE 👍, FOLLOW ✅, SHARE 🙌 and COMMENT ✍ if you enjoy this idea! Also share your ideas and charts in the comments section below! This is best way to keep it relevant, support us, keep the content here free and allow the idea to reach as many people as possible. **
-------------------------------------------------------------------------------
💸💸💸💸💸💸
👇 👇 👇 👇 👇 👇

XRPUSD - Target reached. Reversal on the plateSo, that was a nice long trade.
Now price is stretched at the Upper Medianline Parallel (U-MLH).
As of the time of writing, I already see price pulling back into the Fork. A open and close within the Fork would indicate a potential push to the south.
Target would be the Centerline, as it is the level where natural Meanreversion is.
Observation Hat ON! §8-)

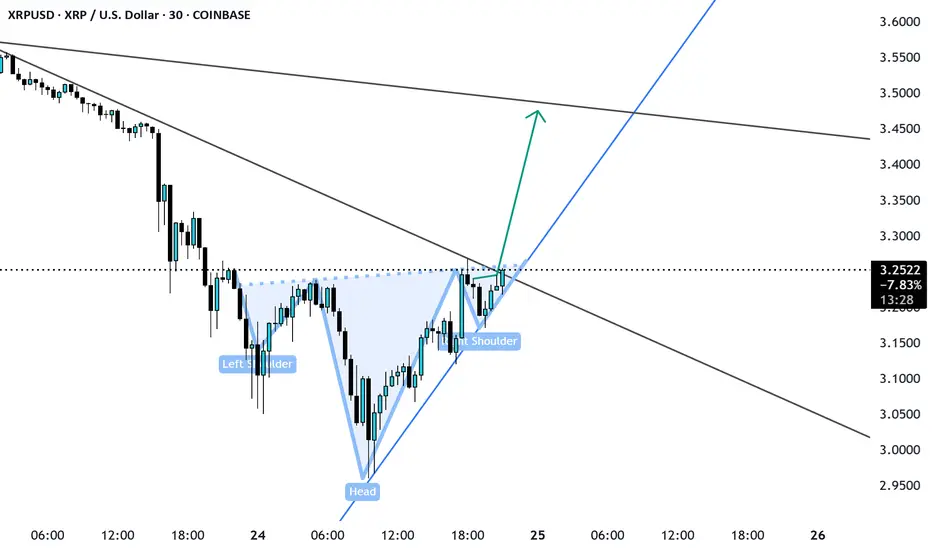
XRP SHS pattern Enter on Neckline breakout XRP pulled back from the support of 3.0 currently formed a head and shoulder pattern is likely to grow till 3.4 -3.45. let us see.
XRP Temporary Pull Back Followed Bu Move Up To $4.00XRP Created a new high. Looking for a pull back to the 50% retracement level. Followed by a move up to the 141 fib level of around $4.00
XRP: $10 Breakout? Watch These Algorithmic Windows!This XRP analysis highlights "algorithmic departure windows" (blue circles) where explosive price moves can occur.
Whenever price enters a blue circle, XRP can launch to $10 or higher instantly or within 33 days—no matter the news.
**Key Dates to Watch:
**Possible Departure: July 10, 2025 (fundamentals align)
**Other Windows: May 19 - August 11, 2025; October 22 – November 18, 2025
**Major Target Zone: $8.50–$11.50 (December 25, 2025 – January 26, 2026)
History shows that once price breaks out from these departure windows, XRP can reach its upper targets rapidly—sometimes in a single day, but almost always within 33 days or less.
News is the excuse for the moves—algorithms deliver the predetermined price.

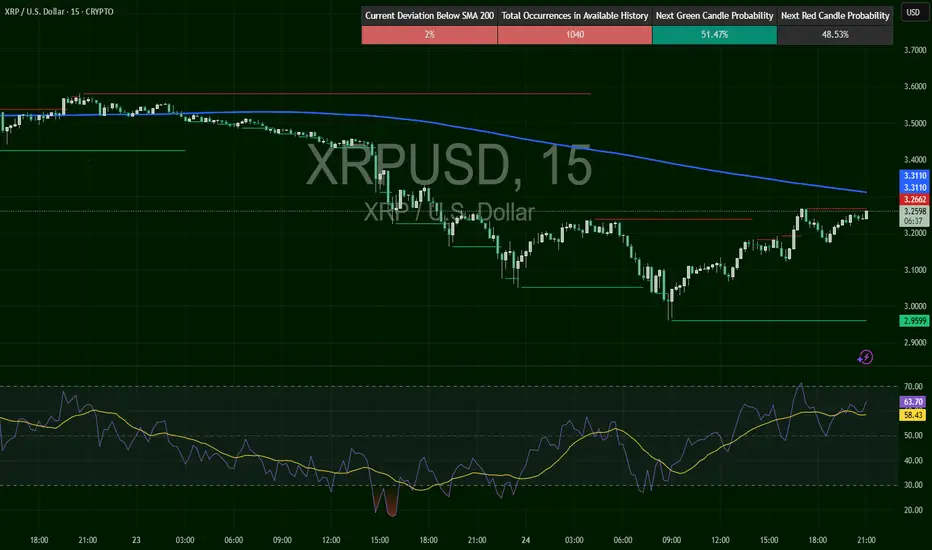
XRPUSD – Reclaim or Reject? Critical TestXRP flushed hard to $2.95, then reversed and is now pressing back into prior breakdown levels at $3.26–$3.31. 200 SMA above is resistance at $3.31. RSI at 63.14, bullish and rising. This is the make-or-break retest zone. Break it, and we could see $3.40+ fast. Rejection = trap.
XRP CRYPTOCAP:XRP price discovery will be there sooner or later
2021 I think the current accumulation process on the ath price will be the trigger for an upward movement

Retest before it goes again ?This set up is not usually on my playbook but seen the strong momentum the XRP is having, this hidden divergency is as good as it comes, with good potential to workout. I believe if it does the first target will be around 4.30.
XRP/USD – Bearish Shift After Momentum Exhaustion🧠 Summary:
XRP/USD has shown clear signs of exhaustion after sweeping the previous high. Following a breakout from a daily bull flag, price struggled to hold momentum near the key level of 3.4194, forming an ascending channel that eventually broke down. Liquidity zones below current price are now in focus.
🔍 Technical Breakdown:
✅ Daily Bull Flag → Broke out with strength
⚠️ Rejection near Previous High (3.4194) → No follow-through
🔼 Ascending Channel → Formed post-impulse, now broken
📉 Momentum Shift → Structure flipped bearish
💧 Liquidity Zones (LQZ) below price acting as magnets
📌 Key Levels:
🔹 Last High: 3.4194 (Rejection Point)
🔹 Broken LQZ: 3.2868
🔹 Current Support: 3.1689 (LQZ - being tested)
🔹 Target 1: 2.9849 (4HR Liquidity Zone)
🔹 Target 2: 2.7667 (Daily Liquidity Zone)
🧩 Confluences:
Liquidity sweep of prior high
Momentum loss near key resistance
Break of ascending structure
Retesting broken zones with room below
⚠️ Final Thoughts:
This trade is playing out just as we described in the post before this on XRP. We discussed watching how price would react to this area before making any type of "Late Entries". XRP is still a huge and vital part of the Crypto Eco System so long term i am holding my Long position. The areas on the chart are still great areas to buy in at "Dollar Cost Average". This will be one of those positions that though it may be bearish on the lower time frame you need to zoom out and always keep an eye on the weekly and daily chart before making any drastic moves.

XRP/USD H1 Educational Market Analysis – Support-Based XRP/USD H1 Educational Market Analysis – Support-Based Long Opportunity
🔍 Structure Overview:
• Support Zone: $3.21 – $3.23
This level has acted as a strong liquidity pool and base for past bullish moves. Price has tapped into it, showing signs of potential demand returning.
• Resistance Zone: $3.65 – $3.70
Acts as a key supply zone, where previous bullish attempts failed. Targeting this area after a rebound is technically sound if structure confirms.
⸻
🔄 Price Action Insights (H1):
• Price broke down through EMAs (20/50/100/200), confirming short-term bearish pressure.
• A rejection wick from support hints at possible absorption of selling pressure.
• If price forms a higher low structure above $3.25 and reclaims EMAs, a potential bullish reversal may unfold.
⸻
🧠 Educational Note:
• H1 charts are ideal for intraday strategies, and this structure provides a clear example of:
• Support-resistance dynamics
• The use of EMAs as trend confirmation tools
• Reversal vs. continuation setups
⸻
🎯 Intraday Bullish Scenario:
• If price holds above $3.21 and breaks above the $3.40 (EMA cluster), bulls may push toward the $3.55290 target.
• This level aligns with the mid-range of the resistance zone, offering scalp-to-swing potential.
⸻
🚫 Bearish Risk:
• Failure to hold $3.21 could lead to a deeper correction toward $3.10 or even $3.00.
• Confirmation of bearish continuation would be a lower high rejection from EMAs without reclaiming them.
⸻
📌 Summary:
On the H1 chart, XRP is at a critical support. Watch for a clean bounce and break above EMAs for a move toward $3.55. However, losing $3.21 could attract further downside. Use price action confirmation before entries.

XRPUSD Technical Analysis — Bearish Retracement in PlayXRPUSD Technical Analysis — Bearish Retracement in Play
Overview:
XRPUSD is currently exhibiting signs of bearish momentum after failing to break through a key resistance zone. Price action suggests a potential retracement towards the marked target level of 3.39519, supported by multiple technical indicators and price structure.
Key Technical Levels:
Immediate Resistance: 3.70 – 3.75 (strong supply zone; price rejected here multiple times).
Support Zone: 3.30 – 3.39 (prior demand zone and EMA confluence).
Target: 3.39519 (short-term bearish target as marked on chart).
Current Price: 3.50 (as of chart time).
Indicators & Price Action:
EMA Analysis:
EMA 20/50 (red/orange) are flattening out, indicating weakening short-term momentum.
EMA 100 (cyan) acts as current dynamic support.
EMA 200 (blue) is far below, suggesting room for deeper retracement if sentiment weakens.
Price Structure:
XRPUSD formed a double top near resistance, followed by lower highs.
Recent candle patterns show indecision and possible distribution.
Projected bearish leg toward 3.39519 suggests sellers are in short-term control.
Conclusion:
XRPUSD is likely to retest the 3.395 support level after rejecting the upper resistance zone. The bearish structure is supported by EMA alignment, price action, and repeated failure to break resistance. A break below 3.395 could open further downside towards 3.31. However, a strong bounce from support could invalidate this setup.
Trade Bias: Short-term bearish toward 3.395, watching for reaction at support.

Xrp's next low I've already taken all profit at the 3rd angle vioation at the top of this run. Now I will buy back in 20%-25% lower, when Xrp hits this next beasrish target between $2.75 - $3.0.
See you at the top of this next rally up.

XRP to $6?The optimistic target of $6 in 30 days is overpromised, unless a major developement comes from the White House.
Read more at: www.cointrust.com

You Are Getting Ripped Off On XRP Contd.... Once again for all the hype on xrp it still can not break the all time high.
Like I said 2 weeks ago when the price was at 3.60, I will see you at $3.00 by August 1st..
Its fading and the death nail will come 5-8 days from now.
The whole crypto market will crash. The slide starts in August.
I will be buying XRP for 55 cents in 2027.
Also Silver will outgain XRP in the next 2 years by 400 percent.
Laugh and mock all you want.
Come see me August 1st.
