XRP - ContinueRipple's price movement in the main channel and its decline or decrease to the lowest price level has been completed, and we can expect an increase in the price of this currency in the crypto market. Ripple's analysis has recorded a 200% increase so far, which you can see the results of in past analyses.
Sasha Charkhchian
XRPUSDT.3L trade ideas

XRP | Up to New HighsXRP has successfully broken out of its consolidation pattern and is now targeting significant upside levels. A breakout from the green support zone around $3.27 will confirms the strong bullish momentum.
Key Technical Levels:
- Primary target: $6.42 (2.0 Fibonacci extension)
- Extended target: $7.50+ (2.5 Fibonacci extension)
Trade Setup:
- Support zone: $3.27 (former resistance now support)
- Stop loss: Below $3.00 to protect against false breakouts
- Risk/reward: Favorable with multiple upside targets available
Technical Outlook:
The projected path suggests continued upward momentum with potential pullbacks to retest the breakout level. RSI shows room for further advancement without being severely overbought.

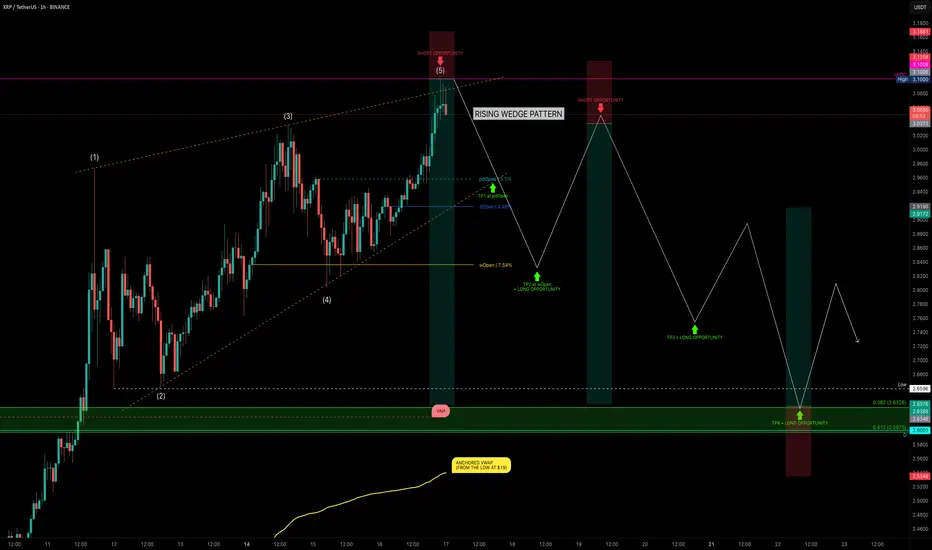
XRP Hits $3.10 — Rising Wedge or Ready to Fly?XRP has been on a strong run over the past 24 days, rallying from $1.90 → $3.10 — a +62% price increase. But after hitting key resistance, is XRP about to correct, or will it break out further? Let’s dive into the technicals.
🧩 Market Structure
Rising Wedge Pattern:
The current market structure resembles a rising wedge, with XRP likely completing wave 5.
Rejection Zone Hit:
Price tapped the nPOC at $3.10 and rejected — providing a clean short opportunity.
📉 Key Support Levels & Confluences
Taking the full 24-day bullish move:
0.382 Fib Retracement: $2.6326 — aligns with liquidity pool below the $2.6596 swing low.
226-day Trading Range VAH: ~$2.62 (red dashed line) — adds confluence.
Daily Level: $2.60 — further support.
Anchored VWAP from $1.90 Low: ~$2.54 (rising over time).
✅ Conclusion: The $2.66–$2.60 zone is a critical support area and offers a solid long opportunity.
Trade Setups
🔴 Short Setup (After Breakdown Confirmation):
Wait for a sell-off & breakdown of the wedge.
Ideal entry: retest of the lower wedge edge, ideal short entry would be between 0.618–0.786 fib retracement.
🟢 Long Setup:
Entry Zone: $2.66–$2.60
SL: below VWAP line
Target: Fib 0.618 as TP
🧠 Educational Insight: Rising Wedges Explained
A rising wedge is a bearish pattern, often signalling weakening momentum as price climbs within narrowing highs and lows.
Key points:
➡️ Volume typically declines as the wedge matures.
➡️ Breakdown below the lower wedge edge often triggers stronger sell-offs.
➡️ Retests of the broken wedge support turn into ideal short entries.
Pro tip: Combine wedge patterns with fib retracement zones and VWAP levels for higher-confidence setups.
Watch for wedge breakdown confirmation before shorting.
_________________________________
💬 If you found this helpful, drop a like and comment!
Want breakdowns of other charts? Leave your requests below.
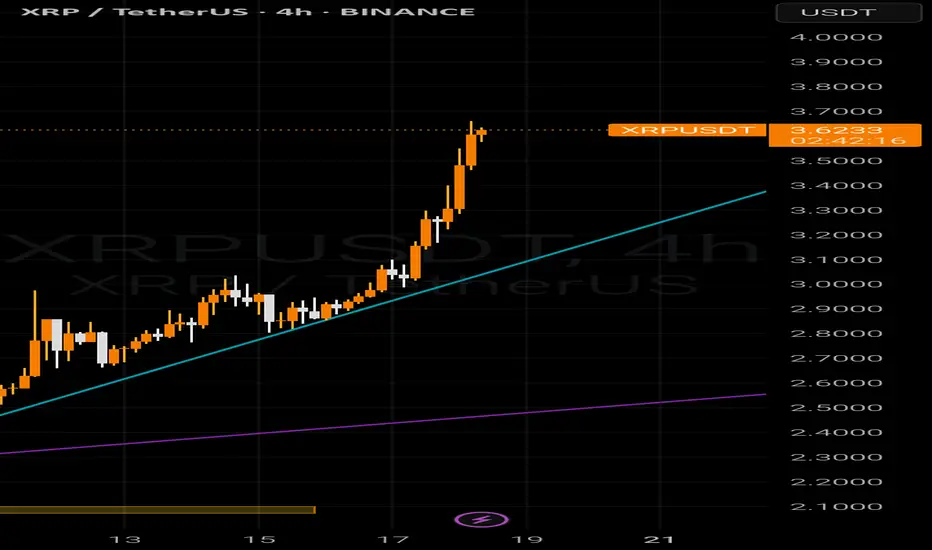
Setupsfx_ | XRPUSDT: Time For Strong Bullish Price Distribution!As previously described, the price bullish reversal did exactly that. The price has moved nicely, and this may be just the beginning of a bigger move. Long-term, we believe XRP will hit a record high, possibly even surpassing $4.
Please use accurate risk management while trading XRP.
Good luck and trade safely!

Agar kok trend linyani buzsa 3 touchpuint boladi va sellIf a trendline is tested three times and then breaks out, there's a high chance the price will drop. But if it holds, the level may become even more significant.
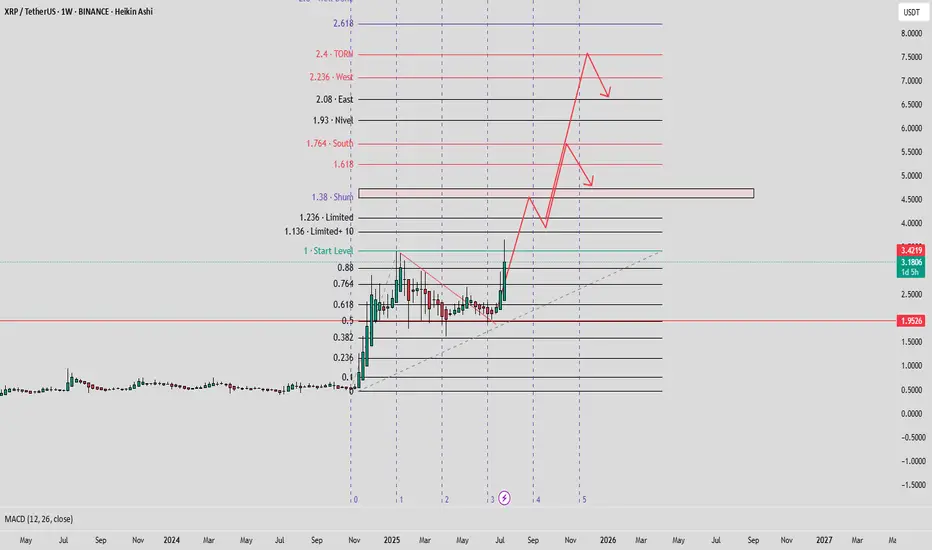
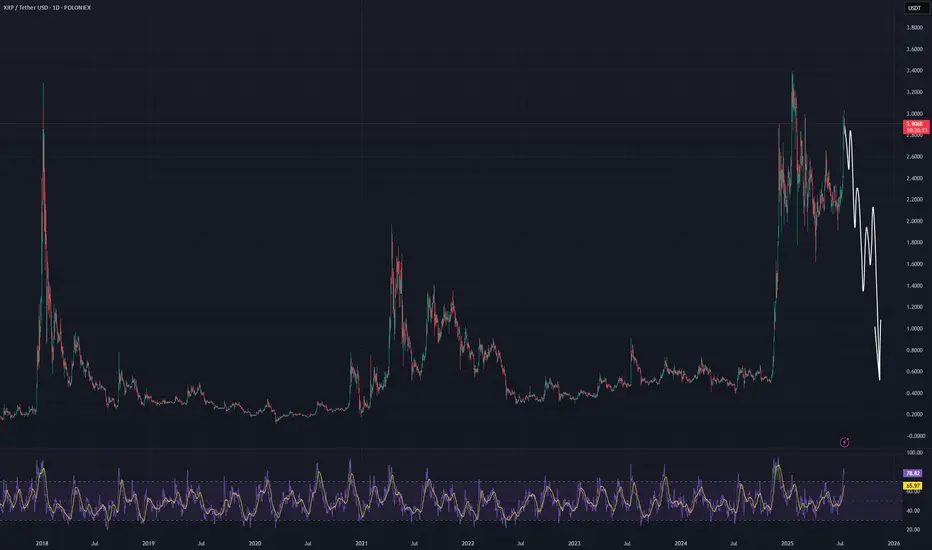
#XRP ALMAZOV PROJECTION#XRPUSD ALMAZOV PROJECTION WEEKLY
Price projection according to Almazov's theory, Bitcoin should at least touch $1.3, before pulling back or continuing to go long if its dimensionality decreases.
XRP (Ripple) Analysis – July 15, 2025XRP has built significant liquidity between the $1.6 to $3.4 range, making a clear breakout through this zone more challenging.
📊 While a short-term breakout above this range is possible,
the presence of short-term investors likely aiming to take profits above the range increases the probability of a pullback toward the lower bound.
🎯 For a more optimal and lower-risk entry, we should wait for price action near the $2 zone.
If the market shows a strong bullish reaction from that level, it could offer a solid setup for targeting higher levels.

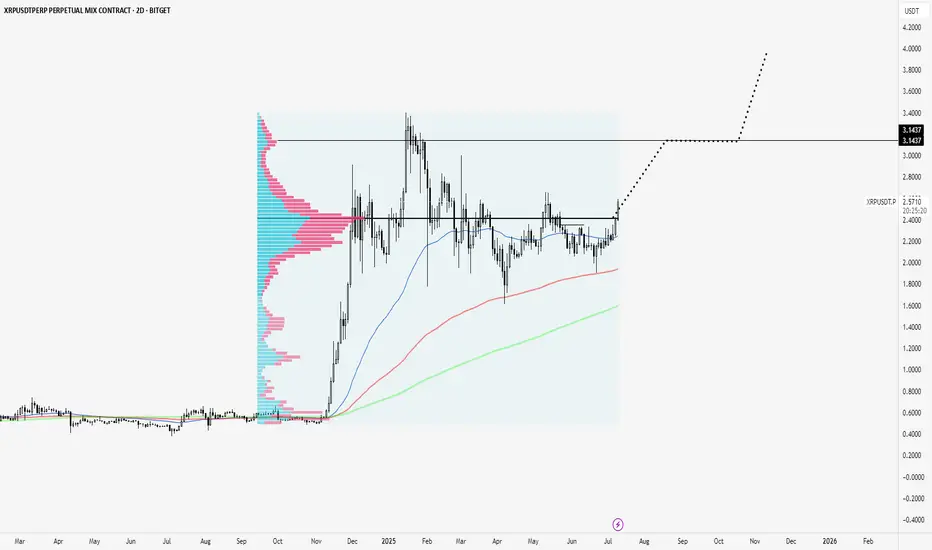
XRP clears Point of Control to test highs.XRP is breaking out of a consolidation zone and above a volume point of control that has been massive since its November rally onward.
Looks like next node is to $3.14
Super strong coin.
Ripple testimony in banking committee yesterday was bullish. Ripple partnering with BNY Melon yesterday was bullish. Ripple leading regulation standards with their XRP case is bullish. Ripple winning the status of XRP as one of a kind is bullish. Ripple getting a bank charter and fed master account is bullish.
Not much is close to XRP fundamentally.
Up to New HighsDO NOT FORGET USING A STOP LOSS
Warning:
This is just a suggestion and we do not guarantee profits. We advise you analyze the chart before opening any position.
I hope you are always profitable

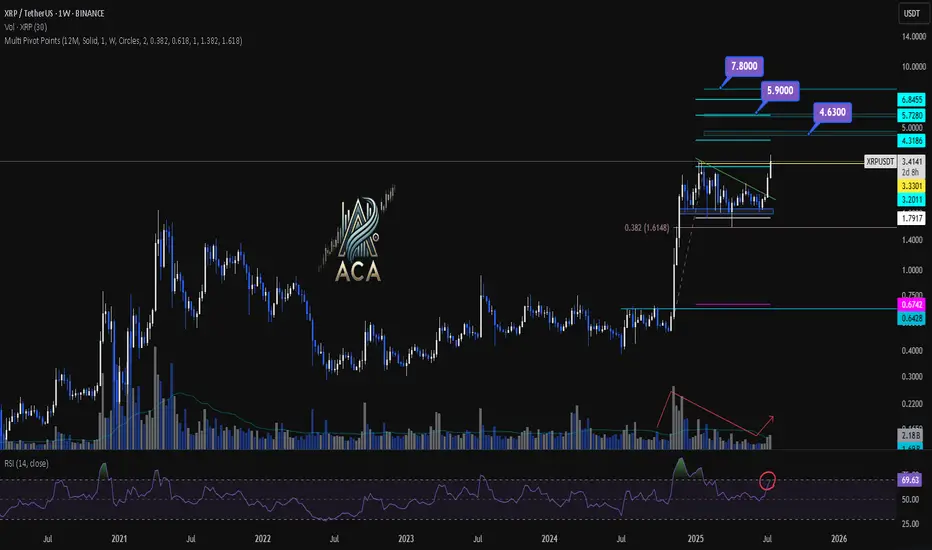
XRPUSDT Weekly Chart Analysis | Next Bullish MoveXRPUSDT Weekly Chart Analysis | Major Resistance Levels Align for Next Bullish Move
🔍 Let’s break down the XRP/USDT weekly setup, highlighting key technical signals and major upside targets for the next rally.
⏳ Weekly Overview
The weekly chart shows consolidation just below a major resistance, with price action tightening and preparing for a breakout. A recent correction found support near the 0.382 Fibonacci retracement level, which has acted as a springboard for renewed momentum. Notably, the R2 pivot point level aligns closely with this area, strengthening its importance as a decision zone for bulls.
🔺 Upside Targets & Confluences:
- First Target: $4.63 — This coincides with the R2 monthly pivot point and aligns with key Fibonacci extension targets, offering strong confluence for a reaction zone.
- Second Target: $5.90 — Our most realistic medium-term target, also backed by cluster resistance from both pivot analysis and fib projections.
- Final Target: $7.80 — This is the major Fibonacci extension level, marking the highest projected upside if momentum persists.
📊 Key Technical Highlights:
- Pivot Point R2 & Fibonacci Confluence: The R2 level reinforces a critical resistance, overlapping with the $4.63 Fibonacci target.
- Fibonacci Retracement: Price respected the 0.382 retracement during the latest correction, signaling healthy trend continuation.
- Volume Confirmation: An uptick in volume confirms that buyers are stepping in, supporting the bullish momentum.
- RSI Signal: RSI is entering the overbought zone, which typically indicates a strong surge in buying pressure and can mark the start of a momentum move.
🚨 Conclusion:
XRP is setting up for a major breakout as key technical levels align. Watch for a sustained move above $4.63 to unlock the $5.90 area, with a final potential push towards $7.80 if bulls maintain control. Volume expansion and an overheated RSI are both classic signs of an incoming momentum wave—keep your eyes on these levels for validation of the setup.
XRP AccumulationI'm looking for a Model 2 on XRP, either from the liquidity, extreme demand, or extreme liquidity.

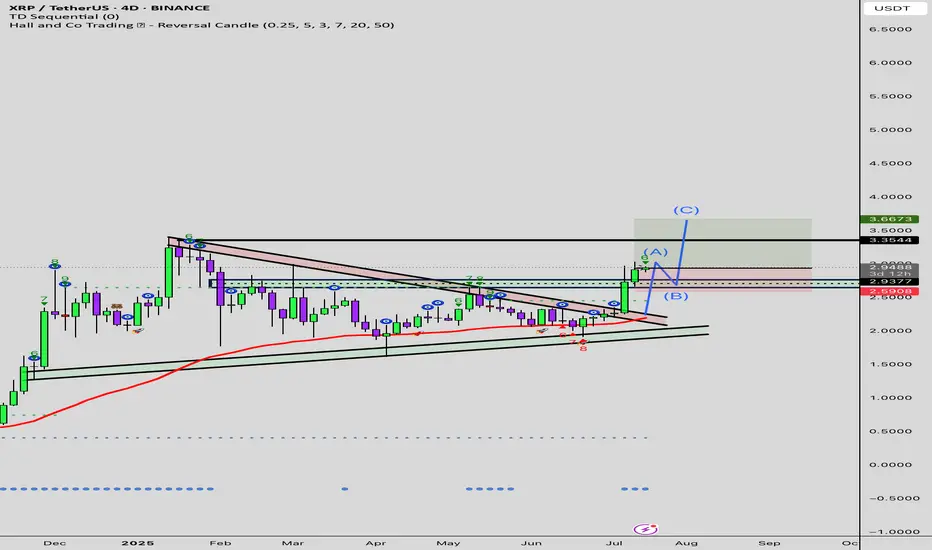
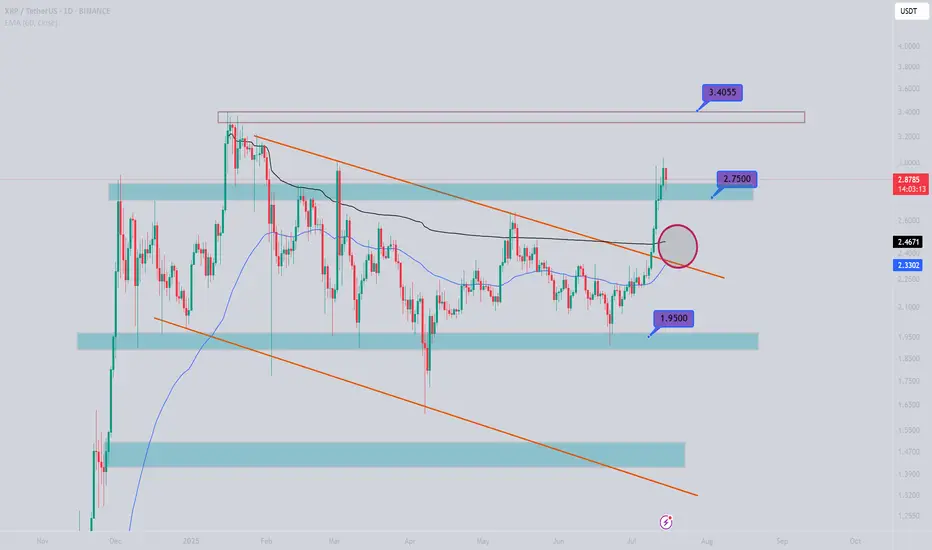
Is This the Last Dip Before XRP Hits $4+!CRYPTOCAP:XRP looks ready for another big move! 🚀
Price might drop to around $3.32, a strong support zone with Fib and trendline.
That dip could be a great buy opportunity.
If it bounces, we could see $4+ next.
#XRP

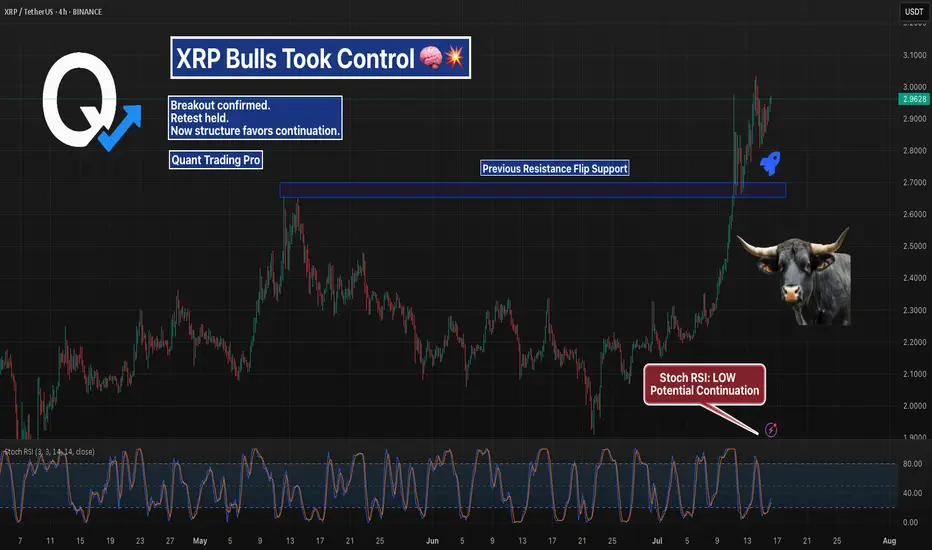
XRPUSDT – Breakout Retest Confirmed | Bulls in ControlXRP flipped its previous resistance zone into support and is now consolidating above it.
Structure looks strong, momentum is intact, and the breakout zone held cleanly — bullish continuation is the dominant scenario unless the flip fails.
Watching for continuation above $3.00 or sharp reaction at key levels.
#XRPUSDT #Breakout #CryptoTrading #SupportResistance #QuantTradingPro #TradingView
Ripple buy signalHello friends
Given the good growth we had, we entered a deep correction, and now we have the opportunity to buy step by step in the specified support areas with capital and risk management and move with it to the specified targets.
*Trade safely with us*

XRP/USD (RIPPLE) BUYtitle: XRP/USD (RIPPLE) BUY
Asset: Crypto
Symbol: XRP/USD
Market Entry Price 1: $2.9450
Limit Entry Price 2: $2.7450
Stop Loss: $2.6450
Take Profit 1: $3.145 (close 10%)
Take Profit 2: $3.345 (close 25%)
Take Profit 3: $3.645(close 50%)
Take profit 4: $3.845 (close 75%)
Let any remaining Xrp run risk free
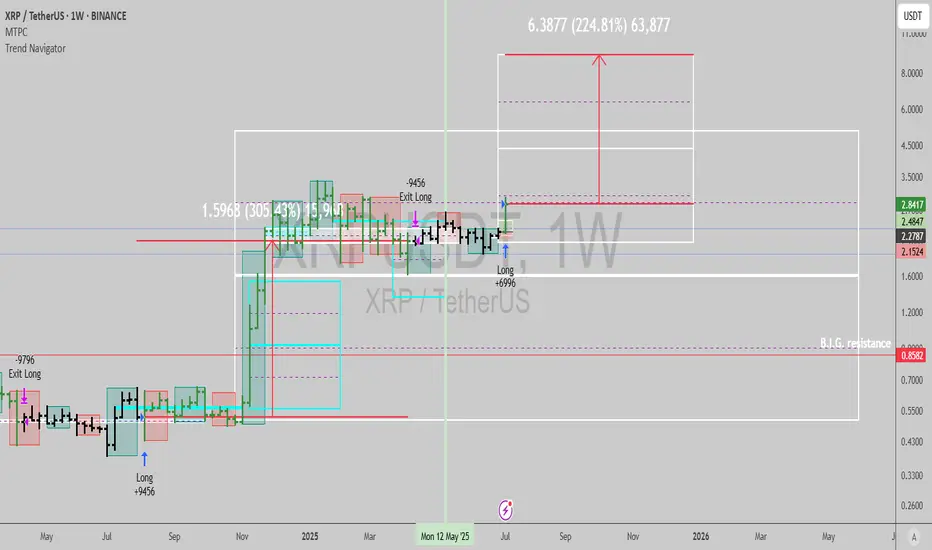
$XRP: Long term buy signalGN gents, interestingly, Ripple is one of the strongest charts in crypto currently, and it has flashed long term buy signals indicating the bull market continues NOW.
The last trade netted 305% upside, I estimate at least 224% can be achieved from here, with very low risk.
Best of luck!
Cheers,
Ivan Labrie.
Four Failed Breakouts… Then the Real One HitThe $2.22 level stopped XRP dead in its tracks four times.
Each failed breakout built more pressure — and when it finally cleared, price exploded.
Now it’s trending clean, breaking structure after structure.
This is what a proper breakout looks like.
#XRP #XRPUSD #BreakoutTrading #ChartPatterns #FailedBreakout #CryptoSetup #BacktestEverything #TradingView #QuantTradingPro

XRP - Perfect Prediction Please refer to our previous posts:
As stated in the last post our breakout target level (key level) was just hit. A 44% breakout move just occurred over the past 10 days due to the amazing analytics of the Viaquant system.
Now it is possible we see some profit taking in this region, but as soon as the last high is breached I have also outlined where to expect the next top to potentially come in at. Right now the range looks to be between $4.50-$5.33.

XRPUSDTEverything went according to the previous analysis and we reached the target of 2.7.
Taking profit at this point would be logical and the marked red area would be a worthwhile price to buy back in the long term.
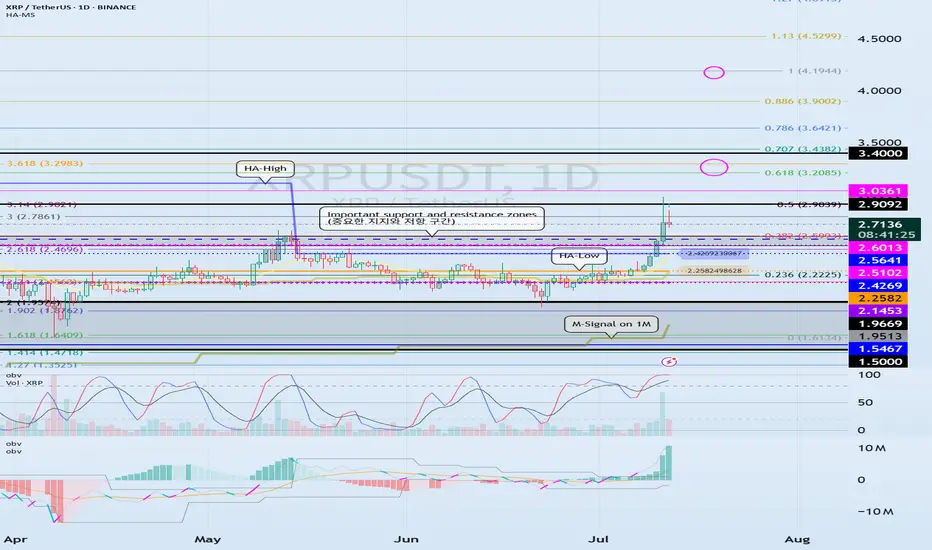
Check support above 2.5102-2.6013
Hello, traders.
If you "Follow", you can always get new information quickly.
Have a nice day today.
-------------------------------------
(XRPUSDT 1D chart)
It has broken through the important support and resistance zone.
Accordingly, the key is whether the price can be maintained above 2.5102-2.6013 and rise.
If the price is maintained above 2.5102-2.6013, it is possible that a stepwise rise will occur.
At this time,
1st: Right Fibonacci ratio 0.618(3.2085) ~ Left Fibonacci ratio 3.618(3.2983)
2nd: Right Fibonacci ratio 1(4.1944)
You need to check for support near the 1st and 2nd above.
The strong support area is 1.5-1.9669.
----------------------
The left Fibonacci ratio was drawn in the initial rising wave, and the right Fibonacci ratio was drawn in the recent rising wave.
Therefore, if the price rises above 3.618(3.2983) of the Fibonacci ratio drawn in the initial rising wave and maintains it, there is a high possibility of creating a new wave.
Since the Fibonacci ratio is a tool for analyzing the chart, it is not good to use this point as a support and resistance point.
Therefore, we need to check whether the DOM(60) indicator or the HA-High indicator is newly created and create a response strategy depending on whether there is support.
Currently, the DOM(60) indicator is formed at the 2.5102 point, and the HA-High indicator is formed at the 2.4269 point.
The basic trading strategy is to buy near the HA-Low indicator and sell near the HA-High indicator.
However, if it receives support in the HA-High ~ DOM(60) section and rises, it is likely to show a stepwise upward trend, and if it receives resistance in the DOM(-60) ~ HA-Low section and falls, it is likely to show a stepwise downward trend.
Therefore, trading begins by checking whether there is support in the DOM(-60) ~ HA-Low section and the HA-High ~ DOM(60) section.
-
Thank you for reading to the end.
I hope you have a successful transaction.
--------------------------------------------------
- Here is a description of the big picture.
(3-year bull market, 1-year bear market pattern)
I will explain more details when the bear market starts.
------------------------------------------------------
LIVE TRADE (XRP)Hello friends🙌
🔥Here we are with live trading Ripple, please follow capital management.
📈Given the resistance break, we can enter a buy trade and move with it to the specified targets.
🔥Follow us for more signals🔥
*Trade safely with us*

#XRP/USDT - SHORTThe chance that the asset will reach the $5 level is extremely low. This is indicated only by the 3-month timeframe. The rest of the data suggests that the movement will be in one direction.
(Not an investment recommendation).
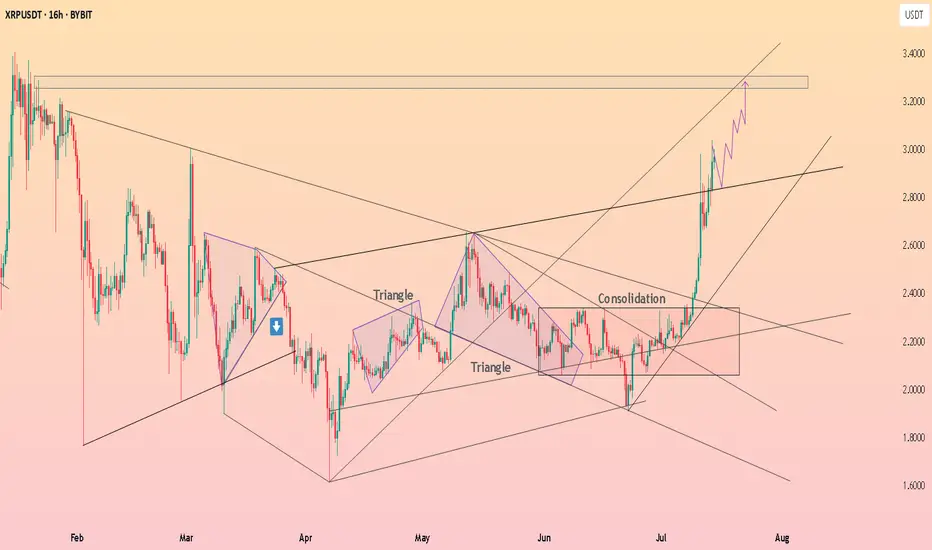
HolderStat┆XRPUSD explosive growthBYBIT:XRPUSDT rallied out of consolidation and triangle formations, driving price quickly toward the $3.20–$3.40 range. The trend remains bullish with structure pointing toward continued upside as long as support holds above $2.80.