XRP hourly timeframe updateRipple CEO Brad Garlinghouse will testify at a July 9 U.S. Senate Banking Committee hearing on crypto market structure. This comes alongside proposed legislation to clarify SEC/CFTC jurisdiction over tokens like XRP, potentially resolving its multi-year regulatory limbo. Markets are pricing in reduced litigation risk after Ripple’s recent moves to integrate RLUSD stablecoin with institutional platforms like Hidden Road
XRPUSDT.3L trade ideas
XRP/USDT – Breakout Confirmed!Hey Traders — if you're into high-conviction setups with real momentum, this one’s for you.
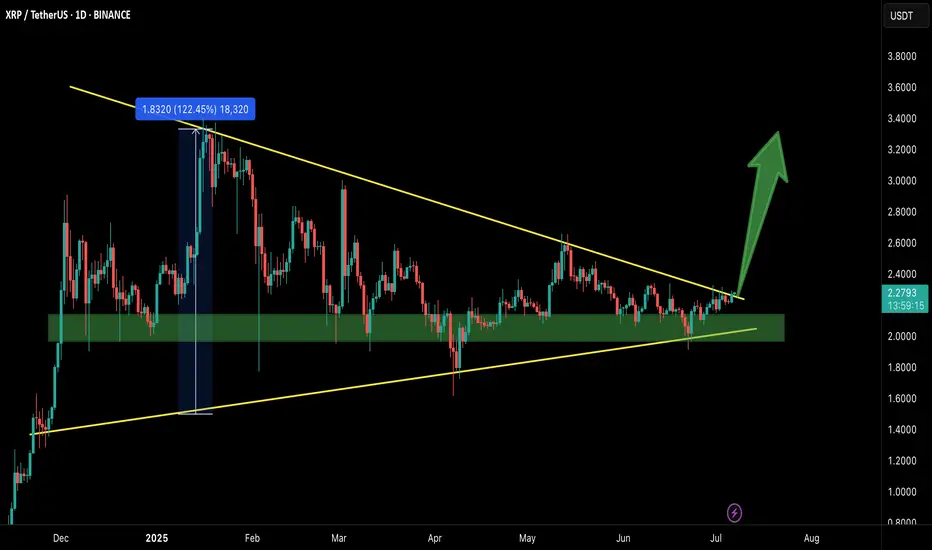
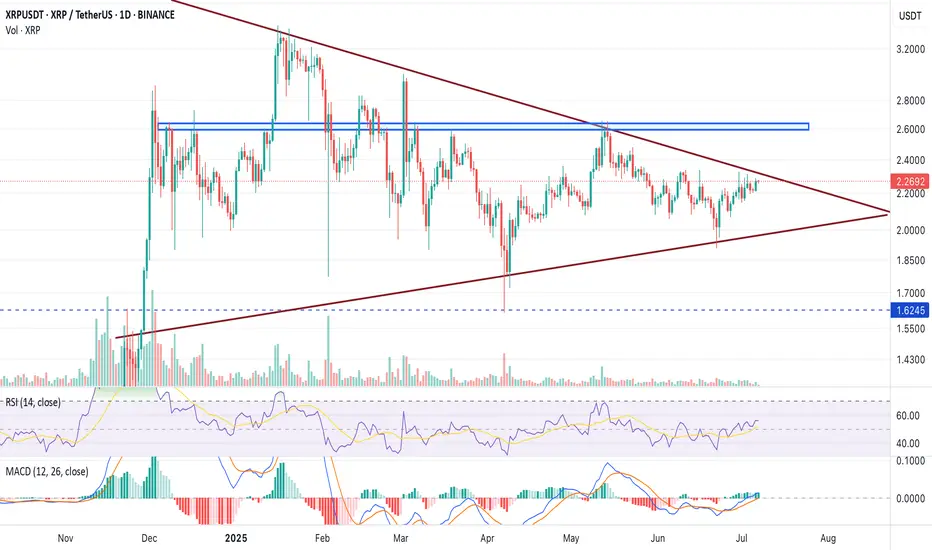
XRP has finally broken out from the massive symmetrical triangle on the 1D timeframe after holding the green support zone like a champ.
This structure has been compressing for months, and with this breakout, momentum could be shifting in favor of the bulls.
Entry: Current Market Price (CMP)
Add More: On dips above $2.20
Targets: $2.60 / $2.95 / $3.40 / $3.80
Stop Loss: $2.05
Leverage: 5x–10x
As long as price stays above the breakout zone, this setup holds strong potential. Keep a close eye for volume confirmation and follow-through.
Let’s see how this plays out. Will update as it unfolds.
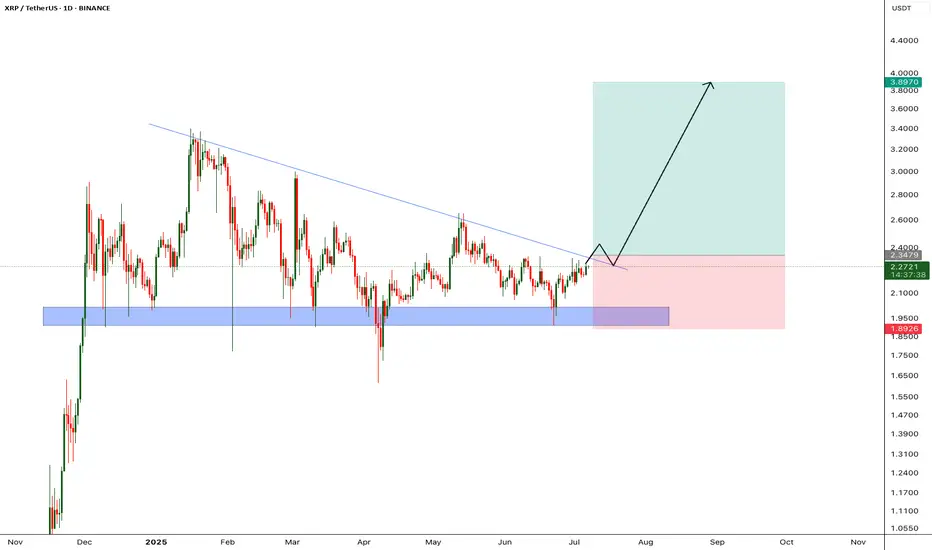
XRP - Huge breakout incomingXRP price is retesting it's descending trendline, in the past price got rejected from this trendline multple times, however im expecting price to breakout from this trendline since we almost at the last 2 quarters of bull run.
We will enter the trade after candle closes above the trendline
Entry Price: 2.34
StopLoss: 1.89
TP1: 2.5981
TP2: 2.8543
TP3: 3.2796
TP4: 3.8676
Like and follow.
Cheers
GreenCrypto
#XRP/USDT#XRP
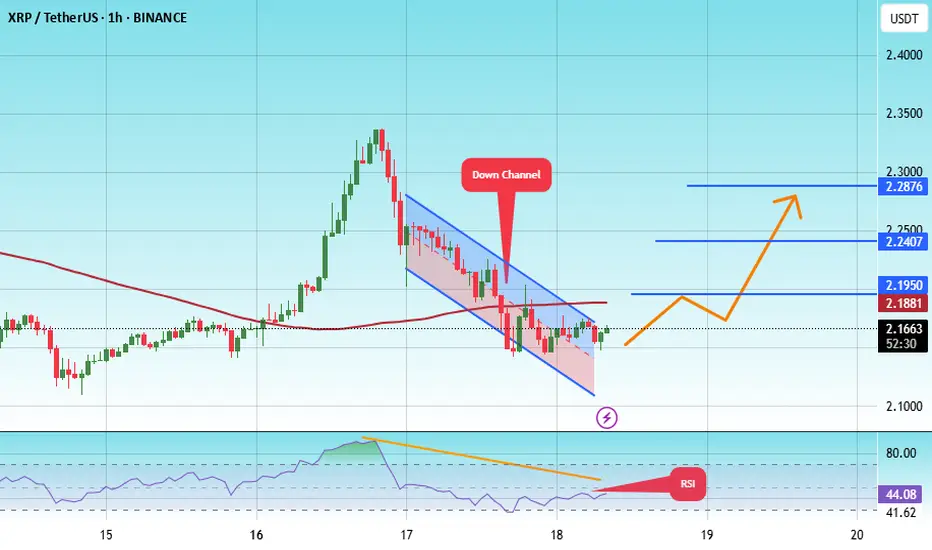
The price is moving within a descending channel on the 1-hour frame, adhering well to it, and is heading towards a strong breakout and retest.
We are experiencing a rebound from the lower boundary of the descending channel, which is support at 2.11.
We are experiencing a downtrend on the RSI indicator that is about to be broken and retested, supporting the upward trend.
We are looking for stability above the 100 Moving Average.
Entry price: 2.16
First target: 2.20
Second target: 2.24
Third target: 2.28
XRP/USDT: Is Ripple Gearing Up for a Breakout?XRP/USDT charts highlight a tightening price structure that hints at a possible breakout. With regulatory clarity emerging and XRP adoption increasing, traders are watching closely. This analysis explores the technical outlook for XRP, including trendlines, support-resistance zones, RSI signals, and volume metrics that may signal XRP’s next major move.
Current Market Structure (as of July 2025)
Price: ~$0.63
Resistance: $0.68 – $0.72 (multi-week rejection zone)
Support: $0.56 – $0.58
Trend: Short-term consolidation in a symmetrical triangle
Volume: Declining, suggesting a pre-breakout phase
On the daily chart, XRP is forming a symmetrical triangle pattern, a classic consolidation setup that often leads to a breakout when accompanied by rising volume. The lower highs and higher lows indicate price compression near the apex.
Technical Indicators to Watch
RSI (Relative Strength Index): Currently near 50 on the daily chart—neutral territory. A move above 60 could suggest bullish momentum building.
MACD (Moving Average Convergence Divergence): Flat, but showing signs of a potential bullish crossover on the 12H chart. A crossover above the zero line would further support bullish continuation.
Volume Profile: Volume declining during consolidation = textbook pattern before a volatility spike.
Look for a volume spike + breakout candle above $0.68 for confirmation.
🔍 Key Resistance & Support Levels
Level Role Reason
$0.72 Major Resistance Previous swing high, rejected 3 times since April 2025
$0.63 Pivot Level Midpoint of the range, near trendline resistance
$0.58 Key Support Base of recent bounce; trendline support
🚀 Bullish Breakout Scenario
If XRP breaks and closes above $0.72 with volume, the next upside targets could be:
$0.84 – Minor resistance from September 2023.
$1.00 psychological level – A key round-number target.
$1.25–$1.40 – Fib extension from the $0.42–$0.72 range.
A move toward these levels could signal the start of a new macro uptrend, especially if fueled by news (e.g., exchange relistings, Ripple partnerships, or legal clarity).
🧨 Bearish Rejection Scenario
Failure to break $0.68–$0.72 could result in a pullback to:
$0.58 support
If broken, next major level = $0.50
Watch for increasing bearish volume on rejection to confirm weakness.

XRP $2 Support Updated, Tested 12 Times & When BullishThere is one number, a price level, that defines XRP's current situation. Either bearish or bullish depends on this number: $2.
As long as XRPUSDT trades above $2, we know the bulls have the upper hand and the bullish bias is confirmed.
If XRPUSDT moves and closes below $2, we know the bulls are losing momentum, the bears are gaining the upper hand and lower prices are possible.
What is the current situation?
XRP continues to trade above $2 and this price continues to be left behind, meaning, the bulls are winning.
Before 7-April, this level was tested over and over, again and again. After 7-April, only two challenges and the last one, 21-June, ended as a perfect bullish hammer. Now the action is moving higher toward resistance, growing not lower. $2 has been confirmed as support.
Now that support has been confirmed, we can expect additional growth. It can take some time, maybe a few days but the bulls are in control.
It can take some time, not that long, the market has been sideways for more than 7 months. This is a long-time and no more is needed. The consolidation period just reached its end.
The final low happened late last month, Crypto is set to grow; XRP will be doing great in a matter of days. Closer than anything you can think or expect, next week can be boom, sellers are exhausted. People are back to work.
Thank you for reading.
We are about to experience a growth explosion.
Namaste.

XRP wants to ripCould happen faster than anticipated, and the pullbacks could be a little deeper.
Those are the levels I will be watching regardless of pace.

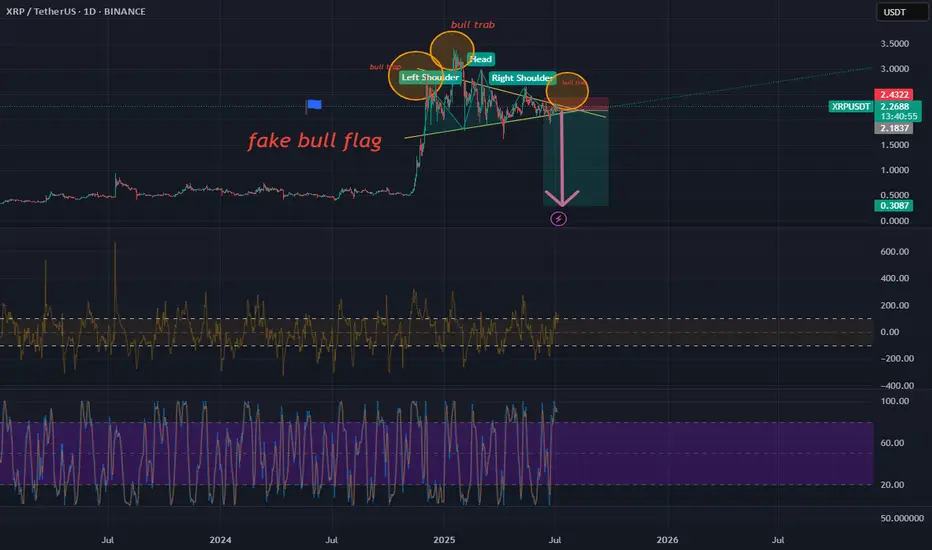
XRP is setting up fake bull flag ! SHORT TO USD 0,30 The meaningless bullish formation seen specifically for XRP is actually a big trap. This big bullish pennant formation that is being drawn is actually a big trap. I expect a very clear short position in XRP along with ETH.
This is a personal study for educational purposes. It is never investment advice. Please do your own research.
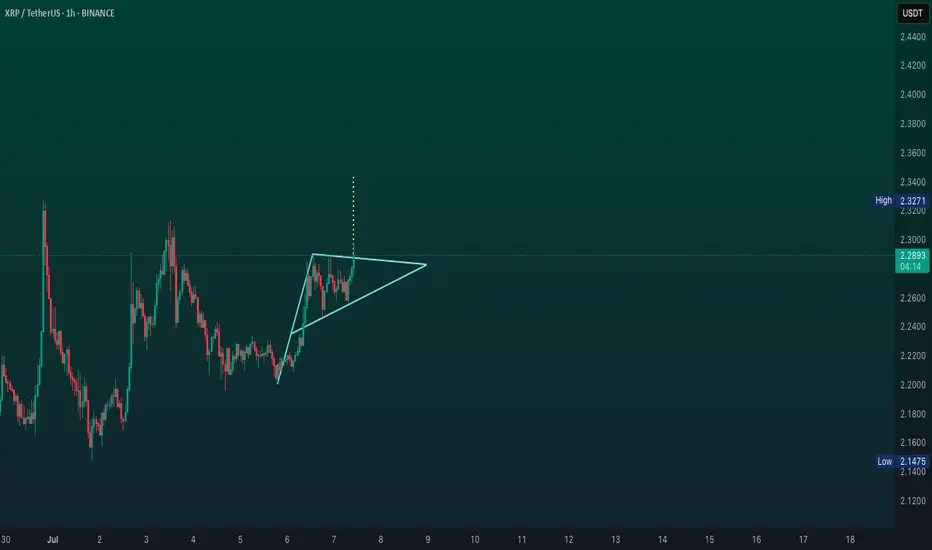
XRP LONG
I am thinking of a couple of days swing trade.
I am waiting for a long breakout in the sideways channel near the previous highs with TP1 and SL drawn IN. TP2 is at the top of the sideways trend channel.

XRP rise to 2.32 or total surge to 2.52 or back to 2.15....Hello Losers and Winners, I am Bob, long time TV ideas listener first time poster here goes:
XRP has been capitulating for maybe three days now between price 2.20 - 2.225-ish price. I see need for XRP to reduce itself to 2.15 (local cme) then to hopefully bounce and hopefully in coming 24 hrs. Alternatively stays capitulating or even bumps from here, who knows, it is a completely unpredictable coin and I love it so. (but for that reason you need bets either way):)

XRP Breakdown Ahead? Don’t Get Caught LongYello, Paradisers! Are you about to fall into a classic trap on XRP? The signs are stacking up, and if you're not careful, this move could catch a lot of traders on the wrong side of the market.
💎XRPUSDT is showing clear signs of weakness. A bearish CHoCH (Change of Character) has formed, and an inverse Cup & Handle pattern is currently playing out. On top of that, price action has decisively broken below the key support trendline. These signals together significantly increase the probability of a deeper bearish move in the coming days.
💎From the current price level, XRP is offering a 1:1 risk-to-reward setup. While this may attract more aggressive or short-term traders, the safer and more strategic approach is to wait for a proper pullback before entering. That would allow for a more favorable risk-to-reward and confirmation of the trend direction, reducing the likelihood of being caught in short-term noise.
💎It’s also crucial to watch the invalidation level. If XRP manages to break back above that zone and close a candle above it, this would invalidate the current bearish idea entirely. In such a case, it's better to stay patient and wait for clearer price action before making any decisions.
🎖Strive for consistency, not quick profits. Treat the market as a businessman, not as a gambler.
MyCryptoParadise
iFeel the success🌴

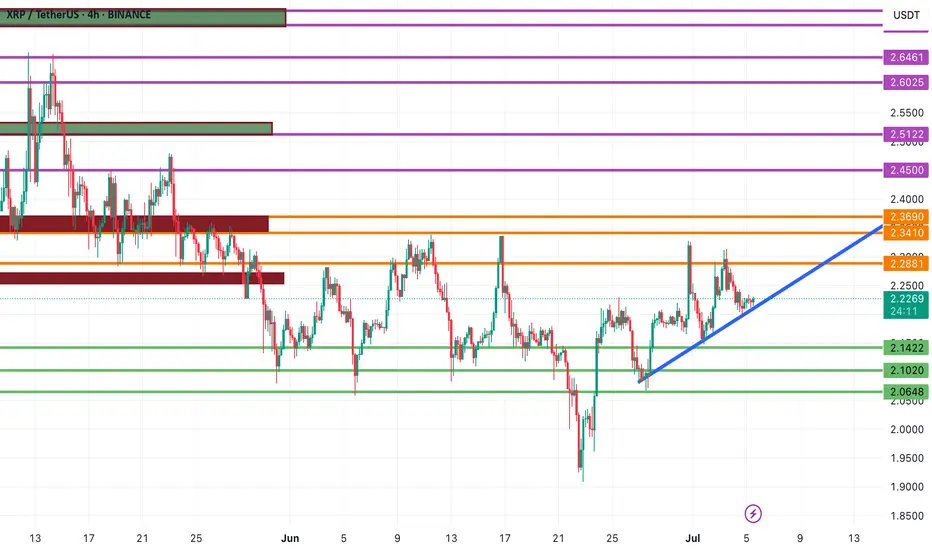
XRPUSDT Technical Analysis – Ripple at a Key Decision Point!🚀 XRPUSDT Technical Analysis – Ripple at a Key Decision Point!
As expected from our previous analysis, XRP has respected the bullish structure and is now hovering right on its ascending trendline. If the price holds this level and confirms bullish signals, a strong upside move may follow.
🔹 Upside Targets:
Key resistance levels to watch are 2.3410 and 2.3690. A breakout above these zones could push XRP toward 2.4500 and then 2.5122.
🔻 Bearish Scenario:
If the trendline breaks down, XRP may revisit previous support zones at 2.1778, 2.1422, and possibly 2.1020.
🎯 Stay tuned for updates – we deliver precise and strategic charts to help you stay ahead of the market.
👉 Follow for real-time crypto insights and smart trading setups!
XRP Fundamental Drivers:
Growing institutional interest, including potential ETF approvals, is boosting sentiment.
Macro tailwinds such as a weakening US dollar and easing Federal Reserve rate expectations may support crypto prices, including XRP.
XRP’s role in cross-border payments and partnerships continues to underpin its use case.
THIS COIN HAS FUTURE.
#XRP

Will Ripple "leave a dent in the universe"?They called us crazy, when we bought xrp at the bottom, in the midst of court cases. What they don't see is that, many TODAY major companies that changed the world (e.g. Apple, Amazon, MSFT etc.) had long term court cases with the SEC before "leaving a dent in the universe". In our opinion, Ripple is next in line.
#xrp #crypto #bitcoin #ripple #banking #blockchain #finance #money #stablecoin #financialsystem

HolderStat┆XRPUSD forms an ascending structureBINANCE:XRPUSDT is forming a stair-step bullish pattern after breaking out of consolidation above 2.12. The current trajectory suggests continued movement toward 2.70, with multiple support bounces validating the structure. Price action remains favorable for bulls.


HolderStat┆XRPUSD forming the rising bottomBINANCE:XRPUSDT has broken above resistance and is consolidating above the breakout zone. This mirrors previous triangle–consolidation patterns that preceded upside moves. If momentum continues, a run toward 2.34 is in play.

XRP 4H TIMEFRAME ANALYSISXRPUSDT strcuture shifted into bullish after CHoCH, Thats why I have marked OB+FVG as POI for long.

XRPUSDT UPDATE
Pattern: Falling Wedge Breakout
Current Price: \$2.2983
Target Price: \$2.60
Target % Gain: 20.23%
Technical Analysis: XRP has broken out of a falling wedge on the 12H chart with strong bullish candles and a volume surge, indicating momentum. The measured move targets a 20% gain from the breakout zone.
Time Frame: 12H

XRPUSDT → Resistance retest. Coin inside the flatBINANCE:XRPUSDT is rising towards resistance at 2.3288 due to a shift in the fundamental background to positive and a rally in Bitcoin, but there is always a but...
On the daily chart, XRP is trading below strong trend resistance, and there is also a fairly strong and voluminous liquidity pool at 2.3300 ahead, which could provide strong resistance. Bitcoin is also approaching its critical level of 110500, which may temporarily hold back growth, and a correction in the flagship could trigger a correction in the rest of the market...
Focus on resistance and the liquidity pool at 2.3288. A sharp approach and capture of liquidity without the possibility of continuing growth could lead to a correction by half or the entire local range (to 2.16).
Resistance levels: 2.3288, 2.357, 2.45
Support levels: 2.25, 2.213, 2.16
If the retest of resistance at 2.3288 ends in a false breakout, then subsequent consolidation below the level could trigger a correction to the above support and interest zones.
Best regards, R. Linda!


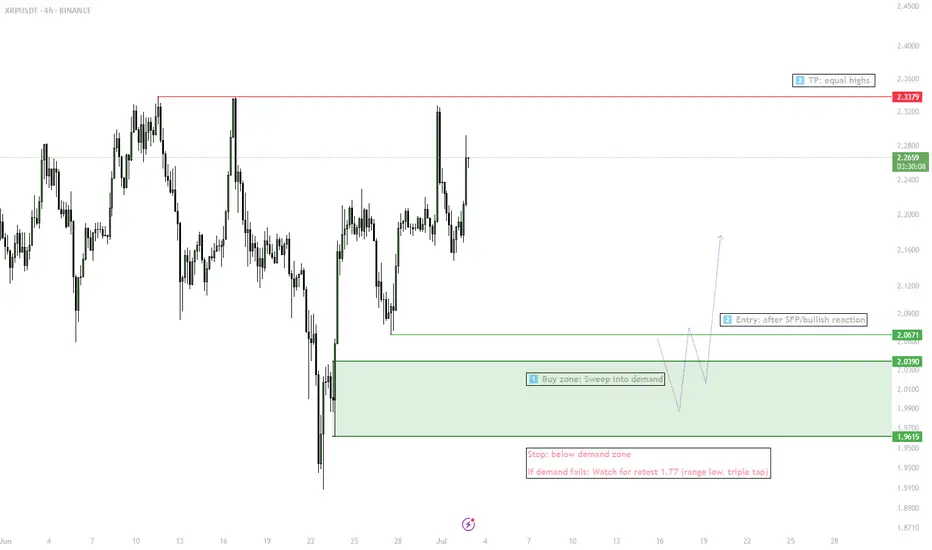
XRP — Liquidity Sweep & Range Play1. Wait for sweep into demand (2.07–1.95)
2. Enter long on SFP/bullish confirmation
3. Target: 2.33 (equal highs)
4. Stop: below demand zone
5. If stop triggered — next watch 1.77 for triple tap setup