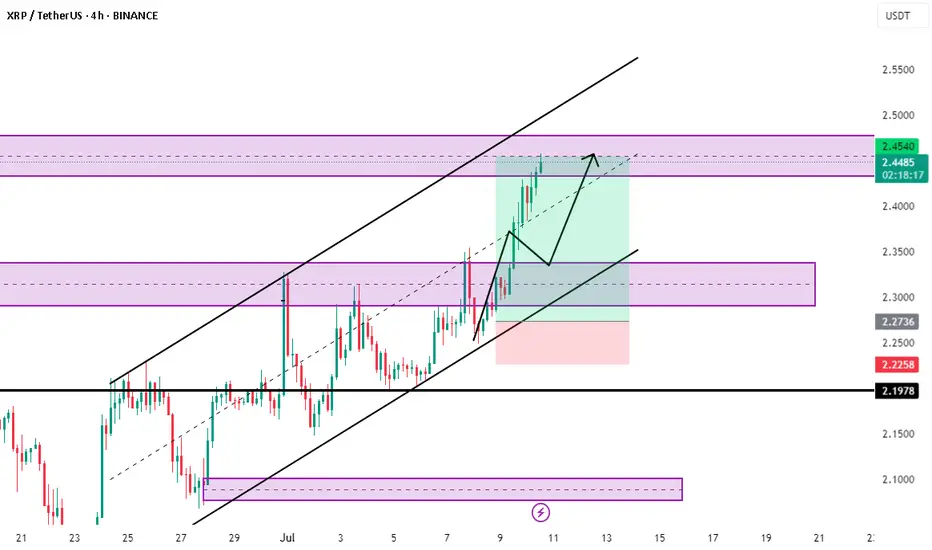
Good moment for try to Buy XRPGood moment for try to Buy XRP. We are in a sideways trend and are now approaching its upper border. We will take a breakout. Stop under the lower line of the channel. We'll see
XRPUSDT.PS trade ideas

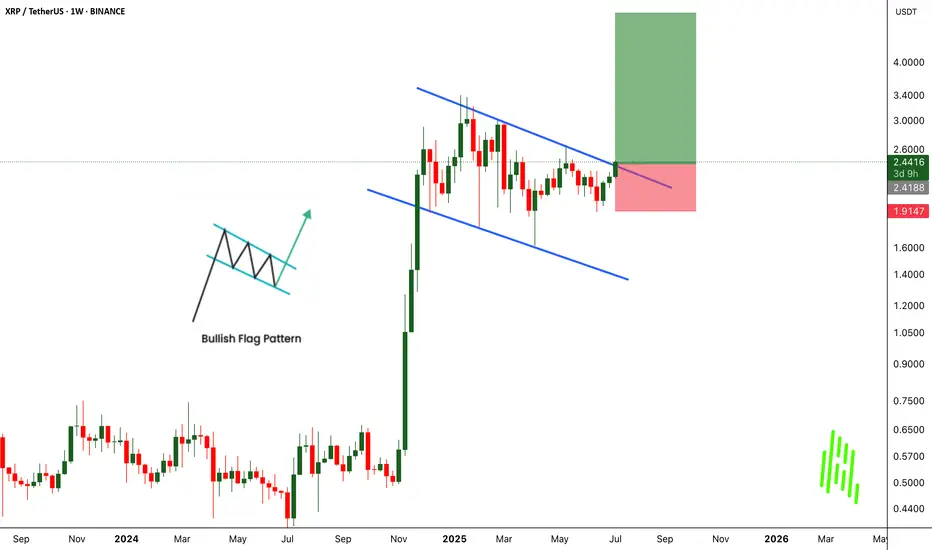
XRPUSDT Breaks Out of Bullish Flag - Big Moves Ahead!BINANCE:XRPUSDT has broken out of a classic bullish flag pattern on the weekly chart, signaling a strong continuation to the upside. This textbook setup is known for its high success rate, and the breakout suggests the potential for significant gains if momentum continues.
The CRYPTOCAP:XRP community remains strong, with long-term holders showing confidence and resilience. With the current market structure and support from loyal investors, there’s a real possibility for the price to double from this breakout zone.
The strategy is simple. Buy and hold for the long term. But as always, traders must manage risk carefully and use a proper stop loss. Let the flag fly high. CRYPTOCAP:XRP could be ready for a major pump from this level.
BINANCE:XRPUSDT Currently trading at $2.43
Buy level : Above $2.4
Stop loss : Below $1.9
Target : $5
Max leverage 3x
Always keep stop loss
Follow Our Tradingview Account for More Technical Analysis Updates, | Like, Share and Comment Your thoughts
#XRP Update #1 – July 8, 2025🟢 #XRP Update #1 – July 8, 2025
XRP has touched the lower edge of its 20-day ascending trendline and is currently holding above the 200 MA, a positive sign technically.
While there is a resistance zone above, it doesn’t appear too strong. Minor selling pressure might emerge around 2.35, but overall the setup looks promising.
▫️ Entry: 2.260
▫️ TP1: 2.320 (50%)
▫️ TP2: 2.390 (50%)
▫️ Stop: 2.235
▫️ RR Ratio: 5.15
❗️ With a tight stop (~1%) and a potential upside of 5.7%, this setup offers a favorable risk-reward opportunity. If it aligns with your capital and risk tolerance, it may be worth considering.

$XRP - Falling Wedge Breakout is CookingRipple is forming a simple yet perfect setup
There is a strong horizontal support level of $2.11 that was established back in December of 2024 and has held the price perfectly (with only one breakdown) since then. Moreover, at that time a massive Falling Wedge started forming and is still doing it up to this day.
Talking about resistances, there is a $2.45 one. Not very strong, but solid enough to form a decent horizontal channel within which the price moves.
So, as the result we have the following structure: CRYPTOCAP:XRP has been consolidating above strong support for 6 months already and formed a pattern that suggest upcoming upward movement. The perfect entry spot in LONG will be at the breakout&retest of the both $2.45 resistance and Falling Wedge resistance (they perfectly correlate) .
Target zone of $3.5 - $4 can be reached within the next 3 - 5 months.

Ripple (XRP): Looking For Breakout | Possible Good Buy EntryRipple has had an insane buy-side volume lately, and the price is currently testing the local resistance zone (neckline area). We are looking for a proper breakout from this area (which will happen if we keep current buyside momentum as it is). As soon as we get it, we are going to look for a buy entry, which should lead the price towards our major target of the upper resistance zone.
Swallow Academy

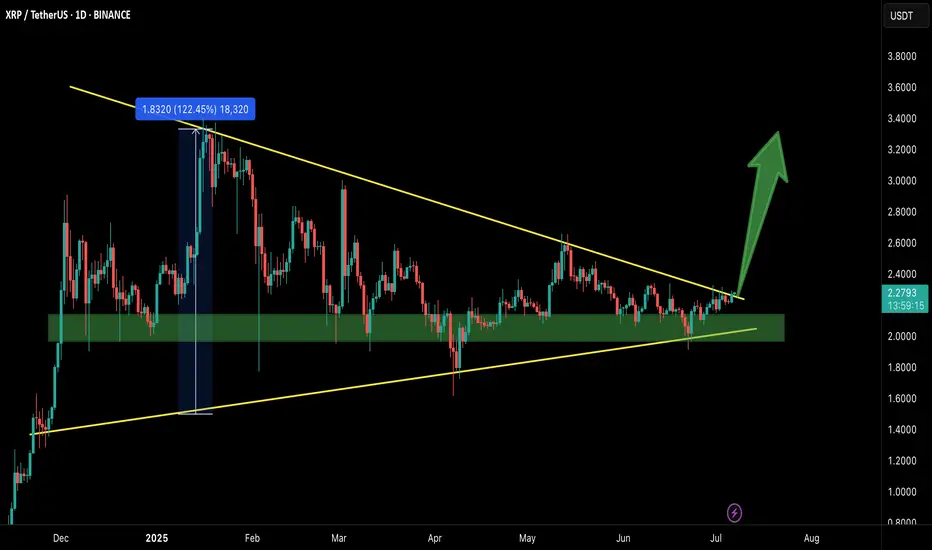
XRP Technical Analysis – Massive Breakout in Play!After months of tight consolidation inside a symmetrical triangle, XRP/USDT has finally broken out with strong bullish momentum on the daily timeframe.
🔹 Chart Pattern: Symmetrical Triangle
🔹 Breakout Confirmation: Daily candle closed above the descending trendline resistance
🔹 Support Zone: ~$2.00 – $2.20 (Held multiple times since April)
🔹 Breakout Level: ~$2.48 – $2.50
🔹 Next Resistance Levels:
▫️ $2.62 – Minor horizontal resistance
▫️ $3.39 – Major resistance from previous highs
▫️ $4.92 – Long-term macro target (measured move from triangle)
🧠 Why does this breakout matter?
✅ Strong Volume: Breakout happened with increased volume – a sign of genuine breakout
✅ Multi-month Base: The longer the consolidation, the stronger the breakout
✅ Support Respect: XRP respected the demand zone repeatedly, showing accumulation
✅ Momentum Building: A clean break could trigger trend-following bots and new buyers

XRP/USDT Trade Setup – 15minLondon session raided Asia's lows, grabbing liquidity and creating the conditions for a bullish reversal. This setup aligns with the NY session's typical continuation behavior following a London manipulation move.
Post-raid, price structure shifted bullish, indicating smart money accumulation. A clear fair value gap (FVG) formed, and entry was taken upon confirmation of bullish order flow.
Entry: 2.227
Stop Loss: 2.200
Take Profit: 2.400
Risk-Reward Ratio: 9.23R
Narrative:
London session swept Asia lows (liquidity engineered).
Break in market structure confirmed shift.
Entry aligned with FVG and order block mitigation.
Targeting inefficiency fill and liquidity above recent highs.
Note:
This trade is for journal purposes only and not financial advice.
Always perform your own analysis and manage risk accordingly.

XRP is ready ?XRP has been consolidating since last high from Jan this year. MACD shows that the momentum is picking up and I see it is ready for next move.
A weekly close will confirm it.

XRPUSDT Forming Bullish BreakoutXRPUSDT is showing an interesting setup with a bullish breakout potential that could fuel gains of 60% to 70% or more in the coming weeks and months. The recent price action suggests that XRP is breaking out of a long-standing consolidation pattern, with price pushing above a descending trendline and holding well above key support levels. This breakout is attracting both retail traders and big investors who see Ripple’s strong fundamentals and unique use case in the cross-border payment sector as major catalysts for its long-term growth.
The trading volume has remained healthy, signaling strong market participation and increasing confidence that XRP’s next move could be substantial. If momentum continues, traders can expect a potential rally towards major resistance zones, with increased interest from whales likely to accelerate the bullish scenario. Market sentiment around XRP has also improved thanks to positive developments in its legal battles and expanding partnerships, which add further conviction for investors.
XRP’s performance has historically shown that when it moves, it often does so aggressively, rewarding patient holders and active traders alike. This pattern aligns well with broader altcoin market cycles, where XRP tends to outperform during bullish phases. As always, it’s essential to monitor price action around key levels, adjust stop-losses wisely, and stay updated with market news to make the most of this potential run.
✅ Show your support by hitting the like button and
✅ Leaving a comment below! (What is You opinion about this Coin)
Your feedback and engagement keep me inspired to share more insightful market analysis with you!

XRP head to 7$XRP will make it the 2nd biggesst crypto in histiry surprassing Ethereum once ET Network is suffeering the biggest sells ever by traders.
Everyone on the other side is beting on Bitcoin, making it bigger but with room for others like XRP the best performing crypto in history.

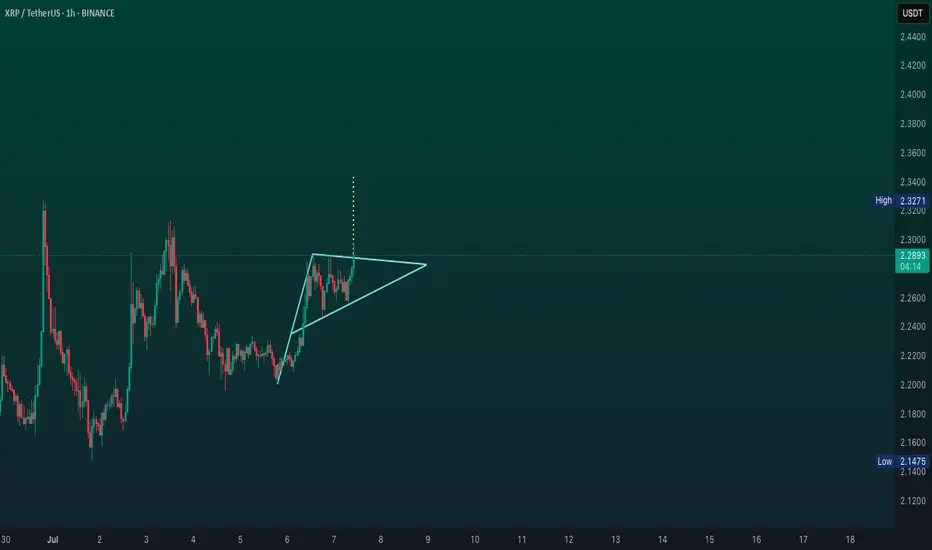
XRP Pattern Repeats—Next Move to $2.34?The XRP/USDT 1-hour chart is showing a compelling setup that may mirror a previously bullish price pattern. The left side of the chart highlights Pattern 1, which played out after a period of sideways consolidation followed by a breakout, resulting in a strong upward move. Now, price action is repeating a similar structure with nearly identical conditions forming.
In Pattern 1, XRP consolidated in a tight range, flipped the trend indicator from red to blue (suggesting a momentum shift), and then surged higher. This same transition is occurring again in the current market phase. Price has reclaimed the trend baseline, which has turned blue, hinting at growing buyer strength.
The idea here is that XRP could be preparing for another impulsive move to the upside, identical to what happened before. The setup is visually marked with a trade box showing entry, stop-loss, and target levels.
Trade Idea Based on Current Pattern
• Entry: 2.2849
• Target: 2.3436
• Stop-loss: 2.2520
• Reward-to-Risk (R:R): ≈ 1.78
• Potential Gain: 2.57%
• Potential Loss: 1.44%
The structure favors a long position, as long as the price holds above the 2.25–2.26 support range. A break below this could invalidate the setup and trigger the stop-loss. If the breakout is confirmed with volume, XRP could move rapidly toward the 2.34 level and possibly beyond.
This kind of fractal behavior, where patterns repeat themselves in similar market conditions, is common in crypto. With the trend indicator already flipping bullish and price forming higher lows, the probability of continuation looks solid—especially for short-term traders.
As always, trade with proper risk management, and be cautious of volatility that can trigger stop-hunts in tightly ranged zones.

Trading plan for XRP BINANCE:XRPUSDT Price has already hit our third target from last week's analysis. While the asset continues its upward momentum with this week's third target still in play, the overbought RSI suggests we might see a local correction before final target achievement
Trade safe and stay adaptive

XRP hourly timeframe updateRipple CEO Brad Garlinghouse will testify at a July 9 U.S. Senate Banking Committee hearing on crypto market structure. This comes alongside proposed legislation to clarify SEC/CFTC jurisdiction over tokens like XRP, potentially resolving its multi-year regulatory limbo. Markets are pricing in reduced litigation risk after Ripple’s recent moves to integrate RLUSD stablecoin with institutional platforms like Hidden Road
XRP Fundamental Drivers:
Growing institutional interest, including potential ETF approvals, is boosting sentiment.
Macro tailwinds such as a weakening US dollar and easing Federal Reserve rate expectations may support crypto prices, including XRP.
XRP’s role in cross-border payments and partnerships continues to underpin its use case.
THIS COIN HAS FUTURE.
#XRP

HolderStat┆XRPUSD targeting $2.4BINANCE:XRPUSDT is printing repeated consolidation zones and ascending structures. Price is currently rebounding above 2.20, eyeing a breakout toward 2.40. The bullish momentum persists with higher lows and breakout setups.

XRP/USDT – Breakout Confirmed!Hey Traders — if you're into high-conviction setups with real momentum, this one’s for you.
XRP has finally broken out from the massive symmetrical triangle on the 1D timeframe after holding the green support zone like a champ.
This structure has been compressing for months, and with this breakout, momentum could be shifting in favor of the bulls.
Entry: Current Market Price (CMP)
Add More: On dips above $2.20
Targets: $2.60 / $2.95 / $3.40 / $3.80
Stop Loss: $2.05
Leverage: 5x–10x
As long as price stays above the breakout zone, this setup holds strong potential. Keep a close eye for volume confirmation and follow-through.
Let’s see how this plays out. Will update as it unfolds.
Breakout loading on $XRPBreakout loading on CRYPTOCAP:XRP 🚀
Accumulating heavily here as the price coils inside a massive triangle.
Q3 could be explosive, chart points to a breakout toward $4.60
Retweet if you're BULLISH !!

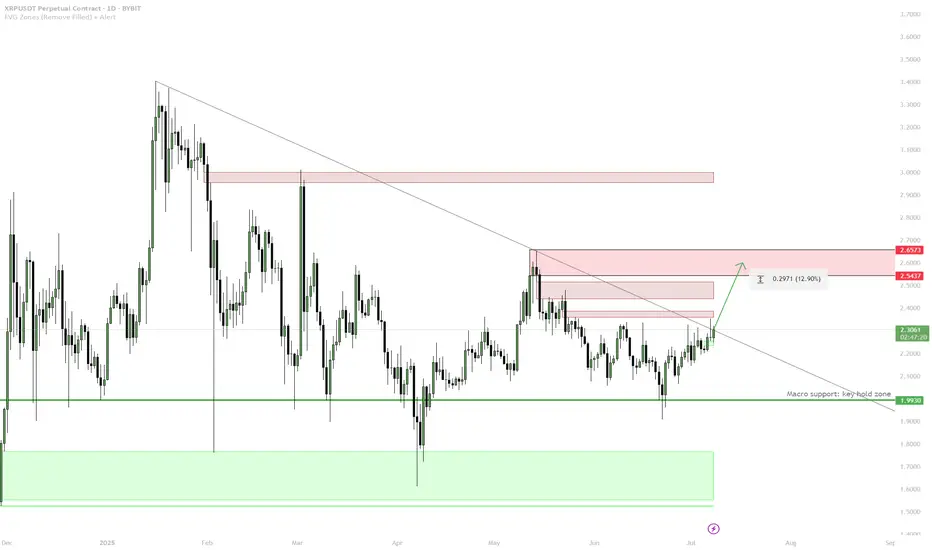
XRP — Macro Support Hold & Redbox Target1. Macro support (1.99) held — bullish bias
2. Enter on confirmed break and hold above trendline
3. TP1: 2.54–2.60 (first redbox)
4. TP2: 2.65+ (next supply)
5. Stop: Below macro support = invalid
XRP/USDT UPDATE📢 XRP/USDT UPDATE
Trade idea played out nicely ✅
🔼 Entry: Around $2.35
🏁 Exit: $2.45 — I'm out!
Secured clean profits before resistance zone ⚡
paid members only access
Sometimes the best move is knowing when to exit 🧠
More setups on the way — Follow for sniper trades 🎯
#XRP #CryptoTrading #Altcoins #Binance #TA
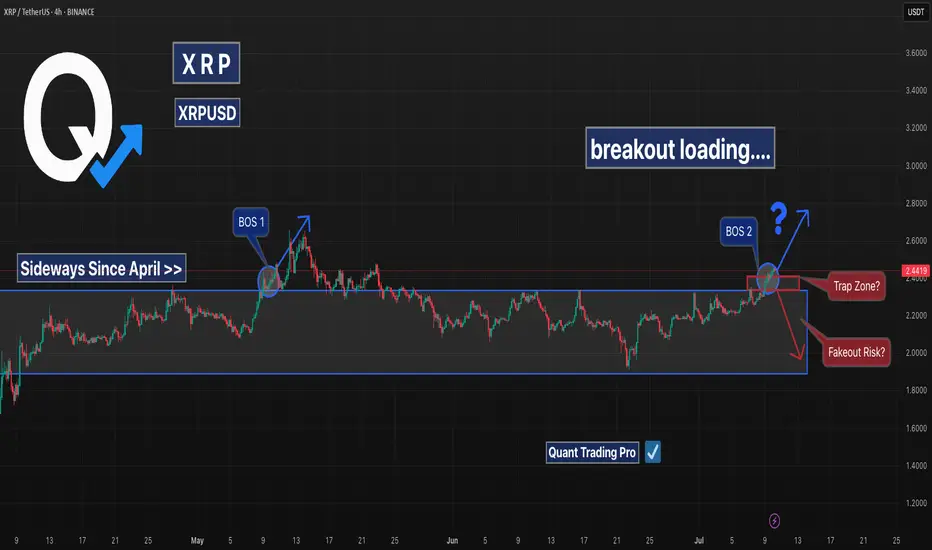
XRP Breakout Loading… or Just Another Trap?XRP has been locked in a sideways range since early April, bouncing between $1.90 and $2.45 for nearly 3 months.
Now, it’s pressing into the top of that range once again — and traders are watching closely for either a confirmed breakout or another fakeout rejection.
📊 Technical Breakdown:
🔹 Sideways Since April: The structure has been consolidative and indecisive.
🔹 BOS 1 + BOS 2: Each break of structure led to temporary rallies — but failed to hold above resistance.
🔹 Trap Zone Identified: ~$2.45–$2.50 has repeatedly acted as a liquidity magnet.
🔹 Fakeout Risk Still Present: Without strong follow-through, this could reverse into the range again.
📈 Breakout Scenario:
• Clean candle close above ~$2.50
• Targets: $2.90 and $3.20
• Look for volume confirmation
📉 Rejection Scenario:
• Wick into resistance + bearish engulfing
• Back to midrange or support zone ~$2.10
XRP Support Holds After Being Tested 12 Times...Everything below $2 is quickly bought. No crash is good news. Not having bearish action and bearish follow up on sellers pressure is bullish. XRP is bullish and has been consolidating for months. The longer XRP trades above $2, the stronger will be the bullish wave that follows. We are getting very close.
Good evening (morning) my fellow Cryptocurrency trader, I hope you are having a nice day.
The same level has been tested over and over and over since December 2024 and it continues to hold. XRP managed to wick below $2 more than twelve times, this support continues to hold. When prices move lower, buyers quickly show up.
Look at this, before 7-April XRP was moving below $2 very often. After 7-April, only twice. Big difference. This reveals a bullish bias. When the market was bearish, this support was tested more often than not. As soon as XRP turned bullish, it was tested only once recently and once after the 7-April bottom.
This little dynamic here shows that the bulls have the upper-hand and this is all we need to know. Knowing that the bulls have the advantage, when the market breaks it is going to break up. A bullish continuation. It is confirmed and it is only a matter of time.
How long? Only the market knows but it is not far away. The longer it takes, the stronger the bullish wave that follows. Strong growth is likely to develop within days.
Namaste.

XRP | Bearish Divergence Emerging Despite Price SpikeXRP has seen a 4% price spike over the past seven days, but under the surface, momentum is showing signs of weakness.
The Chaikin Money Flow (CMF) indicator has been trending downward, currently sitting at 0.02 and threatening to dip below the crucial zero line. This forms a bearish divergence—where price continues to rise while buying pressure fades.
The CMF, which gauges the strength of capital inflows and outflows, turns bearish when it falls below zero, signaling distribution and declining investor confidence. Although XRP’s CMF hasn’t crossed into negative territory just yet, the downtrend suggests weakening accumulation.
If this trend persists and fresh demand fails to step in, a bearish reversal could be on the horizon. Traders should keep a close eye on CMF behavior over the coming sessions.
Ask ChatGPT

HolderStat┆XRPUSD forms an ascending structureBINANCE:XRPUSDT is forming a stair-step bullish pattern after breaking out of consolidation above 2.12. The current trajectory suggests continued movement toward 2.70, with multiple support bounces validating the structure. Price action remains favorable for bulls.
