Pair: XRP/USDTSession: NY Open
Framework: Smart Money Concepts x Goldbach Precision
Swept the Asia Low — textbook liquidity grab.
Price retraced perfectly into a Goldbach Fair Value Gap (FVG) following the sweep, aligning beautifully with Smart Money logic.
This setup confirms internal liquidity was cleared and we're now respecting a high-probability demand zone.
The confluence of the Goldbach FVG + accumulation range + OB is giving this long position serious weight.
Holding the 2.0767 entry, with stop loss tight below the sweep at 2.0669, targeting the high-efficiency zone above at 2.19.
12:1 RR still in play. Now we wait for structure to shift and price to deliver.
Stay sharp — premium is ahead.
XRPUSDT.PS trade ideas

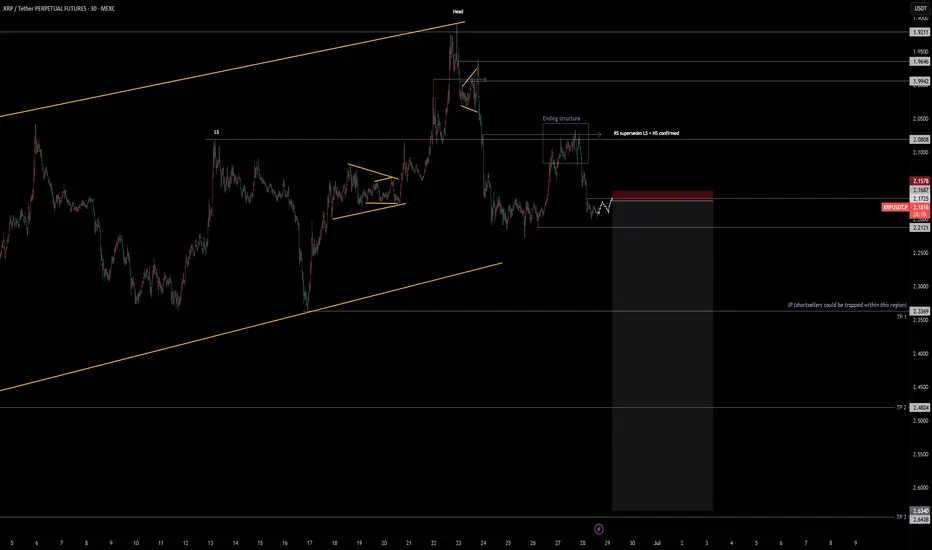
XRP: The Next WaveHi traders,
In previous videos, I covered both LTF and HTF targets for BTC and ETH — everything is unfolding as expected. I'm now spotting growing opportunities on XRP, which is also reflected in the XRP/BTC chart.
Price action has respected a key volume area (VA), and the Head & Shoulders pattern is playing out nicely — each inflection point is being taken out. I'm patiently waiting for a potential LTF flag (correction) to form.
Although I normally avoid taking partials due to this being a swing idea — and considering swap fees on CFDs — I’m securing partial profits at each target.
I’ll be releasing a video soon to break everything down in full detail.
Onwards gang!
CRYPTO:XRPUSD BINANCE:XRPBTC
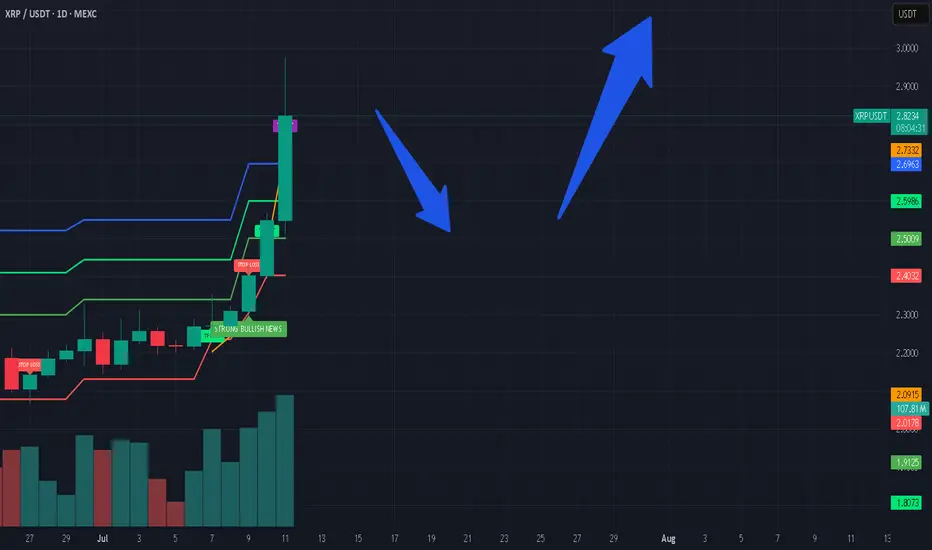
XRPUSDTHi snipers. The price of XRP has reached the channel ceiling on the one-day time frame and has also broken the black line, which is the 103-day moving average. The RSI is also in the neutral zone. As the price crosses the channel ceiling, expect significant price growth along with positive news. This is not a trading offer. I am learning and practicing. Good luck.

XRP - Next Upside Price TargetsPlease Refer to our last post:
After we go the first confirmation of the breakout as outlined in the previous post we have now blown through the second confirmation. Instead of the retest we got a break of the LTF high starting an upwards trajectory.
Now price is fighting the 0.786 right around the psychological $3 level. If we are able to hold above the 0.618 ($2.70) and continue our rise past $3. Most likely price will rapidly increase to the yellow dotted line around $3.30 with our high only being $0.10 above that.

XRP is making moves!Will it break $3, or drop back to $2? Previous Cycles showed that a correction might be next in line for the crypto market as a whole. Which means, if it happens, altcoins will get affected a lot...Do not get shaken out, after the correction expect a huge rally, but for now...it might be a perfect point to secure some profit.
Not investment advice.
#xrp #bitcoin #crypto #short #analysis
Xrpusdt 4hr time frame bullish iH&SComing from bearish 1st tp area (fib 1.217) from our previous bearish activated pattern " " and now invalidated is a bullish strong move on my POV, as the majority of shorters are taking their profit at the nearest support as sign of fear making a new trend and now formed a bullish ih&s pattern.
Targets are 2.45, 2.6 and 2.8. currently trading above 100 and 200 daily ma which is sign of good bullish move.
Pattern invalidation if closes below 2.15.


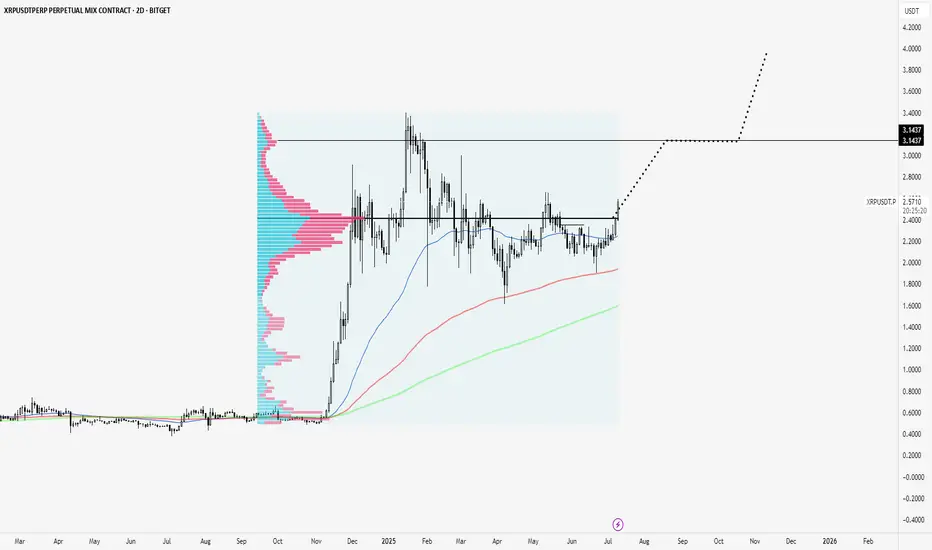
XRP clears Point of Control to test highs.XRP is breaking out of a consolidation zone and above a volume point of control that has been massive since its November rally onward.
Looks like next node is to $3.14
Super strong coin.
Ripple testimony in banking committee yesterday was bullish. Ripple partnering with BNY Melon yesterday was bullish. Ripple leading regulation standards with their XRP case is bullish. Ripple winning the status of XRP as one of a kind is bullish. Ripple getting a bank charter and fed master account is bullish.
Not much is close to XRP fundamentally.
XRP COIN NEXT VIEW Good Day 🌞 Folks i hope all of you are earning well 🥰
Am Still holding my #Xrp🔥🔥 CRYPTOCAP:XRP my next week View on Xrp price soon will jump above $3 so am just holding as of now ❣️🙏🏻 let's see what's next ✌🏻 those who are holding will get great 😃 opportunity to succeed. In below 👇🏻 mentioned chart 📉 you can see my holding trade still waiting for another Rocket 🚀 #xrp

XRP - How they gonna know? They gonna know!Huuuhh XRP blind longs eh? But yeah you can but if i was I wouldn;t

XRP/USDT: Is Ripple Gearing Up for a Breakout?XRP/USDT charts highlight a tightening price structure that hints at a possible breakout. With regulatory clarity emerging and XRP adoption increasing, traders are watching closely. This analysis explores the technical outlook for XRP, including trendlines, support-resistance zones, RSI signals, and volume metrics that may signal XRP’s next major move.
Current Market Structure (as of July 2025)
Price: ~$0.63
Resistance: $0.68 – $0.72 (multi-week rejection zone)
Support: $0.56 – $0.58
Trend: Short-term consolidation in a symmetrical triangle
Volume: Declining, suggesting a pre-breakout phase
On the daily chart, XRP is forming a symmetrical triangle pattern, a classic consolidation setup that often leads to a breakout when accompanied by rising volume. The lower highs and higher lows indicate price compression near the apex.
Technical Indicators to Watch
RSI (Relative Strength Index): Currently near 50 on the daily chart—neutral territory. A move above 60 could suggest bullish momentum building.
MACD (Moving Average Convergence Divergence): Flat, but showing signs of a potential bullish crossover on the 12H chart. A crossover above the zero line would further support bullish continuation.
Volume Profile: Volume declining during consolidation = textbook pattern before a volatility spike.
Look for a volume spike + breakout candle above $0.68 for confirmation.
🔍 Key Resistance & Support Levels
Level Role Reason
$0.72 Major Resistance Previous swing high, rejected 3 times since April 2025
$0.63 Pivot Level Midpoint of the range, near trendline resistance
$0.58 Key Support Base of recent bounce; trendline support
🚀 Bullish Breakout Scenario
If XRP breaks and closes above $0.72 with volume, the next upside targets could be:
$0.84 – Minor resistance from September 2023.
$1.00 psychological level – A key round-number target.
$1.25–$1.40 – Fib extension from the $0.42–$0.72 range.
A move toward these levels could signal the start of a new macro uptrend, especially if fueled by news (e.g., exchange relistings, Ripple partnerships, or legal clarity).
🧨 Bearish Rejection Scenario
Failure to break $0.68–$0.72 could result in a pullback to:
$0.58 support
If broken, next major level = $0.50
Watch for increasing bearish volume on rejection to confirm weakness.
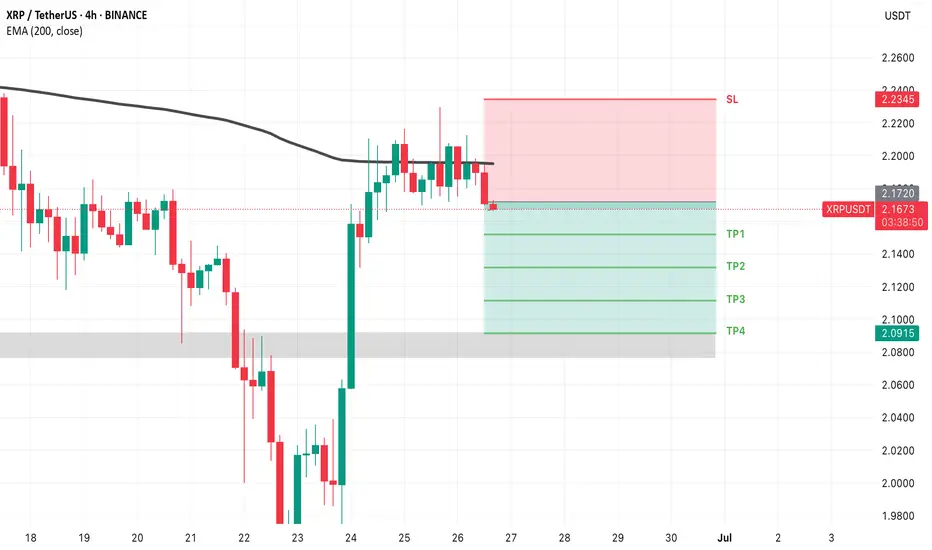
XRP LONG
I am thinking of a couple of days swing trade.
I am waiting for a long breakout in the sideways channel near the previous highs with TP1 and SL drawn IN. TP2 is at the top of the sideways trend channel.

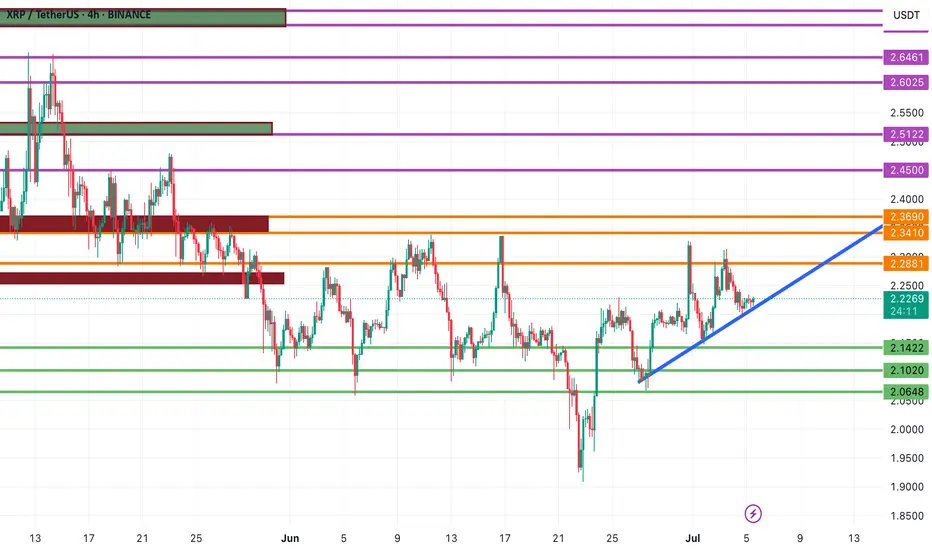
XRPUSDT Technical Analysis – Ripple at a Key Decision Point!🚀 XRPUSDT Technical Analysis – Ripple at a Key Decision Point!
As expected from our previous analysis, XRP has respected the bullish structure and is now hovering right on its ascending trendline. If the price holds this level and confirms bullish signals, a strong upside move may follow.
🔹 Upside Targets:
Key resistance levels to watch are 2.3410 and 2.3690. A breakout above these zones could push XRP toward 2.4500 and then 2.5122.
🔻 Bearish Scenario:
If the trendline breaks down, XRP may revisit previous support zones at 2.1778, 2.1422, and possibly 2.1020.
🎯 Stay tuned for updates – we deliver precise and strategic charts to help you stay ahead of the market.
👉 Follow for real-time crypto insights and smart trading setups!
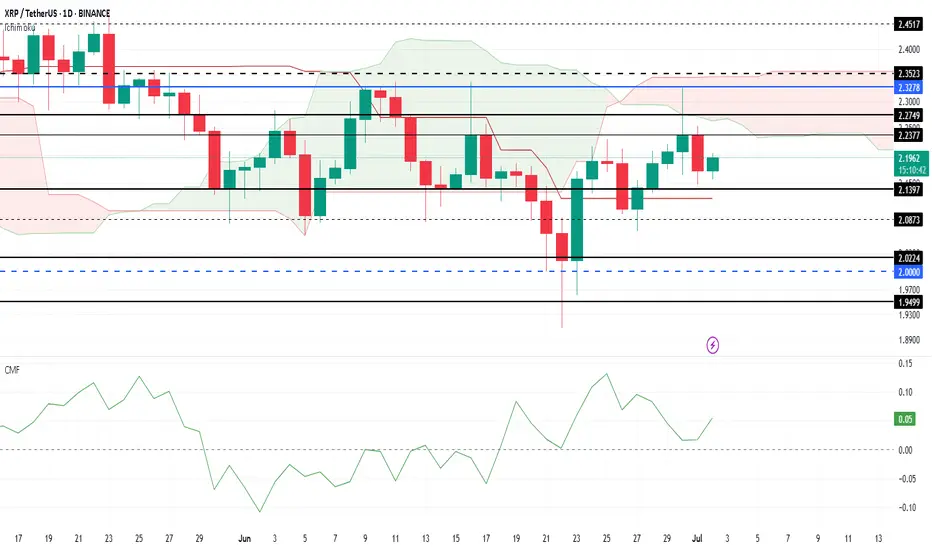
XRP Price Today: Rising Outflows Hinder RecoveryXRP has experienced notable volatility throughout June, with the altcoin failing to break through the $2.32 resistance level. Despite multiple attempts, XRP remains consolidated below this critical price point.
This price action indicates a lack of bullish momentum in the short term, making further gains challenging unless the resistance is breached.
The Ichimoku Cloud is turning negative , suggesting that bearish momentum could intensify for XRP. With the cloud positioned above the candlesticks, it signals further pressure on the price.
Additionally, rising outflows are visible on the CMF, as the indicator moves closer to the zero line, adding to the negative outlook.
If selling pressure continues to mount, XRP could fall below its support at $2.13 , potentially slipping to $2.02. This would mark a significant decline and invalidate the bullish thesis, signaling that XRP’s upward momentum could be at risk in the near future.

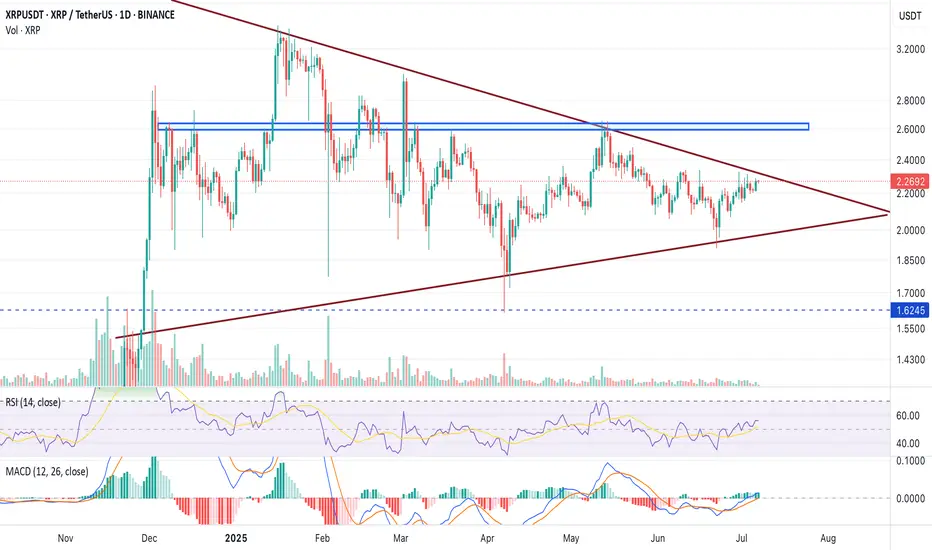
HolderStat┆XRPUSD before retest of the $2 levelBINANCE:XRPUSDT has rebounded from its 2.08 base and broken out of consolidation, aiming for the upper diagonal resistance near 2.40–2.60. With recurring bullish patterns and a history of strong follow-through after similar setups, momentum may build if 2.20 is cleared.

XRP is preparing to break through supportXRPUSDT is not yet ready for growth.
The important support level is 2.081. The price cannot stray far from it and has been attacking it for several hours amid a locally weak market.
Scenario: Consolidation with price compression towards 2.081. (descending triangle)
A breakout of support could lead to a decline.
Two targets: 2.032, 1.984

HolderStat┆XRPUSD consolidation of the assetBINANCE:XRPUSDT has bounced from the 2.02 level and is approaching the upper edge of a large consolidation structure. Multiple prior consolidation zones have led to breakouts, and the current bounce hints at continuation toward 2.30. A clean close above resistance would confirm bullish intent.

XRP Bears Ready to Feast? Short Setup Targets $1.93 With 1.6:1RROn the XRPUSDT 4-hour chart, price action shows a clear rejection of higher levels and a transition to a bearish tone. After rallying up toward the 2.19–2.18 USDT resistance zone, XRP failed to sustain momentum and rolled over sharply. The Supertrend indicator flipped to red, signaling renewed selling pressure.
Currently, the market is retesting the 2.09–2.10 USDT zone, which previously acted as strong support but is now functioning as resistance. This is a classic bearish retest structure, often confirming further downside if price fails to reclaim the level decisively. Beneath the current price, the most significant support area rests near 1.93 USDT, where buyers previously defended with strong volume.
This backdrop supports a short-biased trade setup. The ideal entry would be around 2.09–2.10 USDT, where the market is testing the broken support as resistance. The stop loss should be positioned just above the prior swing high and the top of Resistance Level 2, at 2.19 USDT. If the rejection holds, the take profit target aligns with the clear structural support around 1.93 USDT. This setup offers a risk of roughly 0.10 per XRP and a potential reward of about 0.16, maintaining a sound risk-reward profile near 1.6:1.
While a bullish reversal is possible if XRP can reclaim 2.19 USDT on a strong daily close, current price action and trend signals favor sellers in the near term.

XRP - Do you want to slurp?Yeah who doesnt wants to slurp profits? I shall say the move down shall be taken first before the formation of the pattern to work in accordance with the moves! Hope its understood

XRP UG-ah-LYXRP has been slowly chopping lower in a mess of overlapping candles. Lower highs and lower lows at the Highest degree. The trend is down and the Elliott Is ugly.
There is a chance here for the trend to shift, but that low needs to hold.
In Elliott Wave, ugly can be useful. An ugly pattern often screams correction. That is the working assumption right now. This structure could still be a complex wave four.
Even though the wave count has not been crystal clear, I am not flying blind. I am using support and resistance to track the structure and wait for clarity.
Here are the levels that matter right now:
3.4005 was the major high
3.0257 and 2.2762 are key reaction zones
2.6510 is the median and the first major line bulls need to beat
1.9736 is the old high that price continues to bounce from
1.9015 and 1.5267 are the potential downside reaction zones if the yellow path unfolds
If this is a correction, there is still potential to hold above 1.62 and send. If that level goes, the structure shifts fast to lower targets.
This is not the time to get brave without confirmation, mo.
Ugly price action can still resolve cleanly. But I want to see an impulsive move through one of these levels, followed by a corrective return to that level. That would offer a more ideal continuation in whichever direction price decides.
Let the level reactions speak first. I will act after.

HolderStat┆XRPUSD held the supportBINANCE:XRPUSDT on the 16h chart is showing strength above $2.05 after breaking out from consolidation. The path is clear toward $2.30 and $2.60 as buyers regain control. The bullish pattern sequence continues to develop.

XRP SHORT TRADE SETUPXRP/USDT is currently holding at a strong resistance zone, with a high probability of an downward price move. Also 200 EMA acting as a strong resistance .