Whales Wrote the Rules stop your imagination and Lose more Is it true that whales control the charts, or is it just another trading myth?
Why does everything look perfect—until the exact opposite happens?
This analysis reveals how smart money traps retail traders in plain sight.
Hello✌
Spend 3 minutes ⏰ reading this educational material.
🎯 Analytical Insight on XRP:
XRP is showing classic signs of compression, resembling a tightly wound spring ready to release. Momentum is building, and a breakout appears imminent based on current price structure and volume behavior 📈. While my long-term outlook remains significantly bullish, this setup suggests a conservative upside of at least 18%, with a key target in focus at $2.70 🚀.
Now , let's dive into the educational section,
📊 TradingView Tools to Track Whale Behavior
One of the most powerful truths in trading is this:
Smart money always leaves a trace—you just need to know where and how to look. TradingView provides some powerful tools to help you identify those footprints.
Volume Profile (Fixed Range / Session Volume): Use this tool to spot where the most volume was traded in specific ranges. These high-volume areas often signal zones where whales have entered or exited positions.
Smart Money Concepts / Order Blocks : Now natively available in TradingView for Pro+ and Premium plans, these highlight potential manipulation zones, institutional footprints, and key support/resistance levels.
Liquidity Zones: Use custom indicators like Liquidity Pools Detector or combine ATR with price structure to visualize high-risk/high-reward zones—whales love ambushing retail here.
Practical Tip:
Open the Bitcoin chart. Apply the Volume Profile Fixed Range tool across a two-week range. Look for areas with the highest volume concentration—these are likely whale action zones. Now overlay the Order Block indicator. You’ll often find those zones overlap.
🧠 Understanding Whale Behavior
Whales typically act when the crowd is at extreme fear or greed.
They move against the market’s emotional wave—and to do that, they need to mislead the herd. They create setups that look obvious but are designed to trap.
🐟 How Retail Traders Get Hunted
Here’s the classic trap:
The market makes a fake drop → panic selling → retail goes short.
Then whales step in, absorb liquidity, push price up → retail goes long too late.
Finally, whales dump at the top, and price collapses again.
🔄 Whale Playbook: The Four Phases
Silent Accumulation
Fake Breakout Pump
Distribution During Peak Greed
Dump + Liquidity Grab
You’ll find this playbook hidden in plain sight—if you stop chasing noise and start tracking volume, liquidity, and sentiment.
⚠️ Why Retail Always Ends Up on the Wrong Side
Because they’re looking for confirmation, not truth.
Whales exploit this—chart patterns, indicators, and fake breakouts are all part of the trap.
You need more than candles—you need context.
🔍 Chart Patterns or Psychological Traps?
Patterns like Head & Shoulders, Wyckoff Phases, or Triangles?
Whales know you’re watching them. They use these patterns as bait.
Unless combined with volume confirmation and liquidity context, most patterns are psychological illusions.
🧭 How to Follow the Smart Money
Study candle behavior with volume (Volume Spread Analysis)
Drop to lower timeframes to confirm liquidity zones
Use Anchored VWAP from major pivot highs/lows
Watch for divergence between price and volume—especially at highs/lows
💡 Conclusion:
There’s no holy grail in trading—but if you start thinking like a whale instead of chasing them, you’ll stop being the bait.
Use TradingView’s institutional-level tools to decode real market intentions.
Next time you spot a "perfect breakout," ask: who's on the other side of this trade—and why?
always conduct your own research before making investment decisions. That being said, please take note of the disclaimer section at the bottom of each post for further details 📜✅.
Give me some energy !!
✨We invest countless hours researching opportunities and crafting valuable ideas. Your support means the world to us! If you have any questions, feel free to drop them in the comment box.
Cheers, Mad Whale. 🐋
XRPUSDT trade ideas

XRP Ready for PUMP or what ?Ripple has successfully broken out of the falling wedge pattern and retested the breakout zone,the price is holding firmly above previous resistance, which now acts as strong support.
Continued strength could lead to upward movement toward targets at $2.65, $2.95, and $3.35
Stay Awesome , CobraVanguard

XRP Eyes Breakout Toward $2.92 – Channel Structure Holds
CRYPTOCAP:XRP is currently trading inside a rising channel and holding the midline support around the 0.618 Fibonacci level. This zone has acted as a launchpad in the past and could again support a strong upward move.
✅ Structure: Bullish channel
🧠 Key Support: ~$2.18–$2.22 (aligned with 0.618–0.786 Fib levels)
📍 Trigger: Bullish continuation from this zone confirms trend resumption.
🎯 Target: $2.9206
This is the projected move based on the height of the channel structure.
Watch for volume confirmation on the bounce — the setup remains valid as long as XRP stays above key support.

XRP $4.5 Followed by $6.29 Target ConfirmedThere is a small support zone around $2.30 that has been tested and retested since 17-May, it holds and it is now confirmed. You can truly hit the gas now, go all-in on XRP. I say this because the next advance (higher high) is about to get started in the coming hours and days. The full advance of course can take weeks or months to develop but the low entry prices and the buy-zone can be available only for a few more hours, maximum a day or two, before it is gone. I don't believe it will last days but we are still here today.
If the bears had the strength to move the market lower they had 10 days to do so, they failed. A bearish failure is a bullish success.
This is just a friendly reminder because I know you love XRP and I am happy to give you post/charts with great entry price and timing. A high probability of success.
There is no doubt in mind, 100% certain. XRPUSDT is set to grow next.
Thank you for reading.
If you agree follow & boost.
If you agree strongly leave a comment, just a few seconds of your time and it makes a difference. Share, how long have you been holding for? Did you manage to join the previous wave in late 2024? What about the buy zone in early April?
It is never too late, the market always gives a second chance.
This is the third one. The time is right and the time is ripe.
Prepare for financial success. Profits.
Namaste.

XRP Is Quiet—But This Calm Is Deceptive!Yello Paradisers—have you noticed how #XRP isn't on anyone’s radar right now? It’s not trending, no one’s hyping it, and to many, it’s just another slow mover. But here’s the thing: this type of silence often comes before the real storm, and the technical are quietly lining up.
💎#XRPUSDT is seeing now a period of consolidation The 1D bullish trend structure has been broken, and since then, price has entered into a tightening consolidation phase. While this may seem like indecision, it’s more likely a preparation for a potential high-probability upside expansion.
💎Price is now hovering just above the 0.786 Fibonacci level (~$2.25), which has started acting as a soft support. This is not a level to blindly trust, but one to monitor for reactions. If price manages to hold here, the next high-probability target lies at the short-term resistance around $2.5917, followed by major resistance at $2.9480, which aligns with a broader liquidity zone.
💎One key factor to keep in mind: the descending trendline liquidity has not been swept for a long time. That uncollected liquidity still sits just overhead, and markets usually don’t leave such inefficiencies behind forever. A spike toward that zone becomes increasingly probable the longer we range here.
💎At the same time, the MTF EMA on the daily chart is acting as a soft dynamic resistance, pushing the price down gradually. This setup increases the probability that we may see another touch of the 0.786 level. If that fails to hold decisively, the next likely area of interest will be the major support zone around $2.00.
💎Still, that major support remains unbroken and continues to act as a probability-backed structure for potential bullish defense. Until we get a clean daily candle close below $1.791 (invalidation level), this entire zone remains technically favorable for a potential reversal or liquidity sweep to the upside.
We are playing it safe right now, Paradisers. If you want to be consistently profitable, you need to be extremely patient and always wait only for the best, highest probability trading opportunities.
MyCryptoParadise
iFeel the success🌴

XRP Approaching Key Support – Critical Level to HoldXRP is nearing a significant support zone, marked by the monthly level at $2.09. This level has considerable structural importance and has acted as a pivotal point in the past. Holding this area is essential for maintaining the broader bullish market structure, which remains intact despite the recent correction
From a technical standpoint, the current move appears to be a corrective phase rather than a structural breakdown. A bullish retest of the $2.09 level is expected to attract demand, potentially serving as a launching point for a renewed upward move. Adding to the strength of this zone is the presence of the value area low, which provides further confluence and supports the argument for a strong demand zone.
Should XRP successfully defend this level, attention will shift to the next major resistance at $2.40, which represents a key weekly support/resistance (SR) flip. This level has served as an inflection point in the past and now stands as the most immediate hurdle for bulls. A clean break and close above $2.40 would confirm the continuation of the bullish trend and likely bring the all-time high back into play as the next major upside target.
In summary, XRP’s technical outlook remains bullish as long as it holds above the $2.09 monthly support. The confluence with the value area low enhances the probability of a bounce from this zone. A successful defense here and a push through the $2.40 weekly SR could trigger a renewed rally, targeting higher levels. This area marks a buy-the-dip opportunity for traders aligning with the macro trend, provided support holds firmly.

XRP's Correction Might Not Be OverIt looks like XRPUSDT can recover any minute now but the correction might not be over.
Good morning my fellow Cryptocurrency trader, what an unpredictable market we have today.
The action has been bearish since 12-May and bearish momentum continues to grow. It seems the bearish action is stopping now but XRP has not reached support. While a recovery can happen any day, the signals are bearish and we have three consecutive days the action being red, plus more than two weeks seeing lower prices.
We are bullish long-term but short-term anything can happen.
Bearish volume is very, very low which means that the down-move has no strength. How much lower can it go? Always a higher low because XRP will continue to grow long-term.
The correction might not be over.
Namaste.

XRP 5X Lev. Full PREMIUM Trade-Numbers (PP: 1380%)Good afternoon my fellow Cryptocurrency trader, this is a great weekend and a wonderful day.
The bullish bias for XRP has been confirmed more than enough. It is time. The time is right and the time is ripe to go LONG.
I am publishing to give you full trade-numbers for you to enjoy.
This is a high probability chart setup.
I am wishing you success and great profits. Crypto is going up.
We are doing mid-leverage on this pair. We are going with 5X because the action is already moving. Earlier, we would go higher, but we like to keep risk moderate.
Full trade-numbers below:
_____
LONG XRPUSDT
Leverage: 5X
Current price: $2.15
Entry levels:
1) $2.18
2) $2.12
3) $2.05
4) $1.98
Targets:
1) $2.50
2) $3.02
3) $4.51
4) $6.29
5) $8.08
Stop-loss:
Close weekly below $1.95
Potential profits: 1380%
Capital allocation: 5%
_____
I am wishing you great profits and tons of success.
This is for advanced traders.
You decide how to secure profits, how to adapt to market conditions and how to trade.
You also decide your own level of risk. If you win, all the profits are yours.
If you lose, that's ok, the market offers endless opportunities and life goes on.
It is not about winning them all. It is about winning and growing.
Thanks a lot for your continued support.
Namaste.

Ripple Potential UpsidesHey Traders, in today's trading session we are monitoring XRP/USDT for a buying opportunity around 2.23 zone, Ripple is trading in an uptrend and currently is in a correction phase in which it is approaching the trend at 2.23 support and resistance area.
Trade safe, Joe.

Lingrid | XRPUSDT false Break Below Daily LowsThe price perfectly fulfilled my previous idea . BINANCE:XRPUSDT has rebounded from the lower boundary of the descending channel, forming a potential double bottom near $2.26. Price action suggests building momentum within a consolidation zone, with targets aligned at the $2.34 level just below trendline resistance. A higher low could set up a clean push toward the upper channel range. Watch for breakout signs above the blue line.
📈 Key Levels
Buy zone: $2.26–$2.28
Buy trigger: confirmation above $2.29
Target: $2.34
Sell trigger: breakdown below $2.26
💡 Risks
Rejection at trendline near $2.30 may stall upside
Failure to hold above $2.26 support shifts bias bearish
Weak volume on rebound could signal short-term fakeout
Traders, if you liked this idea or if you have your own opinion about it, write in the comments. I will be glad 👩💻

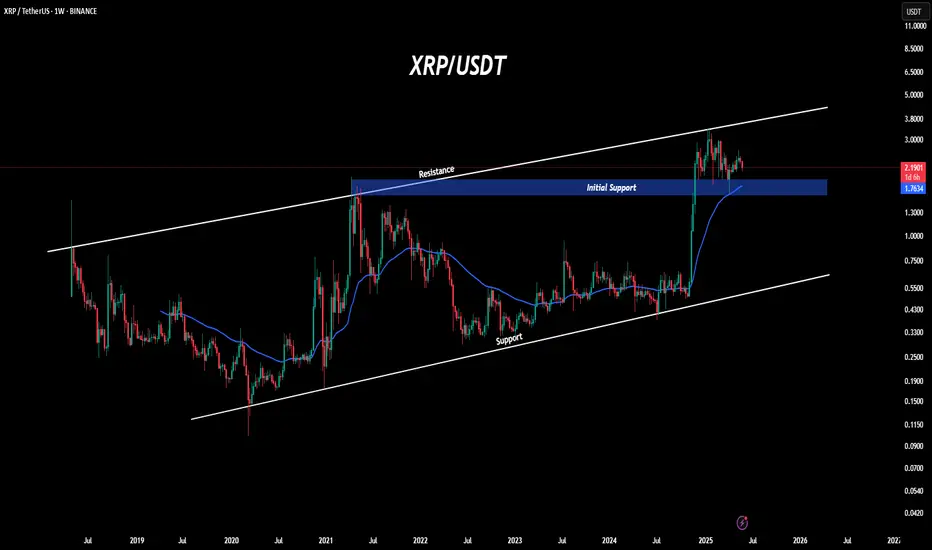
XRP UpdateXRP Weekly Timeframe Update
XRP is currently showing a rejection from the resistance trendline and is now hovering near a crucial support zone, ranging between $1.57 and $1.90. This level is significant as it marks the previous higher high. Additionally, the 50 EMA is providing extra support, from which XRP has already shown signs of a rebound.
Bullish Scenario:
If XRP continues to rebound from this zone, we could potentially see a new all-time high, with the price forming a double top pattern.
Bearish Scenario:
If XRP breaks down and closes below this key support, prepare for downside pressure.
That’s it from my end. Trade safely, and always do your own research and analysis before investing.
Regards,
Dexter
Where from here?Short closed.
I am looking for a long entry if XRP pushes below 2.33
2.30ish
Btc conference this week

XRP 5X Lev. Full PREMIUM Trade-Numbers —New Entry (PP: 815%)When the market is over-leveraged, when there are too many people out of control, you can feel a kind of tension; anxiety in the air... Sure enough, the market starts to shake and all these over-leveraged hands are removed. Once removed, the market becomes calm... Can you feel the calm? It is as if the gamblers are now gone.
Good morning my fellow Cryptocurrency trader, we have many charts, my leveraged trades, all green. We have second entries for BTC, ETH and ADA but none for XRP.
So, if you missed the first one, here is another one... It is risky, but the show must go on.
We are set to experience a very strong wave of growth. Getting in before the breakout can be live changing, just keep in mind that nothing is certain, leveraged trading is high risk. High risk vs a high potential for reward.
The signals here are not strong, but I believe we have very good timing, and if the timing is good, the price must also be.
_____
LONG XRPUSDT
Leverage: 5X
Entry levels:
1) $2.45
2) $2.35
3) $2.30
4) $2.26
5) $2.07
Targets:
1) $3.05
2) $3.40
3) $3.82
4) $4.08
5) $4.50
6) $5.18
7) $5.67
8) $6.29
Stop-loss:
Close weekly below $2.05
Potential profits: 815%
Capital allocation: 3%
_____
When the market calms down, it means that no more gamblers are around. When no more gamblers are around, the growth process can continue.
This is an unconventional signal, but you can't deny the change. One day, everybody is going wild, the next day, only the usual suspects remain.
When the market grows and moves to resistance, everybody wants to go LONG. When prices are low, people tend to detach and ignore. It is the other way around, sell at resistance and buy at support.
Time to go LONG.
Namaste.

Swing Trade OpportunityHello traders,
XRP is forming a potential falling wedge with strong upside potential. Price action has printed a middle section and is now consolidating at a high-value area. Despite the picture-perfect setup, the entry remains high-risk, as the consolidation could act as a continuation. However, XRP has been lagging recently, and positioning looks ideal for an upside move. The HTF structure shows a strong impulse followed by a correction; this could be the level where the next leg up begins.
I can afford to take the risk on this one. Wish y'all the best!

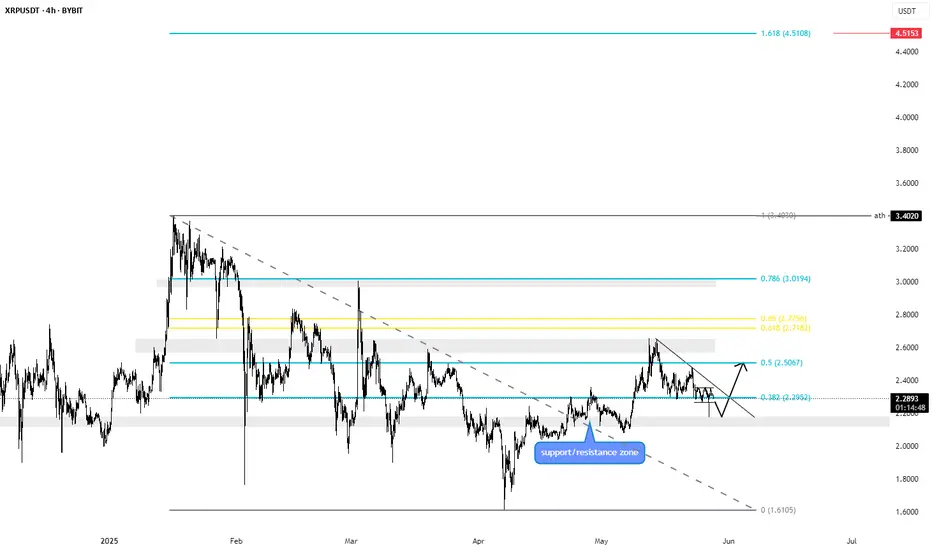
Short term bearisch on XRPXRP shows a triple top on the 4h chart which is a strong bearish pattern. If we are going to play this, this nicely matches the testing of a previous resistance/support zone. which we are now going to test again. If we manage to convert it into support and we break the trendline, the way is clear to the 1.618 fibbonachi level, which amounts to a value of approximately 4.5 usdt. www.tradingview.com www.tradingview.com
XRP is looking for a way outXRP has broken the April trend line, it has also found support temporarily.
I am watching as it has avoided a couple downward channels over this past weekend. Currently it is attempting to find a ride towards 2.35
If this channel doesn’t work for it we may see it ride the yellowish channel down towards 2.20
Btc conference this week. EU tariffs delayed. Macro event is what may be the catalyst to either side.
I am overall bullish and still DCAing.
Good luck this week

XRP's situation+ Target PredictionThe XRP is in a Bullish phase by a Falling Wedge Pattern.
A falling wedge indicates the potential for price to reach to $3.
Note if the Wedge Pattern is broken downwards with the strength of Bearish candles , this analysis of ours will be failed.
Give me some energy !!
✨We spend hours finding potential opportunities and writing useful ideas, we would be happy if you support us.
Best regards CobraVanguard.💚
_ _ _ _ __ _ _ _ _ _ _ _ _ _ _ _ _ _ _ _ _ _ _ _ _ _ _ _ _ _ _ _
✅Thank you, and for more ideas, hit ❤️Like❤️ and 🌟Follow🌟!
⚠️Things can change...
The markets are always changing and even with all these signals, the market changes tend to be strong and fast!!

Ripple is Approaching An Important ResistanceHey Traders, in today's trading session we are monitoring XRPUSDT for a selling opportunity around 2.25 zone, Ripple is trading in a downtrend and currently is in a correction phase in which it is approaching the trend at 2.25 support and resistance area.
Trade safe, Joe.

XRP - Time To Buy LongBINANCE:XRPUSDT is forming an ascending triangle pattern on the daily chart, indicating bullish momentum.
Price is currently around \$2.30, with key resistance at \$2.60.
A breakout above this level could lead to a move toward the \$3.40–\$3.47 zone.
Support levels are seen at \$2.22 and \$2.16, which may act as a bounce zone.
Invalidation of the setup lies below \$1.96, making it a well-defined risk.
Overall, the chart suggests a potential breakout with a favorable risk-to-reward setup

Ripple buy signalHello friends
Given the good growth we had, we entered a deep correction, and now we have the opportunity to buy step by step in the specified support areas with capital and risk management and move with it to the specified targets.
*Trade safely with us*

XRP/USDT Reversal Play: Bounce from Strong Demand Zone🔍 Chart Analysis:
🟫 Strong Supply Zone: The price has bounced perfectly off a strong demand zone (labeled "strong supply zone" in the chart, but likely intended to be demand), showing buyer interest near the $2.05–$2.12 range.
📉 Recent Downtrend: XRP recently experienced a sharp decline, but the price has now touched this critical zone, suggesting a potential bullish reversal.
🔁 Potential U-Shaped Recovery: A rounded reversal pattern is indicated with the red curve, aiming for a U-shaped recovery targeting higher resistance levels.
📊 EMA 70 (2.2932): Current price is trading below the EMA, which acts as a short-term resistance. A break above it would be bullish confirmation.
📌 1st Resistance: Around $2.2932, which aligns with the EMA. This is the first challenge for bulls.
📌 2nd Resistance: Near $2.40–$2.47, a critical barrier before long-term targets.
🎯 Long-Term Target: Set near $2.63, the peak from the previous rally, aligning with major resistance.
🕯 Volume: Decent volume spike at the bounce, confirming interest from buyers.
🧠 Trade Setup: Reversal from Strong Demand Zone
📍 Entry Zone:
🔹 Enter between $2.12 – $2.15 (ideal after confirming a bounce or bullish candle above the zone)
🛡️ Stop-Loss (SL):
🔻 Place below the demand zone — $2.05
(Protects from deeper downside if support breaks)
🎯 Take Profit (TP) Targets:
TP1 – $2.29 (🟦 1st Resistance / EMA 70)
🔸 Partial profit booking here; break-even SL for the rest
TP2 – $2.40 (🟦 2nd Resistance)
🔸 Major resistance zone; expect a reaction
TP3 – $2.63 (🔴 Long-term Target / Previous High)
🔸 Full target for position holders
📊 Risk/Reward Ratio:
Approximately 1:2.5 to 1:3.5, depending on entry
🔔 Extra Notes:
📈 Watch for bullish engulfing or hammer candle confirmation before entering.
🔄 If price fails to reclaim EMA 70, re-evaluate trade.
🧠 Manage position size properly — avoid over-leverage.
🔮 Summary:
XRP is attempting a bullish reversal from a key demand zone with potential to target $2.47 and even $2.63 long term, provided it clears resistance at $2.29 and $2.40. The setup favors swing traders and position holders looking for a recovery play.
💡 Strategy Tagline:
"Buy the bounce, trail the breakout, ride the reversal!" 🚀📈💹
support my idea and comment down your thoughts thanks .

are you miss Miracle ?! TradeWithMky on XRP MultyTimeWeekly time frame we are facing with a stronge bullish movement that we have passed
retrecement 61.8 started a great bullish movement so we can expect if price pass next resistance can touch a 6.00$ Xrp sooner than a centry
Consider that this is not a financial advice its My analysis about this chart !
@TradeWithMky Do you Want more and last analysis about ripple ? " Lets watch a miracle "
🔥 Live Trade Started .

Long (scalp) - XRPEntering a scalp long on XRP
BTC and XRP are the only 2 putting in HL, whereas ETH and SOL are making LLs...
In with small % risk!
