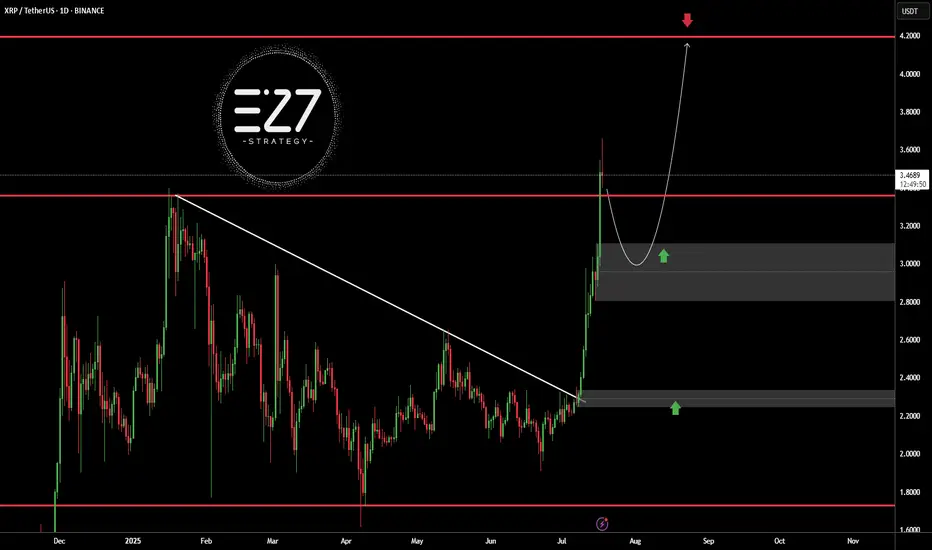
XRP Support Holds After Being Tested 12 Times...Everything below $2 is quickly bought. No crash is good news. Not having bearish action and bearish follow up on sellers pressure is bullish. XRP is bullish and has been consolidating for months. The longer XRP trades above $2, the stronger will be the bullish wave that follows. We are getting very close.
Good evening (morning) my fellow Cryptocurrency trader, I hope you are having a nice day.
The same level has been tested over and over and over since December 2024 and it continues to hold. XRP managed to wick below $2 more than twelve times, this support continues to hold. When prices move lower, buyers quickly show up.
Look at this, before 7-April XRP was moving below $2 very often. After 7-April, only twice. Big difference. This reveals a bullish bias. When the market was bearish, this support was tested more often than not. As soon as XRP turned bullish, it was tested only once recently and once after the 7-April bottom.
This little dynamic here shows that the bulls have the upper-hand and this is all we need to know. Knowing that the bulls have the advantage, when the market breaks it is going to break up. A bullish continuation. It is confirmed and it is only a matter of time.
How long? Only the market knows but it is not far away. The longer it takes, the stronger the bullish wave that follows. Strong growth is likely to develop within days.
Namaste.
XRPUSDT trade ideas

DeGRAM | XRPUSD continues to move in the channel📊 Technical Analysis
● Aggressive breakout from the 8-week green consolidation box has pierced both the purple ’23 trend-cap and inner wedge roof; pull-backs are holding above the prior 2.71 swing, confirming a fresh demand flip.
● Price is now tracking the mid-July parabolic support inside the black rising channel; the next confluence lies at the channel crest / Feb supply 3.11, implied by the 40¢ measured move of the July flag.
💡 Fundamental Analysis
● CME CF announced a cash-settled XRP reference rate for institutional derivatives, boosting open interest and signalling deeper liquidity ahead of the 23 Jul SEC status hearing.
✨ Summary
Long 2.70-2.80; hold above opens 2.88 → 3.11. Invalidate on a 6 h close below 2.60.
-------------------
Share your opinion in the comments and support the idea with a like. Thanks for your support!

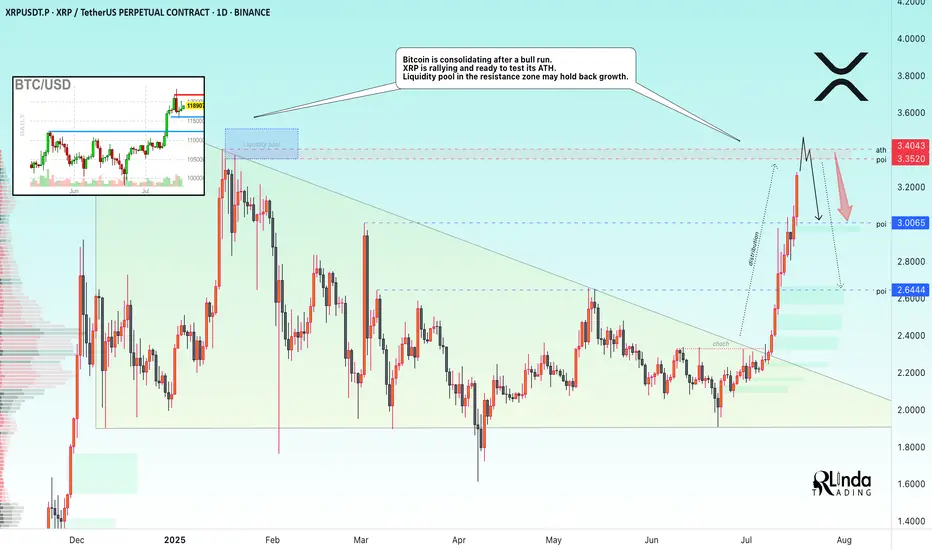
XRP → ATH retest. Reversal or continued growth?BINANCE:XRPUSDT.P is rallying and ready to test the resistance zone - ATH. Against this backdrop, Bitcoin is consolidating after a bull run. The liquidity pool may hold back growth.
Fundamentally, there is excitement across the entire cryptocurrency market. Altcoins are rallying after Bitcoin hit a new high and entered consolidation. The BTC.D index is declining, which generally provides a good opportunity for altcoins to grow. However, the index is approaching technical support, which may affect market sentiment overall...
As for XRP, there is a fairly strong liquidity pool ahead — the ATH resistance zone. The price is in a distribution phase after a change in character and a breakout of the downtrend resistance in the 2.33 zone. The momentum may exhaust its potential to break through the 3.35-3.34 zone, and growth may be halted for correction or reversal (in correlation with Bitcoin's dominance in the market).
Resistance levels: 3.35-3.40
Support levels: 3.0, 2.64
A breakout of resistance without the possibility of further growth, a return of the price below the level (i.e., inside the global flat) will confirm the fact of a false breakout of resistance, which may trigger a correction or even a reversal.
Best regards, R. Linda!
$XRP is ready for another big move! CRYPTOCAP:XRP is ready for another big move! 🚀
Resets will be a buying opportunity.
Keep an eye on it.

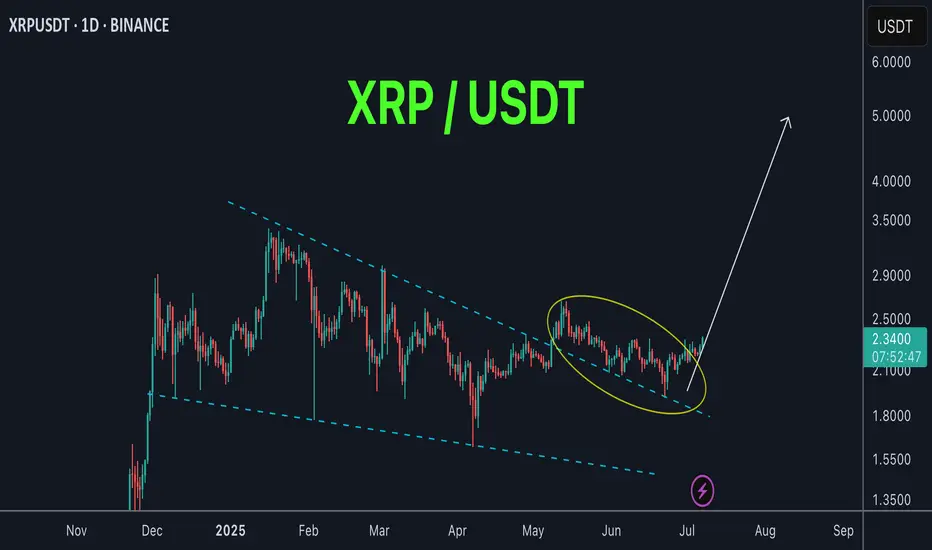
XRP new movement soon !XRP / USDT
XRP is on a long retest after breakout of accumulation zone weeks ago
successful retest here will result in strong bullish rally !
Keep an eye on it in the coming days 👀
XRP is heading toward $4 ┆ HolderStatBYBIT:XRPUSDT is testing $3.40 for the third time. A breakout targets $3.60, but rejection risks $3.10 fallback.

Comprehensive Analysis: SHORT Signal on XRPUSDT1. News Analysis (Market Sentiment)
The news actually reflects a strongly positive sentiment for XRP’s long-term fundamentals:
"Brazil's VERT Debuts Tokenized Credit Platform on XRP Ledger With $130M Issuance" : This is a very bullish piece of news. It highlights real-world adoption of the XRP Ledger (XRPL) for high-value transactions.
"VERT Launches Blockchain Platform on XRPL for $130M Deal" : This is the same news reported by a different source, confirming the significance of this adoption.
Bridging the Analysis:
Here lies the crucial difference between investors and traders. As long-term investors, this kind of news would motivate us to buy and hold XRP. But as day traders, we understand the common market behavior of “Buy the Rumor, Sell the News.”
The massive price rally before this announcement might indicate the market already anticipated this news. Now that the news is official, early buyers may begin taking profits, triggering selling pressure.
Sentiment Conclusion:
While the news is fundamentally positive, it could strengthen the case for a SHORT position in the short term. This “sell on good news” reaction is a common phenomenon in trading.
2. Technical Analysis (Chart Structure)
The daily chart of XRPUSDT supports a SHORT position even more convincingly:
Climactic Top Rejection : A sharp price rally ends with a long upper wick candle around the $3.60 area. This is a classic sign of buyer exhaustion and aggressive seller entry.
Short-Term Bearish Structure : A large red candle formed after the top, signaling that sellers have taken control. The current price is trading well below that top, confirming the rejection was valid.
Room for Correction : Below the current price, there’s a clear “gap” or market inefficiency. The first logical target for a correction is around $2.80 - $2.90, where the 50 EMA meets the upper edge of the Fair Value Gap (green box). This gives us a clean profit target.
Combined Conclusion:
Yes, based on a combination of “Sell the News” sentiment and clear bearish technical structure, the argument for a SHORT position on XRPUSDT is very valid. We are going against the positive headlines, but following price action signals.
Trading Plan: SHORT Operation on XRPUSDT
Position: SHORT
Asset: XRPUSDT (Perpetual Contract)
Current Status: ENTRY
Entry Reason:
We’re entering based on short-term bearish momentum after a strong rejection from the supply zone, expecting the price to fill the inefficiency below.
Entry Type: Market Order
Why: The bearish move is in progress. We want to catch it now before the price drops further and skips our limit order. We'll execute at the current market price (~$3.01).
Stop Loss (SL): $3.62
Why: Placed slightly above the previous swing high. If price breaks this level, our SHORT thesis is invalid, and we exit to prevent further losses.
Take Profit (TP) Targets & Risk/Reward:
We'll scale out profits in phases to lock in gains.
TP1: $2.85
Why: Confluence of 50 EMA and top of Fair Value Gap
Risk/Reward: ~1:2.8 (Risking $0.61 to gain $1.75 — very healthy ratio)
TP2: $2.55
Why: Mid-point of the Fair Value Gap — a common magnet for price
TP3: $2.25
Why: Full gap fill + retest of prior support/resistance area
TP4: $1.85
Why: Ambitious target — filling the second, deeper Fair Value Gap. Possible in a panic-driven selloff.
Position Management:
Once TP1 is hit:
Move SL to Entry ($3.01) to secure a risk-free trade on the remaining position.
We’ll continue to monitor the price and adjust the trailing stop loss as each TP level is reached.

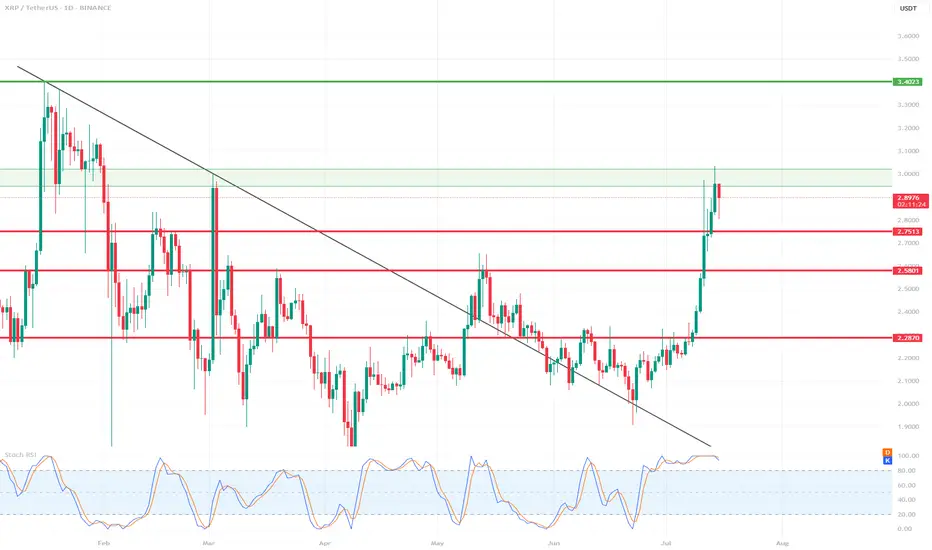
XRP 1D Chart Review📊 Support and Resistance Levels:
🔼 Resistance:
$2.95 - $3.02 – currently being tested, a local resistance zone. Price slightly rejected.
$3.40 – another strong resistance level from the previous high (visible on the left side of the chart).
🔽 Support:
$2.75 – the closest, recently broken support level.
$2.58 – another local support level.
$2.28–$2.30 – a very strong support zone that has been tested multiple times.
📈 Pattern and Momentum:
A breakout from a wedge-shaped downtrend with very high volume and long bullish candles indicates strong demand.
We are currently observing a correction/rejection at $3.02 – a possible short-term pullback.
🔄 Oscillator – Stochastic RSI:
The Stochastic RSI oscillator is in the overbought zone (near 100) – indicating possible consolidation or correction.
The curves are starting to curve downwards – a potential signal for a slight correction in the coming days.
🧠 Scenarios:
✅ Bullish (continued growth):
If the $2.95–$3.02 level is broken strongly and confirmed (e.g., by a daily candlestick closing above it), the target will be $3.40.
In this case, a quick rally to $3.40 is possible without major obstacles.
⚠️ Bearish (correction):
If the $3.02 zone holds as resistance, the price could retrace to $2.75 (the first local support).
If downward pressure persists, $2.58 could be tested.
📌 Summary:
XRP is in a strong uptrend after breaking out of long-term resistance.
In the short term, overbought prices on the Stoch RSI could trigger a correction to $2.75.
Key resistance: $3.02 – breaking it could signal further gains towards $3.40.
It's worth monitoring price reaction in this zone and candlestick confirmation.
DeGRAM | XRPUSD rolls back to support📊 Technical Analysis
● After spiking to 3.56 (red dot) price slipped into a shallow bull-flag that is holding on the grey inner trend-line and the broken purple 2-year cap, converting 2.86-3.00 into firm support.
● Volatility compression inside the flag sits midway of the rising channel; a 16 h close back above 3.22 activates a 1:1 continuation toward the median-line cluster at 3.80, with the outer rail still pointing to 4.00.
💡 Fundamental Analysis
● CME’s launch of micro-XRP futures and fresh US exchange relistings lifted open-interest 18 % w/w, while Coinglass shows $12 M shorts liquidated since Monday—evidence of renewed upside pressure.
✨ Summary
Buy 3.05-3.22; breakout over 3.22 aims 3.80 → 4.00. Invalidate on a 16 h close below 2.86.
-------------------
Share your opinion in the comments and support the idea with a like. Thanks for your support!

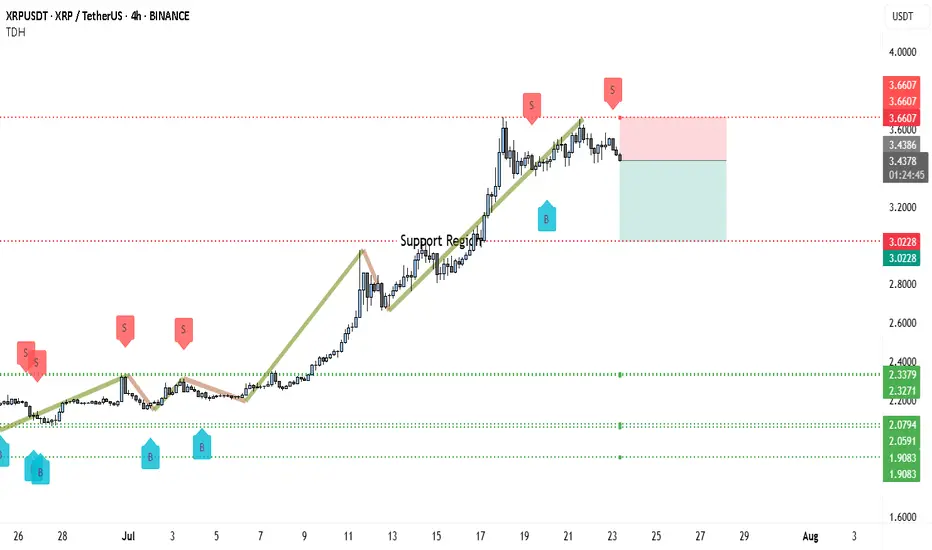
Is XRP About to Crash to $2.40? Charts Don’t LieXRP has been in a steady bullish run throughout July, but cracks are beginning to show. The price recently failed to hold above the key $3.66 resistance, and what once looked like a strong continuation setup now hints at exhaustion. Price action shows clear hesitation near the $3.60–$3.66 region, where multiple “Sell” (S) markers have emerged.
More importantly, the ascending trendline has been broken, and XRP is consolidating beneath it — often a sign of a shift in structure. A lower high has now formed, which could be the early warning of a short-term top.
If buyers can't reclaim the $3.43–$3.60 zone soon, XRP could enter a deeper pullback phase. The former support band between $3.02 and $3.05 is now being tested from below, and if this flips to resistance, further downside looks likely.
There’s a visible liquidity void below $3.00, and with XRP having rallied significantly, a retracement to retest deeper support zones wouldn’t be surprising. Areas like $2.80, $2.40, and even $2.00 are still untouched and could attract buying interest if panic kicks in.
📊 Trading Setup
• Entry (Sell): Around $3.43 (confirmed rejection)
• Stop Loss: Just above $3.66 (key resistance and invalidation zone)
• Target 1: $3.02 (minor support zone)
• Target 2: $2.40–$2.33 (stronger cluster with past reaction)
• Risk-to-Reward: Approx. 1:1.8 — favorable for swing short
The structure is now showing early signs of bearish reversal. The failure to break above $3.66, break of the trendline, and formation of a lower high all signal weakness. If XRP drops below $3.02 and holds there, it may trigger a more aggressive selloff toward mid-$2s. This short setup is valid as long as the price stays below $3.66 — beyond that, bulls might regain control.
Let me know if you want a continuation scenario or need this adapted for tweet threads or YouTube script.
Ripple (XRP/USDT) Analysis – 4H🚀 Ripple (XRP/USDT) Analysis – 4H
Hello everyone,
Today I want to analyze Ripple (XRP). I hope you find this analysis useful and share your thoughts in the comments.
The following analysis is based on MWC (4H).
📢 Quick Overview of Key Ripple News:
• $759M transfer by XRP whales, indicating heavy behind-the-scenes activity that could signal a major price move.
• This large transfer could be a sign of Accumulation or preparation for high volatility.
Our main focus to maintain the bullish scenario should be on btc.d and usdt.d charts.
♦️ Btc.d ♦️
After the heavy drop in the past week, Bitcoin dominance started correcting yesterday.
The levels I expect reactions from are:
61.31 (already broken),
Next levels 61.74 and 62.17 (currently testing).
A breakout and stabilization above these levels will put altcoins under strong selling pressure.
However, a rejection at these levels will bring attention to altcoins close to breaking their zones.
♦️ Usdt.d ♦️
This chart also shows signs of forming a bullish structure.
We need to watch for a reaction to the next important zone 4.44 – 4.36.
But for altcoins to continue their uptrend, 4.14 must break downward.
♦️ Others.d / Total / Total2 / Total3 ♦️
These charts are naturally bearish.
Before their support levels matter, we should focus on the potential reversal of btc.d and usdt.d.
These give earlier signals of correction continuation or completion.
We can use Total, Total2, Total3, and Others.d for confirmation.
Important levels:
Total: 3.91
Total2: 1.55
Total3: 1.08
Others.d: 8.05 (for now), but if the correction ends and a bullish move starts, we may see a lower high forming.
♦️ XRP ♦️
Currently, a breakout above 3.65 is the entry trigger.
The more likely bullish scenario: create a new high → minor correction → breakout = entry signal.
This will happen if Bitcoin dominance drops.
According to our strategy, both the market and XRP are in a bullish structure.
I will not consider short positions, even if XRP falls to 2.66.
Considering the strong seller activity at 3.65, I expect the breakout to be sharp and whale-driven.
Thus, there are two ways to enter:
1. After forming a new high and low, enter upon candle close and confirmation around 3.33.
2. If we miss the move, enter with a STOP BUY at 3.6.
In both cases, if the scenario is activated, Stop-Loss = 2.92.
🔥 If you found this analysis useful, hit the 🚀 and follow me for more updates!

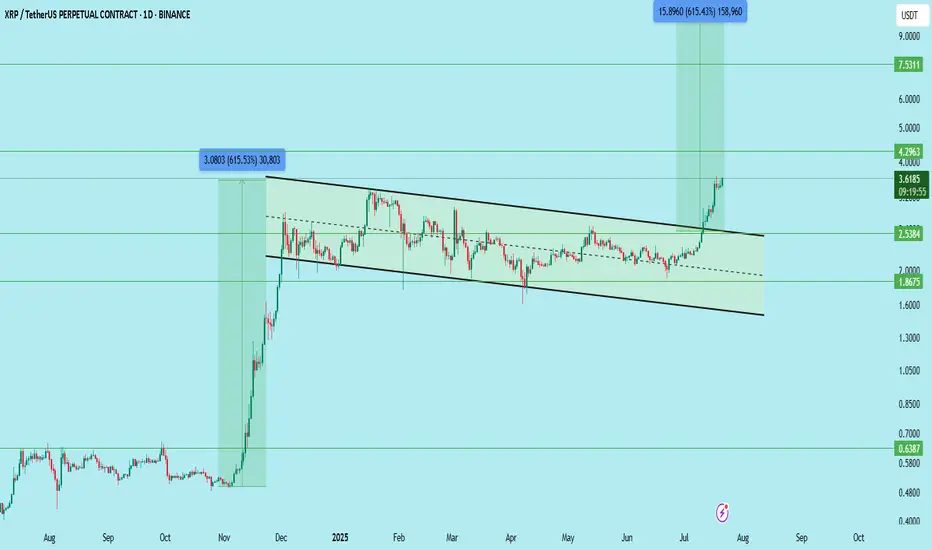
XRP Update | Long-Term Breakout In PlayCRYPTOCAP:XRP has successfully broken out of the descending channel and is currently approaching the key resistance zone at $4.29 — the first major long-term target shared earlier.
What’s next?
It’s now trading at a critical resistance, and a retest is highly likely. A clean pullback to the $3.51–$3.57 zone will offer the ideal entry opportunity for long-term positional traders.
Updated Trade Setup:
Entry: $3.51–$3.57 (wait for retest)
Stop Loss: Below $3.38
Support Zones: $2.53 / $3.51
Resistance Zones: $4.29 / $7.53 / $11.98 / $18.00
Targets:
TP1: $4.29 (nearly hit)
TP2: $7.53
TP3: $11.98
TP4: $18.00
This breakout structure remains highly bullish. Let price come to you — avoid chasing the move. A retest entry could offer better RR for the next leg.
DYOR | Not Financial Advice
XRP 4H – Critical Retest Zone + Golden Pocket BelowXRP is sitting right on its prior breakout zone after a clean rally and trendline break. This zone is acting as critical support — the same area that triggered the last explosive move. Bulls want to see a bounce here with momentum building again (Stoch RSI is curling from oversold).
If this level fails, price could retrace deeper into the Fibonacci golden pocket (2.57–2.78), where stronger demand is likely waiting. That confluence of fib levels and past consolidation makes it a high-interest area for potential long setups.
For now, this is a pivotal moment. Either we bounce here — or things get a lot more interesting below.
#XRP #CryptoAnalysis #FibonacciRetracement #GoldenPocket #BreakoutRetest #Altcoins #TechnicalAnalysis #QuantTradingPro

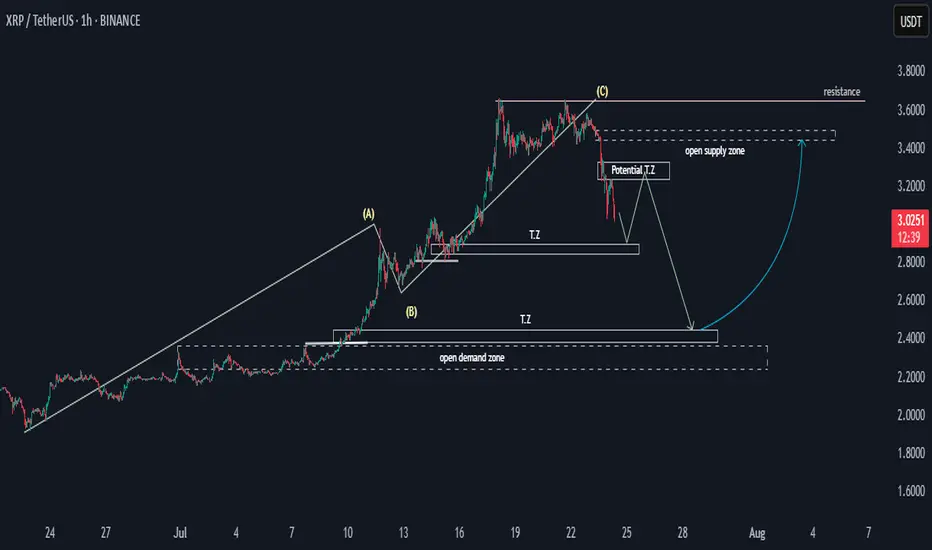
XRP Potential SND Flow MapHello,
This is a general overview of the XRPUSDT flow map, outlining potential price movements.
The price may experience a decline, followed by a pulse upwards before a final drop. Target zones have been identified, and following this, there is a possibility for the price to rally toward the 3.4 supply zone. This would establish the 2.4 to 2.2 range as a key potential bullish zone.
Happy Trading,
Khiwe.
Not trading advice
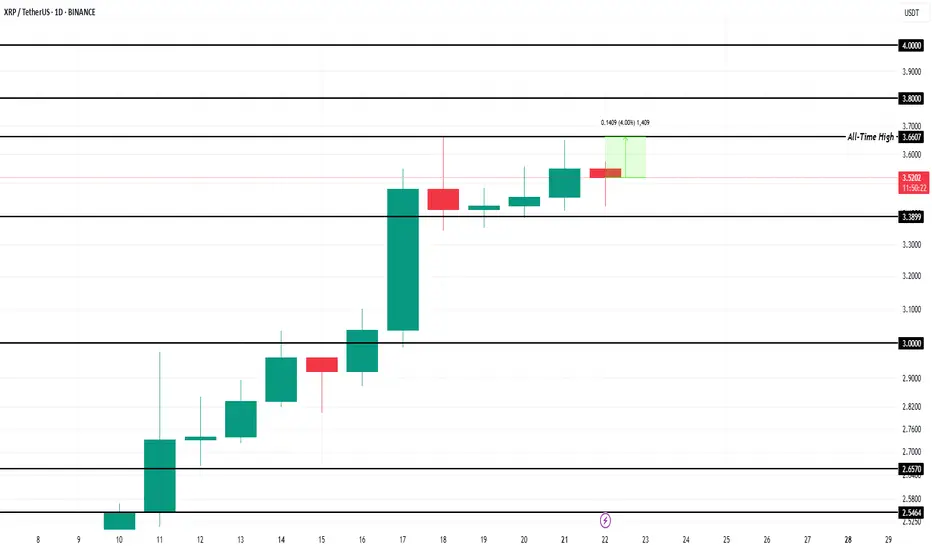
XRP Price Reversal Likely After $2.81 Billion Selling In 7 DaysBINANCE:XRPUSDT is currently trading at $3.48, only 4% away from its all-time high . Over the past week, exchange wallets saw an influx of nearly 450 million XRP, valued at more than $2.81 billion . This spike in supply indicates that holders are moving their assets to sell, usually a bearish indicator in market cycles.
Despite the proximity, BINANCE:XRPUSDT price is showing signs of weakness and is clinging to the $3.38 support level . Without renewed buying interest, this support may not hold much longer.
If investor selling continues, BINANCE:XRPUSDT could fall through $3.38 and test the $3.00 support . A drop to this level would erase the recent gains and confirm a near-term bearish reversal. The loss of $3.00 could signal a longer consolidation phase or deeper correction.
However, if market participants absorb the sold supply and restore demand, BINANCE:XRPUSDT could rebound quickly . In this scenario, the altcoin might surpass $3.66, breach $3.80, and aim for $4.00 . Such a move would invalidate the bearish outlook and set a new all-time high.
XRP - Probable Trade!!! Very Yet!This trade is very probable and very to your extend beyond your imagination! Wait and watch!
XRPUSDTBINANCE:XRPUSDT broke above its long-term downtrend line and surged to the $3.5000 resistance area, but is now undergoing a correction. The current bullish structure, with a higher high and higher low, suggests the trend remains upward. A pullback toward the $3.0000 demand zone is likely and would be a healthy retracement. Holding this area could trigger a continuation toward the key resistance at $4.2000.
Key Level Price
Main Support $2.2000
Main Resistance $4.2000
Best Buy Range $2.9500 – $3.1500
Best Sell Range $4.1000 – $4.2000
Investment Risk (Buying) Medium
⚠️Please control RISK management
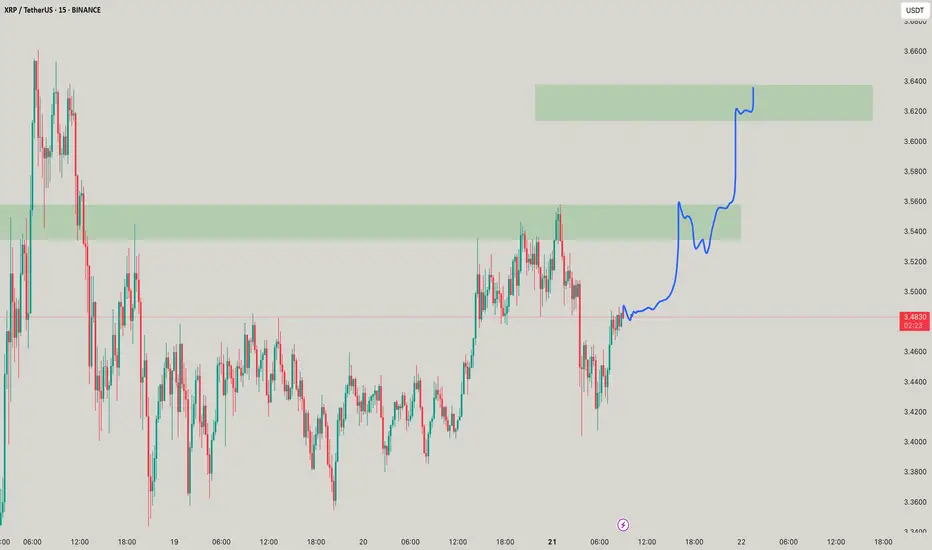
XRP stays above $3 ┆ HolderStatBYBIT:XRPUSDT is printing higher lows into the $3.44 resistance. Breakout could activate $3.60 target. Watch $3.30–$3.28 for possible pullbacks. Bullish pressure mounting.
HolderStat┆XRPUSD seeks to the $4BYBIT:XRPUSDT remains steady above $3.10 after the recent breakout. Resistance at $3.40 is being tested. A move above it may unlock $3.55+.

Ripple Update: Is XRP Ready for Another 500% Growth?Hey friends, it’s Skeptic 🩵 . In this video, I’m giving an update on Ripple’s conditions , reviewing past triggers, and what to do with your long positions in futures if you’re still holding. For spot, what’s the move? I dove into XRP/BTC analysis and, at the end, broke down BTC.D , which just had a major event you need to pay close attention to. Don’t forget money management, and stay clear of FOMO. Drop your thoughts on XRP in the comments so we can chat about it!

XRP New ATH is above 5$Our long from 2$ is now on +100% profit:
\https://www.tradingview.com/chart/XRPUSDT/nI5aVpoY-XRPUSDT-after-breaking-red-trendline-can-easily-hit-3-5/
and red trendline broke and the pump started as it was expected but for now i think it can push a little more higher at least to the targes like 5$ and if this market remain bullish and BINANCE:BTCUSDT try to hit targets like +140K$ then XRP even can go for ATHS like 7$ and 9$.
DISCLAIMER: ((trade based on your own decision))
<<press like👍 if you enjoy💚

Be careful with RIPPLE !!!The pennant pattern has been broken, and the price follows an AB=CD pattern, targeting a rise above the 5 dollar.
Best regards CobraVanguard.💚

XRP | Full AnalysisHere is the full analysis for CRYPTOCAP:XRP as requested 🫡
Let’s start with the weekly timeframe:
With the recent breakout above the $3.40 high, we’ve activated a new, larger bullish sequence on the weekly chart. This sequence has its target region between $6.57 and $7.84, which I believe we will reach at minimum during this bull run.
From now on, every pullback into the B-C correction area (turquoise) can be considered a legitimate re-entry opportunity.
Daily chart:
We successfully broke the all-time high with another breakout sequence (orange), which has already completed its target region.
Now, we’re trading the overall correction level — this is the same area as the B-C correction area from the weekly timeframe. It’s the Fibonacci retracement drawn from the start of the move to point C.
Local Price Action:
After reaching the target zone (orange), we activated a new bearish sequence in the upper region, which has just completed its target zone.
Now we expect a move back into the overall correction level (blue), and after that, according to the rulebook, the next legitimate U-turn could follow.
It gets really interesting if we enter the overall correction level and then start forming a bearish structure on the lower timeframes — this is where we can apply a multi-timeframe approach, which significantly increases the probability of a successful trade.
-----
Thats the my full Analysis for CRYPTOCAP:XRP , hope it was helpful if you want me to do another analysis for any other pair just comment down below.
Also, if anyone is interested in how my trading system works, let me know and I’ll post some educational content about it.
Thanks for reading❤️
