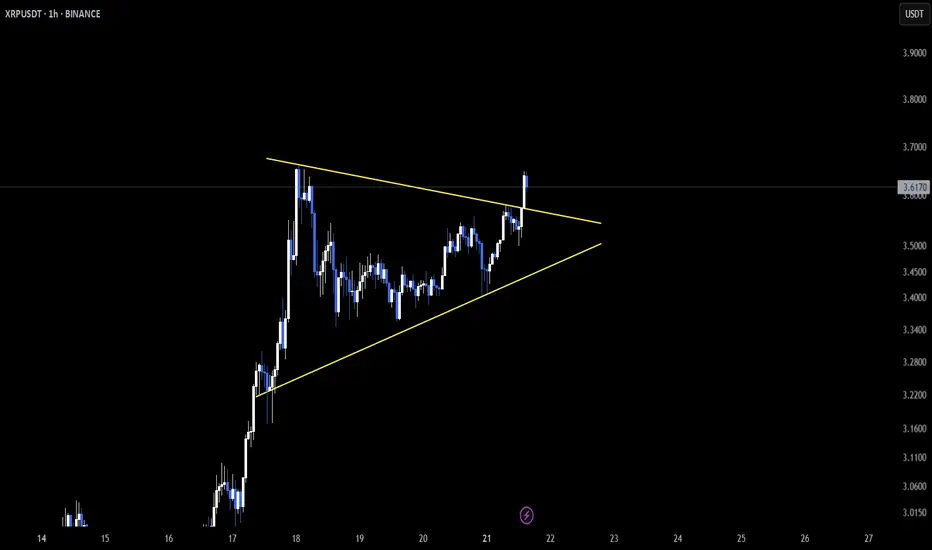
XRP – Intraday Breakout in MotionCRYPTOCAP:XRP is showing signs of strength on the 1-hour chart, breaking out of a symmetrical triangle 📈. This classic pattern often signals continuation when confirmed properly.
A clean retest of the breakout zone could open the door for another bullish leg up 🔄.
Short-term traders should stay cautious though—lower timeframes can lead to quick traps or fakeouts ⚠️.
For now, momentum is leaning bullish. Keep your eyes on how price behaves from here! 👀
XRPUSDT trade ideas
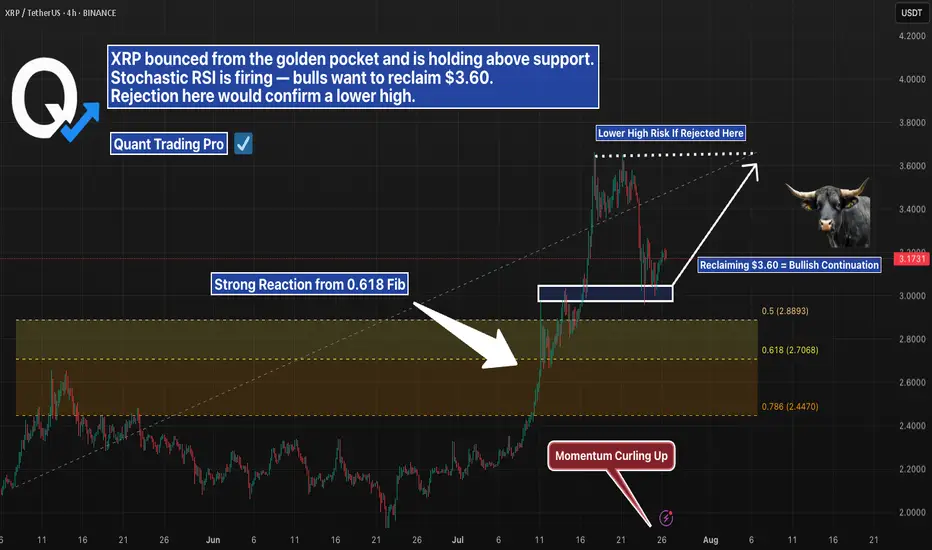
XRP 4H – Golden Pocket Bounce, But Will Bulls Reclaim $3.60?XRP pulled back cleanly into the golden pocket (0.618 Fib) after a strong rally — and buyers stepped in with force. Momentum flipped quickly, and Stochastic RSI is curling up with bullish intent.
Now price is holding above short-term support, but faces a key challenge:
→ $3.60 marks the prior high
→ Reclaiming that level would confirm bullish continuation
→ A rejection here would set up a lower high and shift structure bearish
This is a make-or-break moment for XRP in the short term. The golden pocket held — now the top of the range needs to flip.
#XRP #GoldenPocket #Fibonacci #CryptoAnalysis #StochasticRSI #LowerHighRisk #PriceAction #QuantTradingPro

XRP - Long termIt should be noted that any asset may experience a sudden decrease in value, but XRP has had a slight decrease in price after a 150% increase from the price of $0.50. Although this currency will definitely increase in the future, it is necessary to pay attention to the decreases and make purchases within the price support areas because these support areas are highly regarded by the general public. In this analysis, two limits have been identified that are used to enter the market in the event of a price drop.
Sasha Charkhchian

Xrp cup and hundleChart Xrp/usdt (4h)
Classic cup&hundle breakout in play. price broke above the neckline $2.5 with strong volume, followed by a clean retest of the breakout zone

Breakout or pullback?Update on the previous analysis:
We had anticipated a pullback due to the lower high, and that view remains unchanged — unless buying volume increases and we manage to break through the resistance.

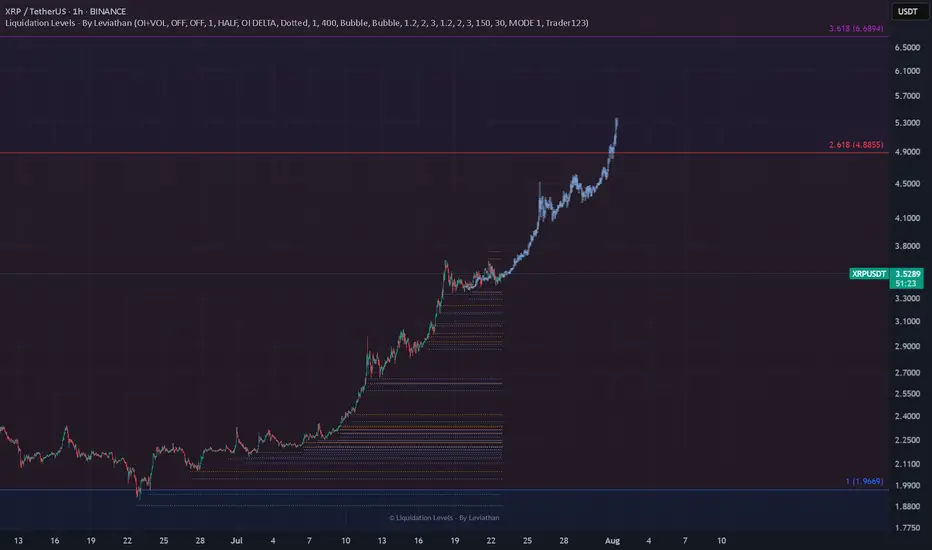
XRP: Whales Exit Pressure Plummets 94%! New ATH Incoming?CRYPTOCAP:XRP is consolidating near its recent highs, but don't let that fool you! Fresh on-chain data suggests a major move is brewing.
Latest analysis shows: BINANCE:XRPUSDT
🔹 Whale-to-Exchange Flow has plummeted by a staggering 94%, indicating large holders are strongly reducing their selling intent. This massive drop in supply pressure is a HUGE bullish signal!
🔹 New holders are entering and showing strong conviction, absorbing any remaining selling.
🔹 Key resistance sits at $3.59, with a potential push towards $4.64 based on Fibonacci extensions. Crucial support at $2.95 defends the bullish outlook.

Xrp BOS at 3.17 with bullish engulfing and volume. A break of structure is first sign of strength which would be a bullish candle breaking 3.17. I am looking for a 3.17 push through, with high volume in compared to last candles on the 1hr time frame. Once a break of 3.17 occurs, I need a retest of the 3.17 area with another bullish candle to confirm my entry long. I will be looking to take minor profits as price moves through key supports of 3.2,3.23,3.3. Once they have been pushed through I will hold and take profit as I see fit. My tight sl will be 3.13. I will not be looking at wicks. I will strictly be looking at candle bodies.

XRP ~ Is this a best trade to take?XRP ~ This beauty is best to be buys at the red nd aim for the greeens!
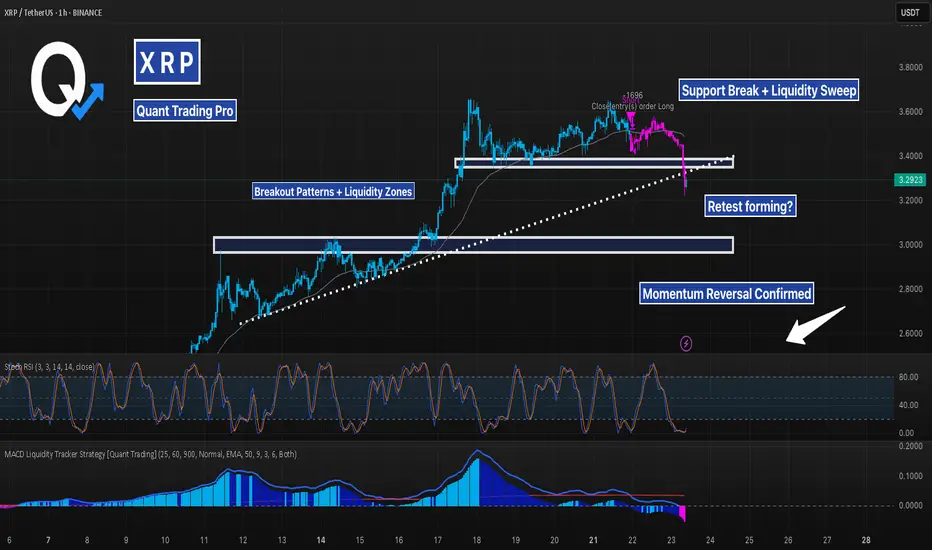
XRP Breakdown – Trend Break & Liquidity Zone Retest In ProgressXRP just gave us a clean breakdown below a well-formed ascending structure, violating both its dynamic trendline and horizontal support.
Let’s break down the setup:
🔹 Trend Context: Price was holding cleanly above the MA and respecting a dotted trendline, bouncing off prior breakout zones multiple times. This uptrend was sustained for days, with momentum supported by both MACD histogram expansion and Stoch RSI resets.
🔹 Structure Shift: After a minor consolidation, price rejected from the upper range and aggressively broke below support. The last long was closed during this transition — confirming the momentum was fading.
🔹 Liquidity Zones: The prior resistance-turned-support zone failed, with price wicking below and potentially sweeping stop orders before stabilizing.
🔹 Momentum Flip: MACD histogram has flipped red, and Stoch RSI is deeply oversold. This signals possible short-term exhaustion, but trend structure is clearly damaged.
Traders now face two scenarios:
1️⃣ Bearish case → Breakdown holds, and price trends lower into deeper liquidity (~3.00 or even 2.71).
2️⃣ Bullish case → Price reclaims structure with strength, invalidating the breakdown and trapping early shorts.
Key levels are in play. Wait for confirmation — especially on the retest.
#XRP #Breakdown #CryptoAnalysis #MACDStrategy #SupportResistance #LiquidityZones #TrendBreak #TechnicalAnalysis #AlgoTrading #QuantStrategy
XRP To $5-$5.25Typical XRP breakout pattern. Expect cup and handle consolidation to keep forming this week before a quick move to $5 before th end of the month. From there i expect a broader market correction but final pt's around $6-7
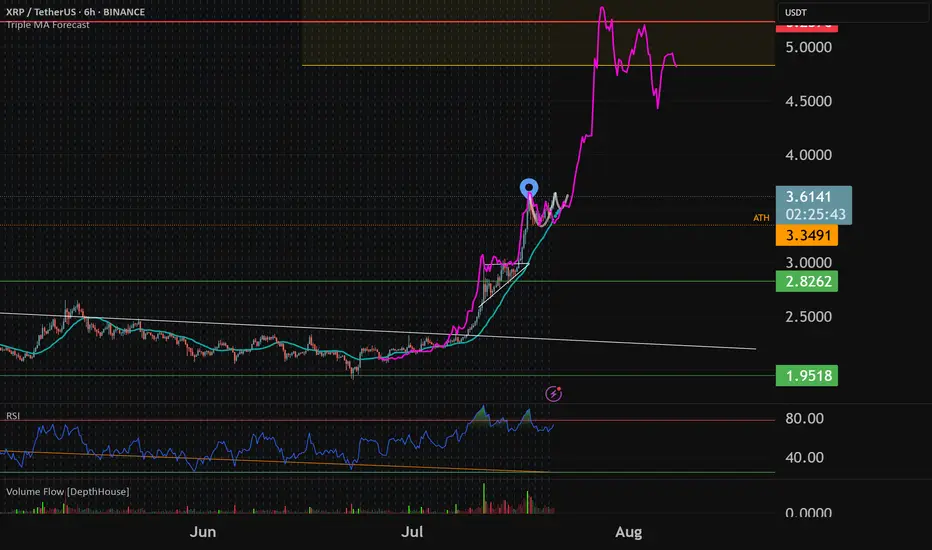
#XRP Update #3 – July 18, 2025#XRP Update #3 – July 18, 2025
XRP has surged roughly 28% in its latest impulsive move. Naturally, we now expect a correction phase. Potential retracement levels are:
Level 1: $3.30
Level 2: $3.20
Level 3: $3.10
Pullbacks to any of these levels should not be alarming — they are typical and healthy corrections.
I plan to go Long if XRP bounces from the first correction zone. However, at the moment, I’m just observing, as the current signals are not strong enough to justify entry.
It’s also important to note that there are heavy whale sell orders between XRP’s current price and the $4.00 zone. Breaking through this resistance will likely require strong buy-side volume from large players. Caution is advised.

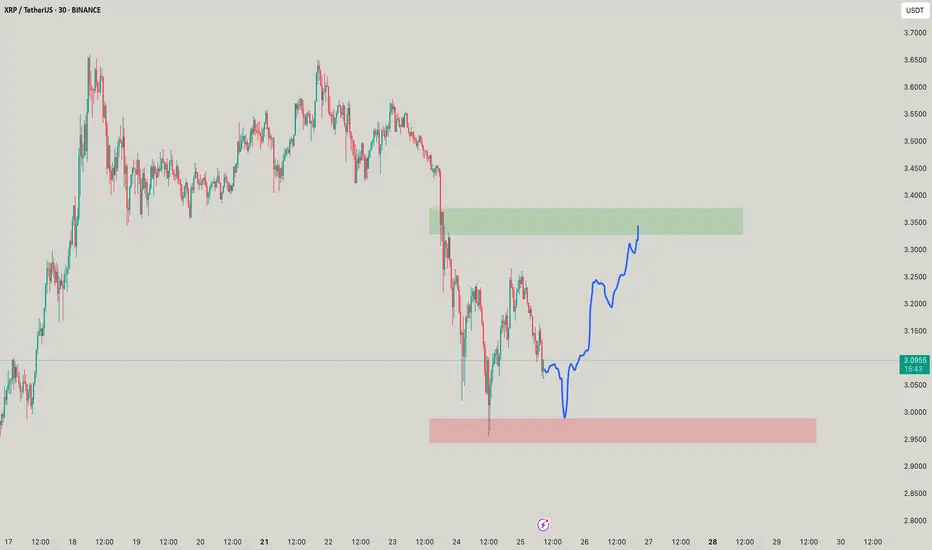
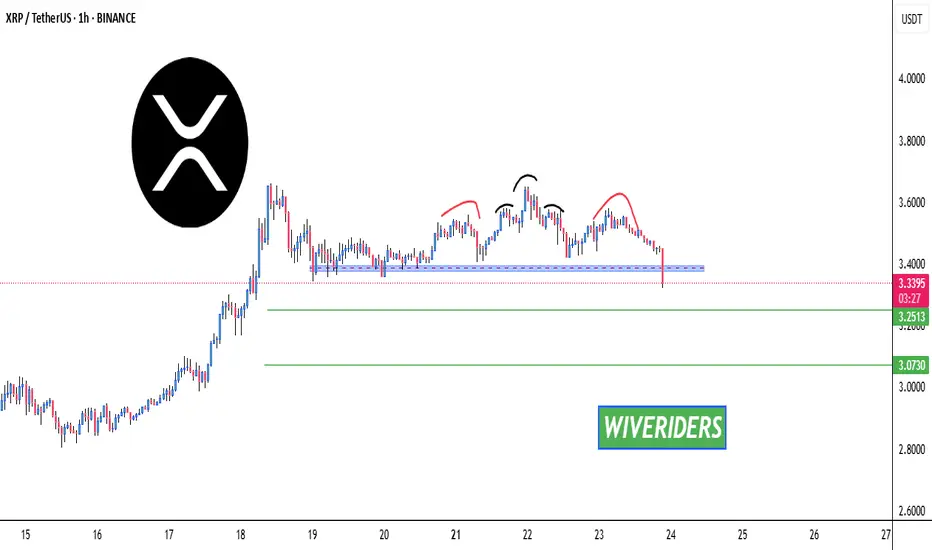
Bearish Patterns & Support Test🚨 CRYPTOCAP:XRP Price Update – Bearish Patterns & Support Test 📉
CRYPTOCAP:XRP has now formed two bearish Head & Shoulders patterns –
• One small H&S pattern
• One larger H&S pattern
Currently, XRP is testing the blue support zone.
📌 If this blue support breaks, the price could drop further toward the green line levels,
which are strong zones where buyers previously stepped in.
✅ Watch for potential bounce at the green zone – this could present a solid long opportunity if confirmation is seen.
XRP TRENDXRP is following the same pattern.
Following Trend as well.
Final Target 6-8 USD maybe 10-12 USD
$PEPE chartCRYPTOCAP:PEPE cup and handle. Cup in the making? CRYPTOCAP:PEPE has one of the highest beta as a meme coin and is a high beta proxy for Ethereum. ETH is on its way to $4000 now
XRP needs a short and fast correction!After a long ride with HL triangles and pomps, it looks like an LH triangle and correction is on demand as TOTAL2 hit its big resistance.
Be wealthy and follow your strategy❤️

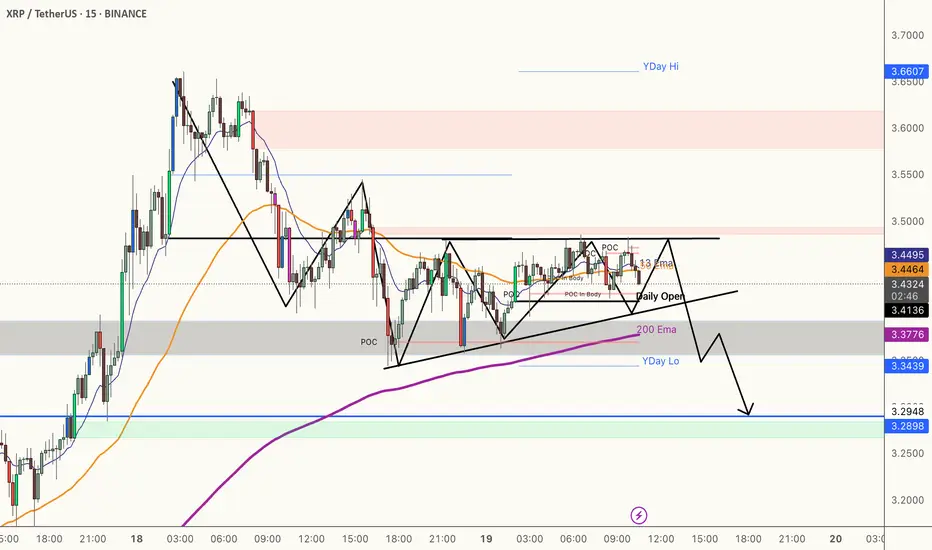
XRPUSD ShortI expect XRP to make another move to the downside for a larger correction before we see further bullish momentum. On the 15-minute timeframe, a triangle pattern is currently forming, suggesting that a break below the 200 EMA is likely
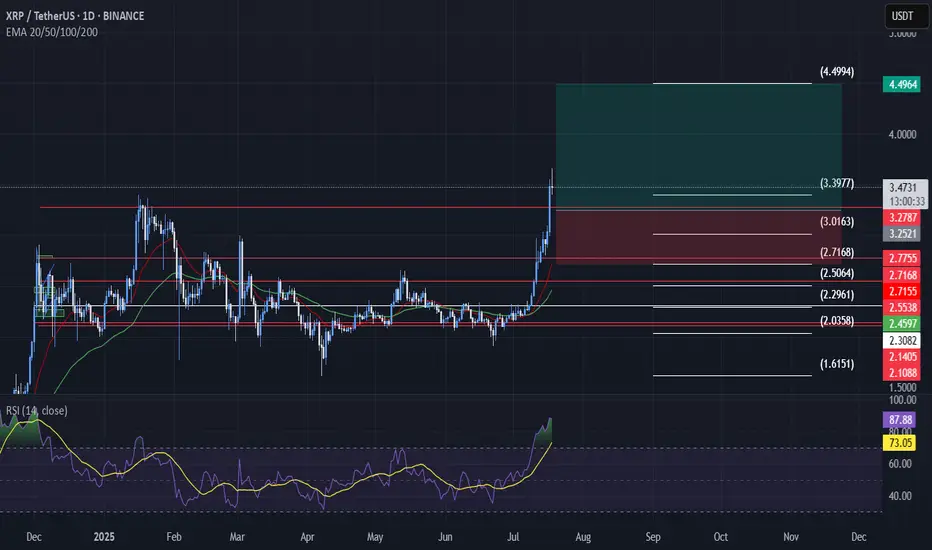
xrp breakoutXRP has broken out of a multi-month consolidation zone, clearing major resistance levels around $2.75–$3.00. The current price action shows strong bullish momentum supported by moving averages and an overextended RSI.
Key levels:
Entry: $3.46 (market price)
Stop-Loss: $2.75 (below 0.382 Fibonacci and prior resistance)
Target: $4.49 (based on previous price structure and Fibonacci extension)
Risk-to-Reward Ratio: ~1:3.9
Analysis:
Bullish EMA alignment (price is above 20/50/100/200)
RSI is overbought (~87), which signals strength but also warns of potential retracement
No retest of breakout zone yet — caution on late entries
This setup is momentum-based, not for late chasers. I will monitor for a clean retest around the $3.00–$3.20 area for a safer re-entry if price pulls back.
1D XRP/USDT Projection, non-operable areaCurrently in the selling zone, I am selling 50% of my XRP capital, possible buyback zones down $3.

WHY DO YOU KEEP ASKING ABOUT PRICE SO MUCH?WHY DO YOU KEEP ASKING ABOUT PRICE SO MUCH?
The problem lies in the wrong frame of reference when you first enter the market. Faulty input leads to flawed thinking, resulting in poor actions and bad outcomes.
I constantly receive questions like:
“Can I buy at this price yet?”
“Should I wait for a lower price?”
“Is this the bottom?”
“BTC is at 108k, is it still good to LONG?”
“It’s at 123k now, will it go to 180k?”
All of these revolve around PRICE, but in reality, price isn't what you should focus on. What's important is understanding market movements and trends.
Many of you DCA blindly at resistance, support, or based on on-chain data, thinking the price will reverse or bounce… but it doesn’t. So why?
---------------------------------------------------------------------------------------------
Let me give you an analogy:
Imagine you're hiking the Alps.
You start early in the morning. When you're tired, you rest. When the scenery is beautiful, you stop and enjoy it. When you're thirsty or hungry, you take a break. Eventually, you reach the top (PEAK).
Did you ever ask your friend along the way:
"How many meters have we climbed?"
"How many meters left to the top?"
Of course not.
You just know you're ascending, and when you reach the peak, you’ll know.
Uptrend is like climbing up, downtrend is climbing down.
You don’t need to know your exact altitude — you just need to know whether you’re going up or down, and when you’re at the top, you’ll feel it.
---------------------------------------------------------------------------------------------
The market is the same.
When it goes up, you know it’s going up.
When it goes down, you know it’s going down.
When it’s the peak, you’ll know.
When it’s the bottom, you’ll feel it.
There's no need to obsess over:
“Is this the top?”
“Is this the bottom?”
Why?
Because when you're fixated on the real-time price, without understanding market movement, you’re being led by price — not leading your trades.
---------------------------------------------------------------------------------------------
In summary:
Stop letting price control your mind.
Focus on trends and market movement, and you’ll know where you are.
When climbing, you know you’re climbing. When peaking, you’ll know it’s time to pause. Simple as that.

#XRP Update #2 – July 15, 2025#XRP Update #2 – July 15, 2025
XRP had previously completed the correction of its first impulsive move. Now, it has also completed the correction of the second impulsive leg. The current target for XRP stands around the $3.15 zone.
However, before reaching that level, it first needs to break through the $3.00 resistance area, which previously acted as a strong support/resistance zone. If XRP fails to gain enough volume and momentum for a strong breakout, there is a risk it may reverse from this level, potentially forming a double top pattern.
Because of this uncertainty, I do not recommend taking a long or short position on XRP at this stage.

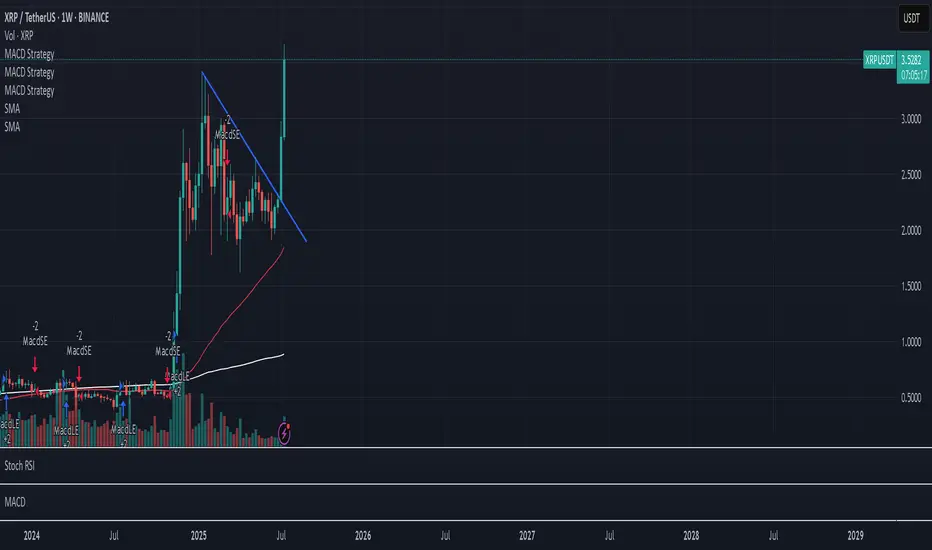
XRP $6.5, $9.5, $12.5 & $15.5 · Which One?XRP broke a small local downtrend and managed to close above a small resistance zone around $2.76. It managed to do this on a full green candle with rising volume.
XRPUSDT weekly is currently trading above all moving averages, extremely bullish: MA200, EMA377, EMA233, EMA89 and the rest.
If we look at a bull market cycle as a series of three steps, we have the first two missing the last one. Compare current action with 2021 while noticing the 1,2,3 numbers on the chart. This leaves us wondering about the next target: How high can XRP go in its next bullish move?
It seems something extraordinary is brewing behind the scenes, I can feel it. What we've been saying all along but rather than just words, a new feeling came up. "It is not the same to live through an event vs talking about it." That kind of feeling.
I can continue to say that market conditions are extremely positive now especially when we compare it to several years ago. But we have not seen the effect this positive conditions will have on the market, the price of the different projects and the charts, but we are getting close.
XRP has big plans and continue to grow, expand and evolve.
The 2021 bull market from bottom to top produced more than 1,800%. In 2025, if we start counting from the July 2024 low, a target of $6.50 would mean a total of ~1,585% growth. Market conditions are better now so we can aim higher, expect more.
A target of $9.51 sounds great, this would mean a nice ~230% from current price and from the same low as before, a total of ~2,400%. This sounds better but we can do more.
The next two targets based on an extension of the current trend would lead to $12.5 and $15.5. I'll let you calculate the potential yourself.
$6.5, $9.51, $12.5 or more; whatever the market ends up giving us, we are happy to be part of this adventure and we are always grateful for the amazing results.
Aim high. I will be here reading the charts live when we are getting close to the top. There will be time to sell, time to adapt, time to decide. There will be enough time for everything if you start now. Prepare now and success is yours.
We are early for the last phase of the XRP 2025 bull market. The first half is in, we are due the second half; it will be great.
Namaste.

XRP/USD LOOOOONGS🔀 Varied risks vs rewards
Break of downward trend ⤴️
🐃 Bullish overall bias
XRP army aren't stopping here 🌙
1️⃣ Tightest is - 1% (3.29) / 3% (3.69)
2️⃣ Mid - 1% (3.18) / 5% (4.18)
3️⃣ Large - 1.5% (3.10) / 6% (4.8)
Lets see how we goes!!
