XRP | Head and Shoulders Pattern.
Head: $3.4.
Left Shoulder: $2.9.
Right Shoulder: $3.0.
The Neckline: $2.00.
Components of the Pattern:
Left Shoulder: Represents the first peak at $2.9, where the price rose and then retreated to the neckline at around $2.00.
Head: The highest peak at $3.4, the topmost point of the pattern, followed by a retreat to the neckline at $2.00.
Right Shoulder: The second peak at $3.0, lower than the head, followed by a retreat to the neckline at $2.00.
Neckline: Remains at approximately $2.00, a horizontal support level connecting the lows after the left shoulder and the head and the right Shoulder.
Implications of the Pattern:
The pattern remains a bearish reversal pattern, indicating a weakening of bullish momentum after reaching the head at $3.4.
If the price breaks below the neckline ($2.00) with increased volume, this confirms the pattern’s completion and signals a significant decline.
Current Situation (March 2025):
The current price ($2.2) is very close to the neckline ($2.00), making a breakout likely in the coming days.
The potential crossover of the moving averages (blue and red lines) supports the possibility of a trend change.
NOTE:
If the price bounces off the neckline ($2.00) with increased volume, this invalidates the pattern.
In this case, the price might attempt to retest resistance at $3.0 (right shoulder peak) or even $3.4 (head peak).
Conclusion:
The Head and Shoulders pattern: indicates a strong potential for a bearish reversal, if the price breaks below the neckline ($2.00). Confirmation of the breakout with increased volume is essential, while considering fundamental news that might influence the market.
XRPUSDT trade ideas

XRPUSDT: A Massive Move Is Coming – But Will It Be Up or Down?Yello, Paradisers! Are we about to see an explosive breakout in XRP, or is a deeper pullback lurking around the corner? Let’s break it down.
💎XRPUSDT has formed a falling wedge alongside a bullish divergence, signaling a potential upside move. Adding to the bullish case, we also see an inverse head & shoulders pattern forming underneath – a combination that significantly increases the probability of a breakout.
💎For a high-probability bullish confirmation, we need a breakout and candle close above the falling wedge.
💎That said, if price retraces deeper, we should be watching the major support zone for a potential bounce. A bullish I-ChoCH on lower timeframes will serve as the key confirmation for a reversal.
💎The invalidation level? If XRPUSDT breaks down and closes candle below the major support zone, this bullish setup will be completely invalidated.
🎖Stay sharp, Paradisers. The next move will decide everything! As always, discipline and patience will separate the winners from the crowd. Be strategic, trade smart, and wait for the highest probability setups.
MyCryptoParadise
iFeel the success 🌴

4 Hour showing a potential Inverse H$S setup...Let's see if this setup materializes and creates a measured move up to the next Volume Shelf. Indicators favoring this.

4 Hour Inverse H&S Potentially Setting Up...Let's see if this materializes and creates a nice measured move pop.

XRP on the BrinkXRP is currently trading at $2.095, reflecting a volatile period for the cryptocurrency amidst a broader market downturn. The crypto market has faced significant challenges recently, with the total market capitalization dropping by 4.4% in the past 24 hours, and major altcoins like Bitcoin, Ethereum, and Solana also experiencing declines. For XRP specifically, recent price action has been a rollercoaster: it surged by an impressive 34.21% on March 2, only to be followed by two sharp corrections that erased those gains and pushed the price below its early March levels. This volatility sets the stage for a cautious approach on the 1-hour timeframe, as XRP navigates both its own dynamics and the broader market's bearish sentiment.
Technical Indicators and Key Levels
From a technical perspective, the short-term trend on the 1-hour chart leans bearish, with the price positioned below the 50-day moving average, indicating weakening momentum. The local support level to watch is $2.0872, just below the current price, which has acted as a near-term floor in recent hours. Should this support fail, the next significant levels are $2.00 and $1.90, where stronger buying interest might emerge based on historical price action. On the upside, immediate resistance lies between $2.10 and $2.15, a zone that has capped recent recovery attempts. A break above this could pave the way for a test of $2.20, though the broader market pressure suggests that any upward move might lack the strength for a sustained rally without a notable shift in sentiment or volume.
Potential Scenarios and Trading Considerations
Traders should consider two primary scenarios on this 1-hour chart. If the $2.0872 support holds firm, XRP could enter a phase of consolidation or stage a minor bounce toward the $2.10-$2.15 resistance zone, potentially offering a scalping opportunity for nimble traders. Conversely, a break below $2.0872 could accelerate selling pressure, targeting $2.00 or even $1.90, especially if accompanied by rising volume, which would confirm bearish conviction. Volume is a critical factor to monitor here: an uptick on downward moves signals stronger selling, while a surge on upward moves could hint at a reversal. Given the market's current state, downside risks appear more pronounced, but a sudden catalyst, like positive news on the ongoing SEC lawsuit against Ripple, could flip the script.
Broader Context and Final Tips
The bigger picture adds nuance to this 1-hour analysis. XRP’s longer-term trends, such as the falling 200-day moving average since March 7, reinforce a cautious outlook, while the unresolved SEC lawsuit remains a wildcard that could spark volatility at any moment. For now, the focus is on these near-term levels and volume cues. Traders should stay alert for external triggers, like upcoming US CPI data or market-wide shifts, that could sway XRP’s direction. Keep your stops tight, watch the $2.0872 support closely, and be ready to act if volume confirms a breakout or breakdown. This setup offers opportunities, but patience and discipline will be key in this choppy market.
Key Levels to Watch
Immediate Resistance: $2.10 - $2.15
Next Resistance: $2.20
Immediate Support: $2.0872
Next Support: $2.00, $1.90
Potential Price Movements
Bullish Scenario: If the price breaks above $2.15, it could rise to $2.20.
Bearish Scenario: If the price drops below $2.0872, it might fall to $2.00 or even $1.90.
Note: Look for higher trading volume during breakouts or breakdowns to confirm the move’s strength.

Is XRP Ready to Run? How to Make Sure?XRP has a reputation for keeping traders on edge—poised like a grenade with the pin pulled, ready to explode into sky-high green candles at any moment. XRP holders often find themselves gripping the edge of their seats, nerves frayed, waiting for that breakout.
But let’s be real - the path to those peaks is rarely a smooth ascent. More often, we’re met with a rollercoaster of exhilarating higher highs (HH) followed by gut-wrenching cliff-dropping lows.
This relentless tug-of-war between bulls and bears creates a volatile battlefield where trading with leverage can feel like a high-stakes gamble—damn near impossible without the right tools.
That’s why I set out to craft a solution: an indicator designed to tame XRP’s chaotic spikes and dips. After countless iterations, sleepless nights, and invaluable collaboration with the brilliant Grok 3 (a super-smart AI built by xAI), the XRP Fortune Protector was born. I’ve been rigorously testing it in real-time for nearly a week, and while it might be a bit early to call it perfect, I can confidently say it’s a game-changer. This indicator excels at sniffing out potential bull runs while shielding traders from those devastating dips that can wipe out gains in an instant.
How It Works: Simple Yet Powerful Rules
The XRP Fortune Protector is designed for clarity and precision, working best on the 1H, 15M, and 5M charts—timeframes that capture XRP’s rapid directional shifts. Here’s the magic behind it:
Smart Signal System:
At the top right of your chart, a sleek table displays four "lights" that act as your trading compass. When all four lights glow green—paired with a confirming green "Buy Now" triangle on the chart—it’s a clear signal to consider a long position, hinting at an impending bull run. Conversely, when all four lights flash red alongside a red "Sell Now" triangle, brace for a potential dip and protect your capital.
Multi-Timeframe Analysis:
By leveraging the 5M, 15M, and 1H charts simultaneously, the indicator gives you a panoramic view of XRP’s volatility. This multi-layered approach lets you zoom in on short-term price action while keeping the bigger trend in sight—a critical edge for navigating XRP’s wild swings.
Heikin Ashi Smoothing:
The indicator integrates Heikin Ashi candles to filter out market noise, helping you focus on the true trend without getting distracted by erratic price wiggles.
Dynamic Moving Averages (MAs):
Two adjustable MAs (a fast blue line and a slower yellow line) provide real-time trend insights. Watch for crossovers to confirm the indicator’s signals—bullish when the blue MA crosses above the yellow, and bearish when it dips below.
Bollinger Band-Based TP/SL:
Modified Bollinger Bands serve as intelligent take-profit (TP) and stop-loss (SL) levels, dynamically adjusting to XRP’s volatility. These bands help you lock in profits at resistance zones (like 2.2411) and cut losses near support levels (like 2.0463).
Support and Resistance Zones:
The indicator automatically plots key support (green) and resistance (red) levels, giving you precise price targets to plan your entries and exits. For instance, current support at 2.0463 and resistance at 2.2411 are clearly marked for actionable decision-making.
RSI Overbought/Oversold Detection:
Integrated RSI (currently at 33.46) helps you gauge momentum. When RSI dips near oversold levels (below 30), it often aligns with the indicator’s buy signals, adding an extra layer of confidence to your trades.
Why It’s Clever
The XRP Fortune Protector isn’t just another indicator—it’s a finely tuned system built to thrive in XRP’s chaotic market. Its multi-timeframe analysis ensures you’re never caught off-guard by sudden reversals, while the Heikin Ashi candles and dynamic MAs provide a crystal-clear view of the trend. The Bollinger Band-based TP/SL levels take the guesswork out of trade management, and the RSI integration adds a momentum-based confirmation layer. Together, these features create a robust, all-in-one tool that empowers you to trade XRP with precision, even in the face of extreme volatility.
Testing Results and Next Steps
After a week of real-time testing, the XRP Fortune Protector has proven its worth. It’s successfully identified potential bull runs (like the buy signal on March 5th at ~2.2000) and flagged upcoming dips, helping me avoid significant drawdowns. For example, with my average entry at 2.1965, the indicator’s signals have kept me in the game, holding firm at support (2.0463) while waiting for a push to breakeven or the next resistance at 2.2411.
I’m planning to publish this indicator on TradingView soon, but before I do, I’d love your feedback! From what you see in the chart, are there any features you’d recommend adding or tweaking? Perhaps additional confirmation signals, a volatility filter, or customizable alert settings? Let me know, and I’ll do my best to implement those enhancements before the official release.

XRP Strugling at resistancePreviously, I said there was a trendline break, so I called. However, XRP is struggling at this resistance zone. With the aid of a BTC drop this could very well now drop to 1.6-1.7 levels.

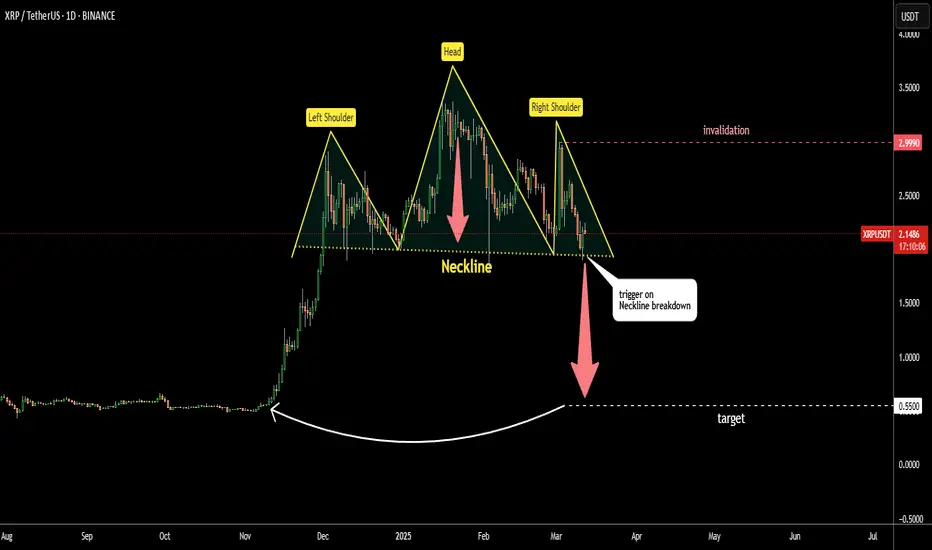
This Pattern Could Return Ripple (XRP) Where It Started Rally Textbook, beautiful symmetric Head & Shoulders reversal pattern emerged on Ripple
approaching the Neckline.
Head is the highest peak among three on the chart
Neckline is built through valleys of the Head.
Price already tested Neckline support and was rejected yesterday.
Bearish trigger is on the clear breakdown.
Target is located at 0.55
It was calculated by subtracting the height of the Head from the Neckline.
It is the support area where XRP started its rally before.
"What goes up should come down"
xrp trendline broken. Go longClear break of trend line target highs and above. Precious chart showed short and hit the second target

xrp trendline broken. Go longClear break of trend line target highs and above. Precious chart showed short and hit the second target

XRP/USDT 1H: Bullish Reversal in Play – Targeting $2.50?XRP/USDT 1H: Bullish Reversal in Play – Targeting $2.50?
🚀 Follow me on TradingView if you respect our charts! 📈 Daily updates!
Market Structure (Confidence Level: 8/10):
Strong bullish reversal confirmed after testing $1.95 support.
RSI showing multiple bullish divergences, with three "Bull" marks on the indicator, signaling upward momentum.
Smart Money Analysis:
Order block formed at $2.15, confirming demand.
Break of market structure at $2.19, shifting trend bullish.
Institutional accumulation visible in recent volume spikes.
Trade Setup:
Entry: $2.17 - $2.19 (current retest).
Targets:
T1: $2.35 (Fair Value Gap).
T2: $2.50 (major resistance).
Stop Loss: $1.95 (below recent swing low).
Risk Score:
8/10 – Favorable setup, but recent volatility requires careful execution.
Market Maker Activity:
Currently engineering a stop run above $2.20, likely before a move higher.
Volume profile supports continuation to premium zones.
Recommendation:
Long positions remain favorable in the $2.17 - $2.19 entry range.
Monitor price action near $2.20, as market makers may sweep liquidity before pushing higher.
Manage risk carefully given recent price swings.
🚀 Follow me on TradingView if you respect our charts! 📈 Daily updates!

XRP - Do NOT Fear The Dip - This Is Where To BUY MartyBoots here , I have been trading for 17 years and sharing my thoughts on BINANCE:XRPUSDT here.
BINANCE:XRPUSDT is looking beautiful , very interesting chart for more upside and dips into support are buys
Do not miss out on BINANCE:XRPUSDT as this is a great opportunity
DO NOT FEAR THE DIP
Watch video for more details

XRP Holds Strong—Will It Break Out or Break Down?The crypto market is feeling the pressure from institutional dominance, and WHITEBIT:XRPUSDT is no exception. However, despite the uncertainty, XRP has managed to hold a key support level. With rising speculation around XRP as a potential U.S. reserve asset, will we see a bullish reversal, or is a deeper correction ahead?
🔹 XRP Demand on the Rise – The approval of a Bitcoin strategic reserve has fueled speculation about XRP following suit. This narrative could be supporting the price above the key $2 level.
Head & Shoulders Pattern—Bearish Breakdown Ahead? ⚠️
📉 XRP has reached the neckline of a head & shoulders pattern, a classic bearish setup. If this plays out, a breakdown could see prices dropping to $1.5.
📊 Supertrend Indicator is flashing bearish, signaling growing downside risks.
📌 RSI Shows Bullish Divergence – While still below the descending trendline, a breakout could flip the momentum.
Key Levels to Watch
✅ Support: $2.00 – A break below could accelerate losses to $1.50.
🚀 Resistance: $2.50 – A breakout could send XRP toward $2.80 and beyond.
Despite short-term uncertainty, XRP remains a strong player, having surged 336% since Trump’s victory. Will the bulls step in, or are we in for more downside? The next move could be crucial!

Bullish Flag Formation on XRP – A Rally to $4 in Sight?
BINANCE:XRPUSDT BITSTAMP:XRPUSD has been in a corrective phase after reaching its recent highs, forming what appears to be a bullish flag pattern. This structure suggests that the asset is consolidating before its next potential leg upward. The price has been repeatedly rejecting the support zone between $1.70 and $2.00, strengthening the case for this area acting as a key accumulation zone.
An optimal entry could be around the $1.70 level, as it aligns with the lower boundary of the support range and the pattern’s validation zone. If XRP manages to break out of the flag structure, the projected move based on the flagpole extension suggests a target of $4.00, offering a compelling risk-to-reward setup.
To confirm the trade before entering, traders could look for a structural shift in lower timeframes, such as a break in the current downtrend or strong bullish volume. If the pattern plays out as expected, this could set the stage for the next explosive move in XRP.
👨🏻💻💭 Will this bullish flag deliver? Time will tell, but the setup looks promising!
__
The information and publications within the 3Commas TradingView account are not meant to be and do not constitute financial, investment, trading, or other types of advice or recommendations supplied or endorsed by 3Commas and any of the parties acting on behalf of 3Commas, including its employees, contractors, ambassadors, etc.

XRPUSDT soon can dump below 2$ As we can see on daily chart we the head and shoulders is forming and if the support of this head and shoulders break which is 1.95$ support zone then heavy dump will lead and we are looking for at least -50% dump from here and targets like 1.5$ and lower and maybe after that if the support hold then 5$ is also expected.
DISCLAIMER: ((trade based on your own decision))
<<press like👍 if you enjoy💚

Lingrid | XRPUSDT Head and Shoulders Pattern: Bearish Signal?BINANCE:XRPUSDT is currently making lower lows and lower closes. The market took liquidity above the 2.80 level before pulling back to the support level at 2.00. This movement essentially created a false breakout, suggesting that buyers are hesitant to enter the market at those price levels. Taking a broader view, we can observe that the price action is forming a head-and-shoulders pattern, which is typically indicative of a reversal. Given that the previous weekly candle was a significant bearish candle, it suggests that the price may retest the 1.50 level. Therefore, I anticipate XRP to retest the resistance followed by moving lower. My goal is support zone around 1.63
Traders, if you liked this idea or if you have your own opinion about it, write in the comments. I will be glad 👩💻

Will Ripple break the trendline or face another 24% drop?Hello and greetings to all the crypto enthusiasts, ✌
In several of my previous analyses, I have accurately identified and hit all of the gain targets. In this analysis, I aim to provide you with a comprehensive overview of the future price potential for Ripple , 📚💡
There is a potential for upward candles to form as part of the final phase of the current bearish trend, but a further decline from this point remains a significant possibility for Ripple. I anticipate an additional drop of at least 24% in the market, with the primary target price at $2. The bearish cycle continues to unfold, with the price losing critical support levels along the way. If Ripple fails to break through the strong daily trendline, the downward momentum is likely to persist, bringing the price to the projected target.📚🙌
🧨 Our team's main opinion is: 🧨
Ripple might see a brief upward movement, but I expect at least a 24% drop, with a target of $2, unless it breaks the key daily trendline, as the bearish trend continues.
Give me some energy !!
✨We invest countless hours researching opportunities and crafting valuable ideas. Your support means the world to us! If you have any questions, feel free to drop them in the comment box.
Cheers, Mad Whale. 🐋

Ripple (XRP): Looking For 17% Pump - Then 35% DUMP!As always, we are looking for a selling position on the XRP coin, where, first of all, we need to see some proper upward momentum to normalize the price; after that, our target is going to be the 200 EMA on a 1D timeframe!
More in-depth info is in the video—enjoy!
Swallow Team

Ripple (XRP): Looking at Daily 200EMA / Might Fall MoreRipple coin had a nice dip but it's not quite what we want to see. We are expecting to see a further movement here to lower zones towards the daily timeframes 200EMA!
More in-depth info is in the video—enjoy!
Swallow Team

Ripple (XRP): Looking For Fill of Bearish CMERipple caught our attention with an unfilled bearish CME gap where we have recently filled the bullish one.
Now we are looking for either a breakout of 200EMA, which would send the price to upper zones and then we will be looking for a bearish movement from there.
Or we just fall and break down from 100EMA and instantly fill the CME gap!
Swallow Team

XRP Ripple Will Dump More, But Then We Have a ChanceHello, Skyrexians!
Yesterday morning we did a big warning that altcoins will drop again. We expected the dump on Monday, but it has been started the next hour after our post. BINANCE:XRPUSDT is not an exception and dumped with the entire market, but for this coin correction is not likely to be over.
Let's take a look at the daily chart. We can see the clear 5 Elliott wave structure inside the previous wave of growth. The bearish divergence signaled that trend is over and now it's time to fasten your seatbelt. Correction has the shape on zigzag, wave A was impulsive, wave B was ugly and now price is printing wave C, which has to consists of 5 waves as well. The target is $1.5. There we have to see the green dot on the Bullish/Bearish Reversal Bar Indicator for the potential uptrend continuation.
Best regards,
Skyrexio Team
___________________________________________________________
Please, boost this article and subscribe our page if you like analysis!

XRPUSDT 1DXRP ~ 1D Analysis
#XRP Need to maintain this level of support, Break Down from this support level will re -test the support of $1,48

XRPUSDT XRPUSDT has the possibility of long trading from the price of 1.3854 to a stop loss of 0.9947, and if it reaches this price range, it is worth a good trade.
The risk in trading is your choice.
