XRP pushing back up?XRP is currently trading at 2.235, hovering near a potential rising wedge breakdown, which often signals a bearish move. However, a key support zone between 2.17 and 2.27 could act as a safety net, potentially triggering a bounce if buyers step in. If this support holds, XRP might push back toward the resistance zone at 2.50–2.80, with a breakout possibly targeting 3.00. But if the price slips below 2.17, it could drop toward a deeper support at 1.77. These levels are critical, think of support as a floor and resistance as a ceiling where price action often reverses or stalls.
Technical indicators are leaning bearish but not overwhelmingly so. The price is near the 50-hour moving average (MA), staying above it would be bullish, while dipping below could invite more selling. The RSI is below 50, indicating weak momentum, and the MACD shows a bearish crossover, suggesting downside risk. Volume is steady, but a spike could confirm whether a breakout or breakdown is real. Watch these tools closely: a price bounce from support with rising volume and improving RSI/MACD could flip the short-term outlook.
Market sentiment is mixed, clouded by the ongoing SEC lawsuit against Ripple, which keeps some traders cautious. On the flip side, rumors of ETF approvals or new partnerships could spark a rally if confirmed. Social media reflects this split, some see a breakout to 2.80–3.00, others brace for a pullback to 1.77. To stay ahead, set alerts at 2.17 and 2.50, monitor volume for confirmation, and keep an eye on crypto news for updates. With uncertainty high, consider using stop-losses below 2.17 (if long) or above 2.50 (if short) to manage risk. Don't forget: patience is key.
XRPUSDT trade ideas

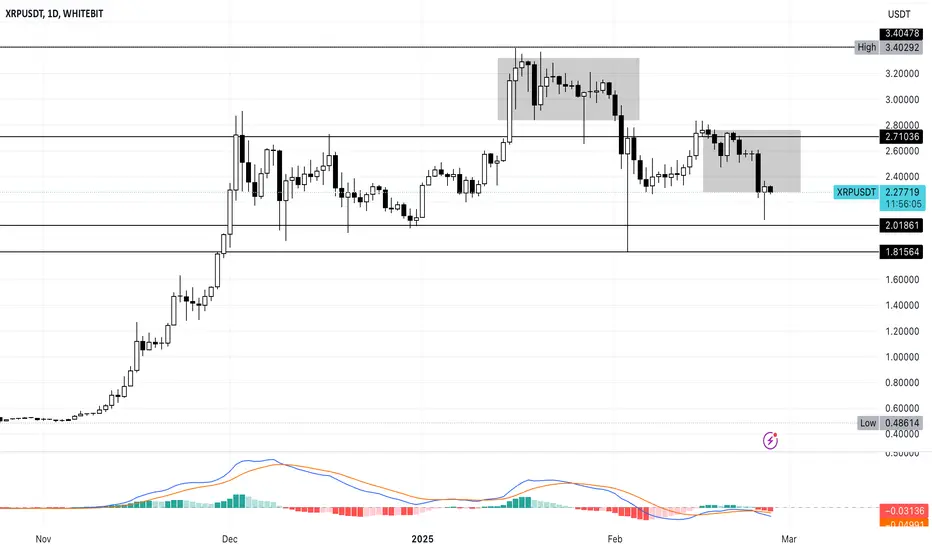
XRP/USD – Bearish Outlook with Key Levels to Watch📌 Key Support & Resistance Levels:
🔹 0.618 Fib – Major Support Level
🔹 0.5 Fib – Primary Support Entry
🕵️♂️ Market Structure & Technical Outlook:
The monthly candle has formed a bearish engulfing pattern, rejecting the high at $3.40. This signals that the market has likely found a local top, increasing the probability of a retracement before further downside movement toward the $1.40 liquidity zone.
As we approach the monthly close, a close below the 0.382 Fib level would confirm further downside after a potential retest.
📉 Market Bias:
✅ Bearish until the gap between 0.5 and 0.618 Fib is filled.
✅ Any short-term pumps are likely bull traps rather than trend reversals.
🎯 Trading Strategy & Risk Management:
🔹 Short-term: Trade range flips, avoid heavy long positions.
🔹 Spot Swing Entries: Wait for breakdown levels in the $1.50 range before considering a buy.
🔹 If in a spot trade: Consider selling at resistance and re-entering lower.
🔹 Short Setup:
Low leverage (1.5x-2x) with a wide stop-loss.
Target lower Fib levels (0.618 - 0.5) for entries.
⚠️ Key Levels to Watch for Daily Close:
🔻 Below $2.21 → Confirms bearish continuation.
🔺 Above $2.21 → Possible retrace to $2.60, but likely a liquidity grab before further downside.
🔮 Conclusion:
I remain bearish on XRP and prefer short setups over long positions for the next two weeks. The focus remains on lower targets before considering any major long entries.
📊 What’s your view? Comment below! 👇

Xrp short.Just opened a small size position on xrp. Short
Targeting $2.0912 area to $2.0625
#XRPCommunity #XRPFamily #XRPHolders

Where will XRP find Support Feels like XRPUSD will find support in the $1.30 range.
If price breaks that level of support XRP can easily retest $0.50 cents or lower.
Before creating its up move.

XRP USDT💰 #XRP Market Outlook 🚀
CRYPTOCAP:XRP is currently in a retracement phase, testing key Fibonacci levels before a potential reversal.
📉 Support Zone: $1.2578 (Key area for a strong bounce)
📈 Potential Targets:
First Target: $3.0110
Final Target: $4.2243
If CRYPTOCAP:XRP holds above the 1.2578 support zone, we could see a massive recovery leading to a bullish breakout. The Fibonacci 0.786 retracement level suggests a strong long entry opportunity at this level.
🔍 Key Confirmation: Watch for a strong bounce from this level, which could trigger a rally toward $3+ and beyond! 🚀🔥
#Ripple #XRPArmy #BullishXRP

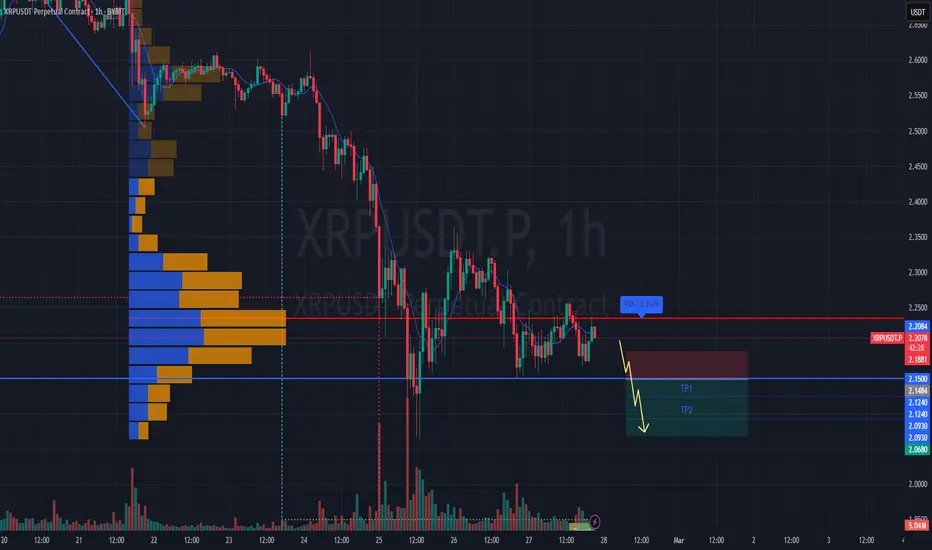
#XRPUSDT – Bearish Scenario, Expecting a Breakdown📉 SHORT BYBIT:XRPUSDT.P from $2.1484
🛡 Stop Loss: $2.1881
⏱ 1H Timeframe
⚡ Trade Plan:
✅ The BYBIT:XRPUSDT.P price is consolidating below POC (Point of Control) at $2.2119, indicating strong seller dominance.
✅ Attempts to push higher have been quickly rejected, suggesting buyer weakness.
✅ If the current support breaks, a strong downward move is likely.
🎯 TP Targets:
💎 TP 1: $2.1240
🔥 TP 2: $2.0930
⚡ TP 3: $2.0680
📢 A close below $2.1484 would confirm further downside movement.
📢 POC at $2.2119 is a major volume area, now acting as resistance.
📢 Increasing volume on the drop supports the bearish outlook.
📢 Taking partial profits at TP1 ($2.1240) is a smart risk-management strategy.
🚨 BYBIT:XRPUSDT.P remains under selling pressure – monitoring for confirmation and securing profits at TP levels!
XRPUSDT - LONG FROM POI 4HTechnically, XRP looks good for a mid-term trade!
The sloping line breaks through, but there is no volume as such due to market uncertainty. Therefore, I plan to wait for a local correction as opposed to retail traders and in the POI range , I will consider a long position
If my personal expectations are confirmed, I will consider the position in the format as indicated on the trading chart.
Targets:
$2.2695
$2.3663
$2.4492
Risk management - 1% on stop order

XRP possible price developmentAs we can see on this daily chart we are still bullish, we did not close below any important low, the price filled the eq of the long daily wick as we can see and it also aligns very nicely with the body of weekly bullish fair value gap, the price reacted positively to it pushing to the upside in the last 3 daily candles, my expected scenarios for xrp are either:
no.1 We will move to the upside and extract some internal liquidity from the daily bearish fvg and then displace to the downside looking to fill the weekly gap and sweeping remaining daily lows to gain momentum and then break to the upside
OR
no. 2 we will invert the daily fair value gap pushing trough and closing above it and continue higher aiming to sweep liquidity at the ltf highs located circa in the 2.7-2.8 price range

XRP- TA was given days ago. BeautifulXRP- TA was given days ago. Beautiful.
i cant paste images (TA and chart) from another source here, unfortunately :(
longed from local daily to local daily . 8.5 % 🎯👌
next possible POIs are marked. We are gonna do TA at those level again. Think dynamically ;)
🔔Follow for more ideas/Signals.
Just donate some of your profit to Animal rights and rescue or other charity :)✌️

xrpMy personal opinion is to buy in the lower blue area. In the short term, if the purple line breaks in the green box, it can be tested as a swing.

Follow up #2 Bullish Hidden Divergence on XRP 4H TF ChartHello ALL,
PS: ALT COINS SEASON ALWAYS STARTED IN FEBRUARY IN THE PAST SO IT IS WORTH BEING STOPPED OUT A FEW TIMES BEFORE IT STICKS !!!!
I Took the Bullish Hidden Divergence -> STOPPED OUT
I Took my chance on the Liquidity Sweep at $2.30 -> STOPPED OUT
Now What ?
I looked for clues in all the Time Frames. It has to be somewhere and Here is what I found:
- 1W TF Chart offers 1 clue:
The trend Channel in the weekly chart is evident if you draw the bottom line of that channel based on the top line that has already formed. (Yellow Lines).
The low of of Tuesday morning touched that line at $2.06-2.10
- 3H TF Chart offers another clue:
LIQUIDITY SWEEP DOJI when price touched the bottom trend line (DOJI 1)
So here is what I did:
I waited for a second bottom after that DOJI 1 and here is what happened:
1. 3H TF Chart: A Bullish Hidden Divergence between PRICE and OBV (Blue arrows) started to form
2. 10M TF Chart: A regular Bullish Divergence between Price an dOBV formed.
I took my chance and I entered LONG around there.
It turns out:
- It was the low of the day so the 10M TF Chart Divergence did not lie.
- a nice LIQUIDITY SWEEP DOJI in 3H TF Chart on the low of the day creating the Hidden Divergence (DOJI 2)
So let’s see what happens !
Thanks for following

XRP REJECTED FROM RESISTANCE Analysis 🚨
CRYPTOCAP:XRP is testing the red resistance zone 🔴 and is getting rejected. The next target is the green line level 🟩.
🎯 Target: Green line level

Be careful with RIPPLE !!!The price has formed a bullish wedge on the 1h time frame, and if it breaks out, it can drive the price up to around $2.8.
Give me some energy !!
✨We spend hours finding potential opportunities and writing useful ideas, we would be happy if you support us.
Best regards CobraVanguard.💚
_ _ _ _ __ _ _ _ _ _ _ _ _ _ _ _ _ _ _ _ _ _ _ _ _ _ _ _ _ _ _ _
✅Thank you, and for more ideas, hit ❤️Like❤️ and 🌟Follow🌟!
⚠️Things can change...
The markets are always changing and even with all these signals, the market changes tend to be strong and fast!!

XRP Takes a Hit—Is Another Crypto Crash on the Horizon?The crypto market just suffered its worst-performing period of the year, losing a staggering $260 billion in just 36 hours. Market capitalization has dropped below $2.86 trillion, with an 8.85% overnight crash shaking investors' confidence.
XRP hasn’t been spared. In the past 24 hours, its price has plunged 11%, now trading with a volume surge of 192.13% to $14.015 billion. Over the last week, XRP is down nearly 13%, confirming that selling pressure is overpowering demand.
What’s Fueling the Bearish Sentiment?
🔹 MACD Showing Strong Bearish Momentum – The red histogram is expanding.
🔹 SMA Indicates Downtrend – A negative slope suggests further weakness ahead.
🔹 Whale Investors on Edge – Institutions are micro-monitoring XRP’s price, waiting for a decisive move.
What’s Next for XRP?
📌 Bullish Case – If buyers return, XRP could retest $3.00.
📌 Bearish Case – If market conditions worsen, XRP could drop to its key $2.00 support.
Despite the crash, XRP’s high trading volume suggests liquidity remains strong—but whether that leads to a rebound or further losses will depend on broader market sentiment.
The big question: Is this just another dip, or the start of a deeper market collapse?
Lingrid | XRPUSDT Retest the RESISTANCE Zone and Potential DROPThe price perfectly fulfilled my previous idea. It reached the target. BINANCE:XRPUSDT market is currently making lower lows and lower closes, indicating a bearish pressure. After consolidating below the 3.00 psychological level, the price has dropped lower towards the support zone at 2.00. The market also broke and close below the upward trendline triggering sell offs. Since the 2.00 level has not yet been tested, I expect the price may continue to push lower. It seems likely that the price will seek liquidity below this psychological level. I expect a small pullback before the market resumes the bearish momentum. My goal is support zone around 2.00
Traders, if you liked this idea or if you have your own opinion about it, write in the comments. I will be glad 👩💻

XRP outlook Still uncertain about the overall market sentiment, but XRP has shown resilience compared to other altcoins during the recent dip. With a potential ETF approval on the horizon—especially if Trump returns to office with his SEC team—XRP could deliver solid mid-term performance.

Xrp Long to $2.39Just now opened an xrp long. Am expecting a break up to $2.39 area starting now.
Price is low so expecting demand to come in here.

XRP DCA (Dollar-Cost Averaging) Trading StrategyThis strategy follows an 8-hour candle-based DCA (Dollar-Cost Averaging) approach.
It buys XRP when the price drops more than 4% within an 8-hour period and sells at the close of the next 8-hour candle.
This method aims to capitalize on volatility while maintaining a long-term upward trajectory.
BINANCE:XRPUSDT.P BINANCE:XRPUSDT.P
More details and full performance reports can be found in my blog. Check my profile for more info.

Break Below $1.90? Ripple Could Crash 35% to $1.50!Hello and greetings to all the crypto enthusiasts, ✌
In several of my previous analyses, I have accurately identified and hit all of the gain targets. In this analysis, I aim to provide you with a comprehensive overview of the future price potential for Ripple , 📚💡
Ripple is in a clear downtrend, trading within a descending channel and approaching a key resistance level near the psychological $2 mark. A crucial support zone exists around $1.90, making it the first downside target. If this resistance fails and the psychological threshold breaks, a deeper 35% decline toward $1.50—aligned with the next major support—becomes likely. This level, marking the channel’s lower boundary, could serve as a pivotal point for price stabilization or reversal.📚🙌
🧨 Our team's main opinion is: 🧨
Ripple is in a downtrend, facing key resistance at $2, with $1.90 as support—if it breaks, a 35% drop to $1.50 is likely.
Give me some energy !!
✨We invest countless hours researching opportunities and crafting valuable ideas. Your support means the world to us! If you have any questions, feel free to drop them in the comment box.
Cheers, Mad Whale. 🐋

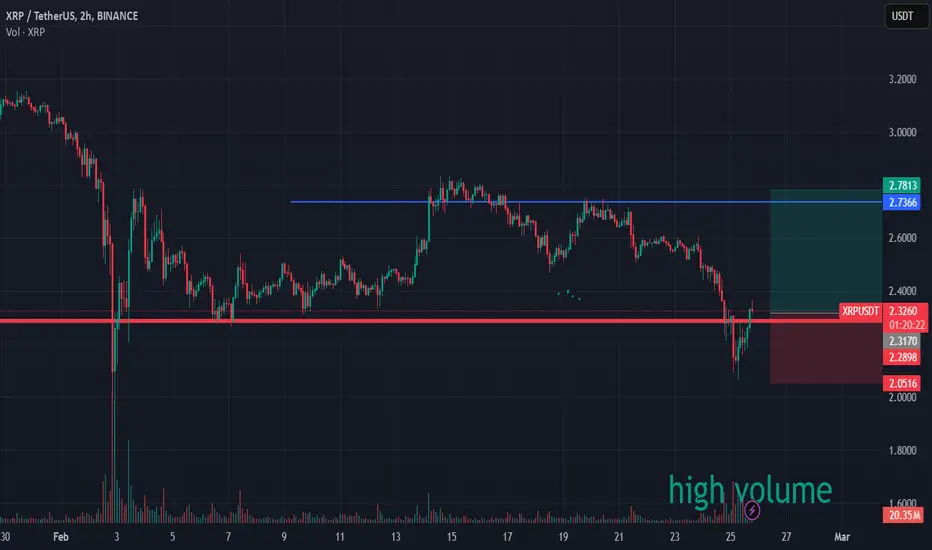
XRP within an area of high probability of risingHigh volume in a bull trap in XRPUSD, nice entry for buying, and recover the loss you had in Solana or ETH or BTC, hahhaha
XRP: Looks Much Better Now (8X)I am looking at XRP's chart and it looks much better now.
Just four days ago we looked at the chart and I wasn't convinced. Now, it looks much better, I am convinced.
Technical Analysis | XRPUSDT
It seems we are going for a higher low. I will not bore you with too many details because it is highly probable that you know all of these signals better than I.
Let's just say the candle 3-Feb. reveals a strong buying bias.
This leads to the next drop ending as a higher low. We are in higher low territory now so it is possible that from this point on XRPUSDT will grow.
It can always shake a bit more but that's normal, it just needs a mention for all those 50-100X gamblers.
Our focus is a little more long-term based. We don't have to catch the exact low price but we do want to catch the reversal of the trend.
To be honest, I don't know about the chart, but XRP is going up.
Thank you for reading.
Namaste.

IM STILL BULLISH IN THIS BEARISH MARKETTodays patterns are mimicking similar paterns back in January and if this persist we cound be looking at another 20% or greater downside for a nice oportunity to buy in the low $2 zone

XRPUSDTHi Friends.
hi BTC 87000!!!
i buy this one as spot!!! bought some 1 year ago, and now buy some again!
just hold it
