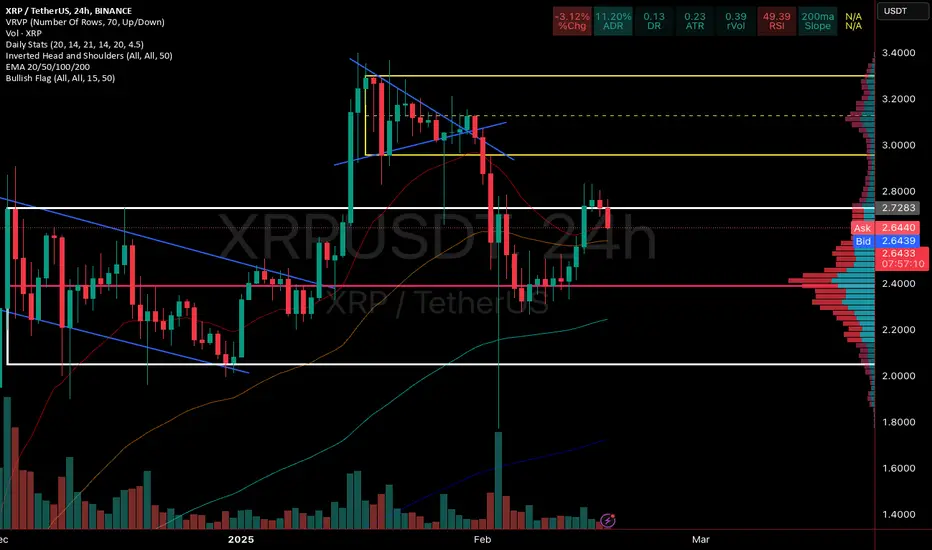
XrpusdtBearish prize rejected multiple 2.80
Revisit its recent support 2.35 if it’s not sustain
Go further strong level 2.05
XRPUSDT trade ideas

Located some DCA Levels…for XRPThis chart is for people looking to buy XRP at a discount. Located some nice DCA LEVELS
XRP

XRP Set for 200% Surge as Ripple (RLUSD) Hits Major Milestone
The altcoin XRP and its parent company Ripple have long been entangled in a legal battle with the U.S. Securities and Exchange Commission (SEC), with the key issue revolving around whether XRP should be classified as a security rather than a cryptocurrency. This lawsuit, spanning nearly five years, has undoubtedly put a damper on Ripple's momentum. However, a fresh wave of optimism is sweeping through the XRP community as recent developments suggest a significant price surge could be on the horizon.
RLUSD Stablecoin’s Supply Milestone: A Catalyst for XRP
The Ripple USD (RLUSD) stablecoin, pegged to the U.S. dollar, has recently hit a major milestone, boasting a total supply of 120 million tokens just two months after its official launch. This rapid growth underscores RLUSD’s increasing adoption and utility, particularly within the XRP Ledger (XRPL).
According to blockchain analytics platform CryptoQuant, RLUSD initially gained traction on the Ethereum blockchain at launch. However, the stablecoin has since pivoted, showing accelerated growth on the XRPL — a shift that highlights the XRP Ledger’s growing ecosystem and liquidity. Notably, RLUSD’s adoption has been bolstered by recent listings on key platforms, including the high-leverage trading platform Margex and the Zero Hash platform. Furthermore, its availability for trading on Revolut has pushed it further into the mainstream financial sphere.
This expansion push has directly contributed to the surge in RLUSD supply, strengthening the underlying fundamentals of the XRPL ecosystem. With the stablecoin's liquidity deepening, XRP's future rally seems all the more likely.
Bullish Flag Pattern Signals 200% Surge
From a technical standpoint, XRP’s price action paints a compelling picture. As of this writing, XRP is trading at $2.56, down by 3.76% in the last 24 hours — a dip that analysts suggest is merely a temporary retracement after its recent climb to $2.78.
A closer look at the 4-hour price chart reveals the formation of a bullish flag pattern — a classic continuation pattern often signaling that an asset is poised for further upside. The pattern, characterized by a sharp upward movement (flagpole) followed by a period of consolidation (flag), suggests that XRP is gathering momentum for its next breakout.
Adding to the bullish case is the Relative Strength Index (RSI), currently at 46. This reading indicates that XRP is neither overbought nor oversold, suggesting room for upward movement. The recent pullback appears to be a healthy market shakeout, allowing XRP to gather strength before testing new resistance levels.
The key resistance to watch is $2.78, XRP’s recent high. A decisive break above this level could open the doors for a 200% surge, potentially propelling XRP towards the $7.50 mark in the coming days.
RLUSD’s Role in XRP’s Liquidity Boost
Beyond the charts, XRP’s fundamental outlook is equally promising. The growing adoption of RLUSD within the XRPL ecosystem serves as a critical liquidity boost for XRP. As more RLUSD tokens circulate, they inject additional liquidity into the XRPL, enhancing the utility of both the stablecoin and XRP itself.
Conclusion
Traders and investors should keep a close eye on the $2.78 resistance level — a breakout above it could mark the beginning of XRP’s next explosive move. As RLUSD continues to expand and XRP's ecosystem gains momentum, the stage seems set for a powerful rally.
Stay tuned, and prepare for what could be a historic run for XRP.

$XRP⏰ CRYPTOCAP:XRP Outlook 2.18.25
Currently 2:00 pm est. seems we are failing $2.52 FVG and will head lower towards our support level $2.42.

Leading diagonalAs we did not get a push up to ~3$ it's starting to look like a leading diagonal(3-3-3-3-3). Looks like we will be moving sideways for a little bit longer.

XRP USDT ( Ripple Analyse )I'm thrilled to share a new analysis for XRPUSDT. Currently trading around the $0.5180 area, XRP is exhibiting a Bullish Shark Pattern on the chart, indicating a potential bounce from this level.
Our projections for XRP are as follows:
Target 1 (TP1): $0.5950 (15% potential gain)
Target 2 (TP2): $0.65 (25% potential gain)
Target 3 (TP3): $0.82 (58% potential gain)
These targets are considered mid to long-term objectives. The chart indicates a 4-day timeframe, suggesting a patient approach.
We've initiated our position in XRP from this zone and will keep you updated on further developments.
Wishing everyone profitable days ahead!

XRP 24hr potterboxesXRP 24 hr potterboxes . Well, it looks like ZRP has gone down and touched the 50 percent mark of the lower box.$2.400ish it came up to the top of the box and is now headed back down to the 50 percent line. $2.400 ish of the lower box. just keep a eye on it.
XRPUSDT: UptrendOn XRPUSDT as you can see on the chart, we are in an uptrend with these buying candles and the break of the resistance line and the vwap indicator.


XRP Ripple: 34%+ Potential Bull Run Ahead!🚀 XRP Ripple: 34%+ Potential Bull Run Ahead!
🧐 Analysis:
✅ Monthly FVG Tapped – Key Market Structure Reaction 🎯
🔄 Daily Bullish FVGs Forming – Signs of an Upside Move 📈
📉 Weekly Bearish FVG – Price may dip before a bounce 🔽
🟢 Daily Order Block – Strong Buy Zone for Bullish Start 🚀
🎯 Plan: Looking for price to react at the daily OB and expecting a 34%+ rally if the bulls take charge! 🔥📊

XRP SHORTIf we break through the slope, we can go 1/3 to pick up the imbalance. Breakdown of MA 20 and 50 minimum will reach 100 MA

XRPlooks bulllish
xrp is one of the few coins sending bullish signals
2 possible scenarios ,check out lower time frame for confirmations
good luck
SL

Xrp shortWe see a lot of sales in this range and it can reach its goal in the coming days
Even if it penetrates a little higher, it does not last and returns

3$?I think we could see a push towards 3$+ IF wave 4 is complete, to me it looks like it but only time will tell

Xrp shortSame trade till moving along nice.
Purple boxes are my targets.
Likely the start of a drop to 1.60

XrpStill like it
Purple boxes are my targets.
Same trade from last night.
Likely the start of a pull back to 1.60 area

$XRPBullish sentiment for $XRP.
As we bounce off lower support, we're looking to cross $2.81 Order Block (OB). If we are able to break above with a solid retest, we may be on our way too $3 heading into the new week.
If we fail to break above $2.81, we may slide back down towards $2.75.
There have been plenty of ETF(s) filed, plus rumors of David Sachs announcing the government moving ahead with crypto reserves. Which would include XRP, we are still waiting for clarification.

#XRPUSDT is testing key resistance—expecting a correction!📉 LONG BYBIT:XRPUSDT.P from $2.8320
🛡 Stop Loss: $2.8025
⏱ Timeframe: 1H
✅ Overview:
➡️ BYBIT:XRPUSDT.P is showing strong bullish momentum after breaking out of the consolidation zone, supported by increasing volume and a breakout above 2.8301.
➡️ The price continues its upward movement, and the current accumulation suggests a possible further rally.
➡️ POC (Point of Control) at 2.4307 indicates a major liquidity level, making a deeper retracement unlikely in the short term.
⚡ Plan:
➡️ Long from 2.8320, considering the current trend and demand zone confirmation.
➡️ Stop Loss: 2.8025 to minimize risk in case of a false breakout.
🎯 TP Targets:
💎 TP1: 2.8720 – the first resistance level where partial profit-taking is recommended.
💎 TP2: 2.9220 – the next key level for securing the remaining position.
📢 BYBIT:XRPUSDT.P is showing strong buying interest, and as long as the trend remains bullish, further upside potential exists.
📢 Keep an eye on resistance reactions, as profit-taking by larger players could trigger local corrections.
📢 If 2.9220 is broken with confirmation, further movement toward 2.9670 is possible.
🚀 BYBIT:XRPUSDT.P remains in an uptrend — expecting TP targets to be reached!

XRP - Same chart Still rolling in XRP, I like the hype, strength, and retail demand on this one, XLM is also a sleeper here.
Watching that $2 area if I can load a bag, my target is $4.
Own long term in exchange, Trade short term in Robinhood, DCA and dump.
Not financial advice, GTLA

XRPCRYPTOCAP:XRP has completed a Liquidity Sweep of the CRT low.
If we are able to break through the 50% target of $2.83, our next price target will be $3+. With more ETF news on the horizon, retail adoption, banks offering crypto options, and the new Administration being bullish. We should shoot through the $3 price target eyeing a new ATH towards the end of the month.
Stay tuned for more manipulation.

XRP Primary Macro AnalysisBINANCE:XRPUSDT
### Ripple (XRP) Technical Analysis
Current Market Overview:
Despite fluctuations in price action, my analysis of Ripple’s XRP indicates a continued bullish outlook. We appear to be entering a new distribution phase that may lead to a multi-month "boring" wave pattern, specifically reflective of a wave structure maintaining its corrective integrity as outlined in a 3-3-5 format.
Wave Structure Analysis:
1. Bullish Outlook: The primary analysis suggests that XRP is positioning itself for significant gains as we transition into this new distribution phase. The structure hints that we might be witnessing wave formations that typically precede substantial price movement.
2. Flat Formation: Based on current data, a flat formation seems to be the most likely scenario. This pattern could suggest a period of consolidation before XRP potentially embarks on its next bullish move. However, it is crucial to note that market conditions can change rapidly, and traders should remain vigilant for shifts in sentiment or structure.
3. Adjusting the Higher-Degree Wave Count: There is also the prospect of adjusting our higher-degree wave count to suggest that the waves 3 and 4 have already completed. If this is the case, we are likely in the process of forming the 5th wave, which typically unfolds as an impulsive structure. This potential progression signifies further bullish momentum and enhances the likelihood of an upward breakout.
4. 3-Wave vs. 5-Wave Structure: The critical consideration lies in determining whether the unfolding price action represents a 3-wave or 5-wave structure.
- 3-Wave Structure: If the price development follows a 3-wave structure, it may indicate that we are in a corrective phase, which could lead to further consolidation without immediate bullish resolution.
- 5-Wave Structure: Conversely, if we are indeed establishing a 5-wave structure, this pattern would suggest a more robust bullish movement on the horizon, often culminating in a breakout and subsequent price rally.
Key Levels to Monitor:
- Carefully observe how XRP reacts around the probable wave boundaries and consolidation areas. If price action reveals strong support at specific retracement levels, this could confirm the continuation of the bullish thesis.
- Potential breakout levels for wave 5 should be monitored closely, as decisively breaking above these points would reinforce the bullish case.
Conclusion:
In summary, Ripple's XRP is approaching what appears to be a pivotal moment, with a strong bullish outlook underscored by the potential for multi-month consolidation patterns. The formation of a flat structure currently appears most probable, yet the possibility of adjusting higher-degree wave counts remains viable. The crucial aspect of this analysis hinges on determining the nature of the unfolding wave structure—whether it manifests as a 3-wave or a 5-wave pattern will significantly influence the future price trajectory. As developments continue, traders should keep a close watch on key levels and remain adaptable to changing market dynamics.


It's a bit late...but not everything is lost!BINANCE:XRPUSDT
XRP has already broken a Symmetrical Triangle actually It's a bullish break so It leaves no doubts that It would Increase as much as the measured movement (AB=CD)👌
It's in the middle of the way,but we can still take some profit of it!
⚠️ Disclaimer:
This is not financial advice. Always manage your risks and trade responsibly.
👉 Follow me for daily updates,
💬 Comment and like to share your thoughts,
📌 And check the link in my bio for even more resources!
Let’s navigate the markets together—join the journey today! 💹✨
