XRP: 100% Gain in couple of weeks!Get ready for 100% surge in the coming weeks, but before that another low to grab liquidity is essential.
Place your buy order around 2$ mark and enjoy.
XRPUSDT trade ideas
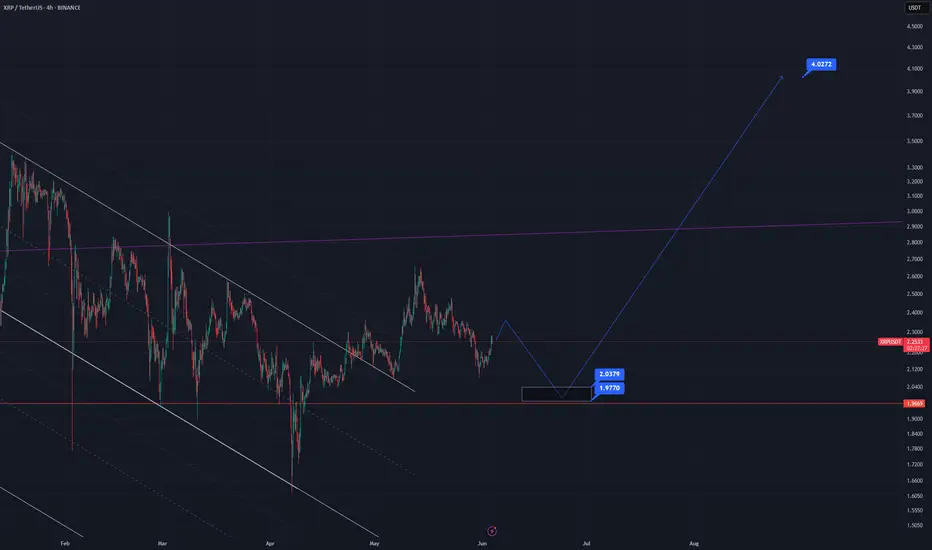
XRP’s Descending Trendline Showdown: Is a Breakout Toward $4From a purely technical‐analysis standpoint (not financial advice), here are a few observations and ideas you can take into xrp/usdt
1. Descending Trendline Resistance
- Price has been making lower highs, forming that yellow descending trendline. A sustained break and close above it (on higher‐than‐average volume) would be a strong bullish signal.
- If price rejects at the trendline again, that often implies more consolidation or another leg downward, so watch how price reacts if/when it retests that line.
2. Moving Average Context
- It looks like the market is hovering near or just below a key moving average (blue line). If the price can reclaim that moving average and stay above it, it typically signals renewed bullish momentum. Conversely, continued closes below it can cap upside.
3. Key Support Zones
- The pink/gray box in the chart (roughly the 2.0–2.1 area) seems to be an important support region; buyers have stepped in there before.
- Below that, the 1.77–1.80 area looks like a major support “floor” (dotted line). If price were to break below that, it could trigger a deeper pullback.
4. Potential Upside Targets
- The horizontal level around 3.40 is the next big resistance if price can break out above the descending trendline.
- If bulls really take over and push through that 3.40 zone, a run toward 3.90–4.00 (as shown by the arrow) becomes more plausible.
5. Watch Volume and Momentum**
- Pay attention to volume on any breakout. A low‐volume push above the trendline can be a fakeout, whereas a strong volume surge confirms conviction.
- Oscillators (RSI, MACD, etc.) can help you gauge whether momentum is building or fading as price approaches resistance.
Overall, a breakout above the descending trendline plus a reclaim of the moving average would favor upside toward the mid‐3s or higher. Failure to break out, however, might lead to another test of that 2.0–2.1 support or even the 1.77 floor. Keep risk management in mind either way.

XRP may go furthermore!In my opinion, CRYPTOCAP:XRP has the opportunity to surpass $4 in the near future. It needs some rest and range above $3, and then the rising trend will start again.

Weekly trading plan for XRPLast week, BINANCE:XRPUSDT demonstrated strong bullish momentum, hitting all our projected targets. Currently, price is facing rejection at resistance. Locally, we've drawn a trendline - a breakdown would initiate downside movement toward support levels. Until that break occurs, we retain potential for new ATH
As always, manage your risk wisely

Xrp:The fate of Ripple in the long termhello friends👋
After a good price growth that we had, you can see that the buyers gradually exited and a triangle pattern was formed.
Now, according to the specified support, it should be seen whether buyers support Ripple or not...
You have to wait and nothing can be said until the failure of the pattern, but we suggest that you buy step by step with capital and risk management in the identified areas that are very good supports and move to the set goals.
And in the end, we must say that don't forget that we are in a strong upward trend, that the probability of the continuation of the Bister trend is the possibility of a fall...
🔥Follow us for more signals🔥
*Trade safely with us*

XRP USDT SHORT TRADE SETUPXRP/USDT is currently holding at a strong resistance zone, with a high probability of an downward price move. With a very good risk reward trade.

Make WAYYYY for !!! ~~ XRPPP!! ~$3.1?XRP as suggests moves if it doesnt breaks the red box or just pukes below, eitherways looks strong enough

XRP-- Ripple Hi everyone
Xrp can have another upward leg and there exists some fundamental support.
So in my opinion these levels are good to buy some.
DYOR!
Good luck

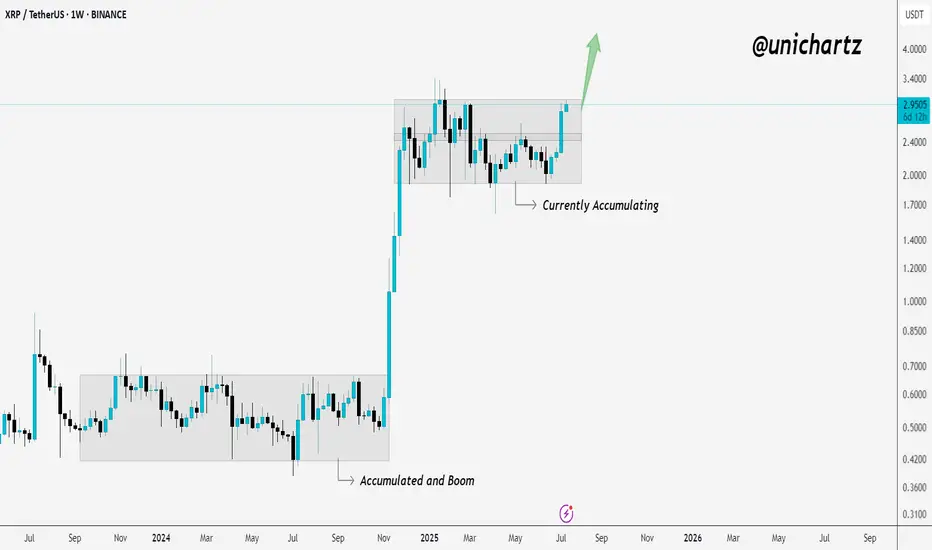
Accumulation Ending? XRP Showing Signs of BreakoutXRP is in the process of breaking out of its weekly accumulation range.
The last time we saw this kind of structure — it led to a massive move.
Now, price is pushing toward the top of the zone again… and momentum is picking up.
If it closes strong above this level, it could trigger the next big leg higher.
Stay alert — this could be the start of something big!
XRP | Trade Setup📌 After the breakout from the last high at 2.6, a bullish sequence (green) has now been activated.
📊 These setups typically occur no more than twice per year on any given altcoin, so I’ll be aggressively buying each level at the B-C retracement area.
Trademanagement:
- I'm placing long orders at each level. ((If the price continues climbing, I’ll adjust the trend reversal level (green) accordingly and update my limit orders.)
- Once the trade reaches a 2 R/R, I’ll move the stop-loss to break-even.
- From a 3 R/R onward, I’ll start locking in profits.
✅ I welcome every correction from here on —
but I won’t enter any new positions at these top levels.
Stay safe & lets make money

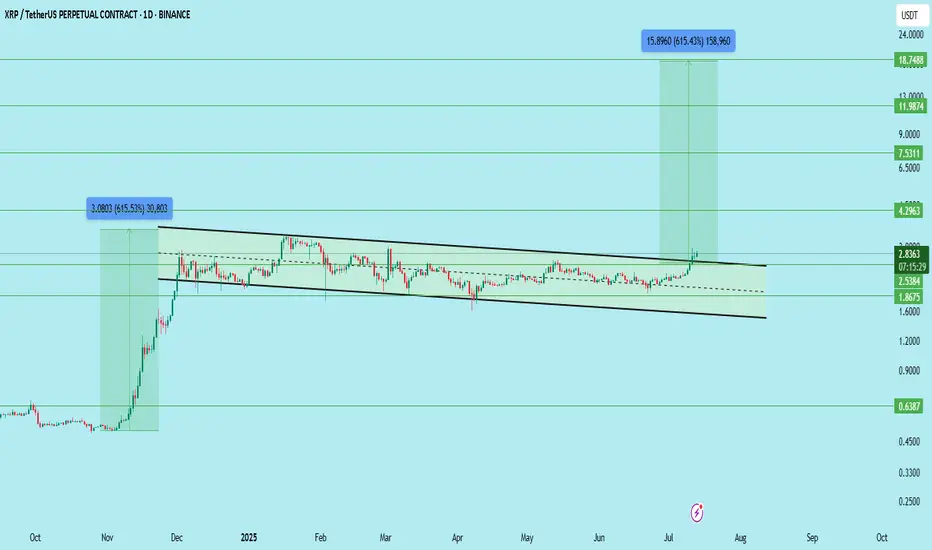
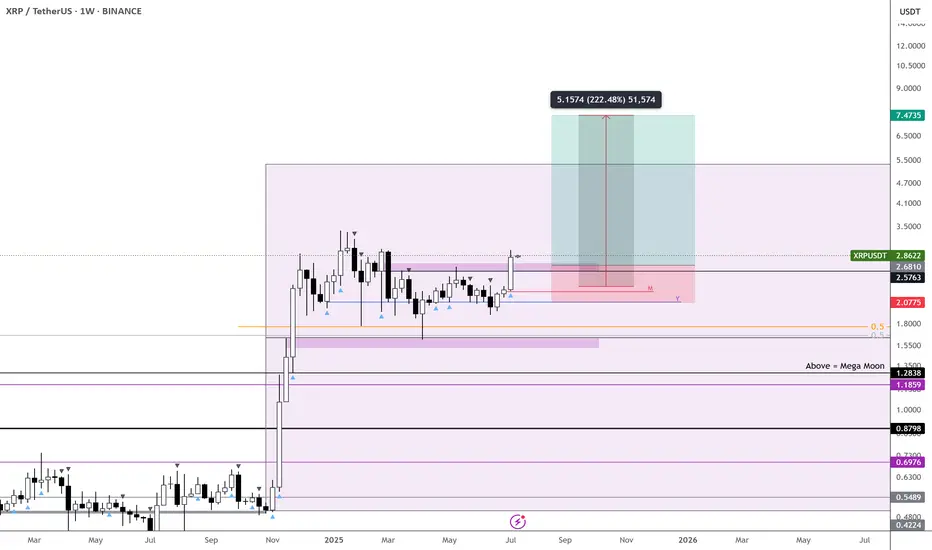
XRP/USDT – Long-Term Breakout Setup FormingXRP has broken out of a multi-month falling channel and is showing early signs of a macro bullish shift. However, price has printed a series of strong green candles, so waiting for a clean retest before entry is advised.
Key Levels:
Support Zones: 2.5384 | 2.00 | 1.8675
Resistance Zones: 2.8340 | 4.2963 | 7.5311 | 11.9874 | 18.7488
Breakout Level: 2.5384 (channel breakout and current structure retest area)
Setup Strategy:
Entry (Ideal): On retest near 2.53–2.60 support zone
Stop Loss: Below 2.00 (or tighter depending on risk appetite)
Target 1: 4.2963
Target 2: 7.5311
Target 3: 11.9874
Target 4 (Final): 18.7488
Upside Potential: Over 600% if the structure plays out fully
Structure Insight:
Multi-month falling channel breakout confirmed
Continuous green candles suggest short-term overextension
Safer entry lies in retest and hold of the breakout zone
Long-term accumulation zone forming between 2.53–2.83
This setup favors long-term investors and swing traders waiting for a macro move. Let the price come to you — avoid chasing.
DYOR | Not Financial Advice
#XRP #Ripple
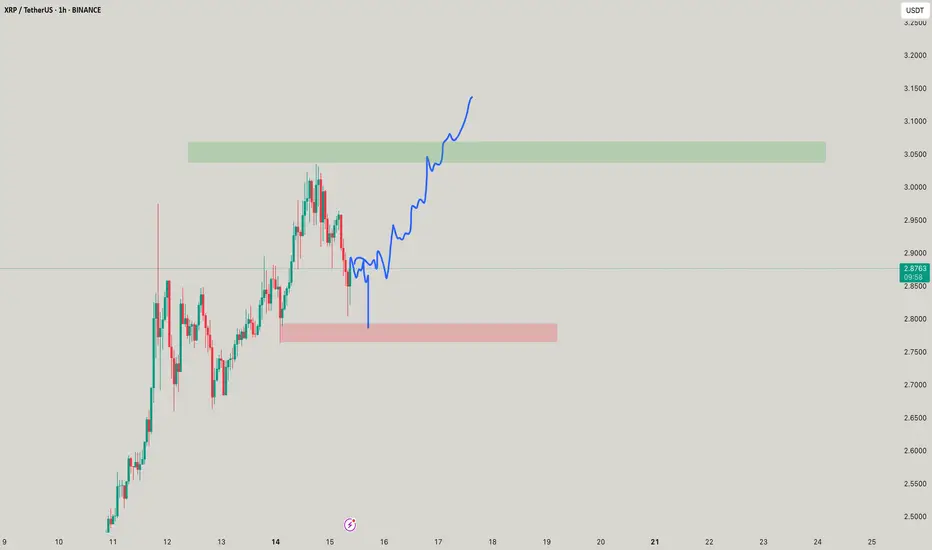
XRP: Bullish Continuation is Imminent!Keep an Eye on XRP
Now is the time to watch XRP. If the price breaks to the upside, we could see a significant move that might take it above $2.95!
Trading Setup
If you’re considering trading XRP, here’s a quick setup that may help you.
The idea is: Buy when the price breaks above $2.5 and take profits at the levels shown in the chart.
Targets:
1. $2.6
2. $2.75
3. $2.95
-------------------------------------------
About our trades:
Our success rate is notably high, with 10 out of 11 posted trade setups achieving at least their first target upon a breakout price breach (The most on TW!). Our TradingView page serves as a testament to this claim, and we invite you to verify it!

XRP – Dual Trends Active, Ready to Outperform - $7 Incoming
Two active trends on CRYPTOCAP:XRP right now—monthly and weekly confirmations are in, which significantly boosts the probability of hitting the first target.
Honestly, I see this outperforming CRYPTOCAP:ETH , though both are worth holding.
With both timeframes aligned, I’m expecting a strong move.
Targeting $7 on CRYPTOCAP:XRP and over $7k on $ETH.
XRPThe primary regulatory catalyst boosting XRP's bullish outlook in 2025 is the resolution of Ripple Labs' long-standing lawsuit with the U.S. Securities and Exchange Commission (SEC). In March 2025, Ripple settled the case by agreeing to pay a $50 million fine, and crucially, it was clarified that XRP is not considered a security in the context of secondary market sales. This settlement removed years of significant regulatory uncertainty that had suppressed XRP's price and led exchanges to delist XRP. Following this resolution, major U.S. exchanges reinstated XRP trading, and institutional confidence in XRP surged, unlocking large-scale adoption and market participation by regulated investors.
Another key regulatory development providing bullish momentum is the passage of the GENIUS Act in the U.S. House of Representatives, approved around mid-July 2025. This legislation establishes a clearer federal framework for stablecoins and digital assets like Ripple's RLUSD stablecoin, further reducing regulatory risks and positioning XRP for broader mainstream utility and adoption.
In summary, the decisive legal settlement with the SEC and U.S. legislative progress (notably the GENIUS Act) have greatly clarified XRP's regulatory status, providing a green light for institutional entry through regulated channels such as exchange-traded funds (ETFs). The proliferation of XRP ETFs—including the approved ProShares XRP Futures ETF—amplifies this effect, enabling easier institutional and retail investment and fueling bullish price momentum
XRP Real-Life Use Cases in Finance
XRP REAL LIFE APPLICATION IN THE ECOSYSTEM.
1. Cross-Border Payments
XRP’s core financial use case is to act as a bridge for cross-border payments.
Traditional international money transfers often take days and involve high fees due to intermediary banks (the SWIFT system).
With XRP, financial institutions can instantly convert and transfer value across borders. Typical settlement times are 3–5 seconds, with transaction costs usually less than a cent.
Numerous global banks and remittance providers have adopted XRP and the RippleNet system to cut costs and provide real-time international payment services.
2. On-Demand Liquidity (ODL) & Liquidity Bridging
Banks and payment providers use XRP to manage liquidity.
With XRP as a bridge currency, financial institutions do not need to pre-fund nostro accounts in multiple countries. Instead, they can source liquidity ‘on demand’ using XRP, freeing capital and reducing operational costs.
On-demand liquidity flow improves cash efficiency and speeds settlements between a wide variety of global fiat currencies.
3. Micropayments
Due to low fees and fast settlement, XRP is suitable for micropayments.
This enables new use cases in digital content (e.g., pay-per-article, tipping creators) and gaming, where sending tiny amounts is otherwise unfeasible.
Such micropayment abilities open the door to innovative business models in finance and online services.
4. Tokenization and DeFi
The XRP Ledger supports tokenization of financial assets and decentralized finance (DeFi) use cases.
Financial firms can issue stablecoins or tokenized assets (including stocks, bonds, or other real-world assets) on-chain, fostering new kinds of investment products, automated trading, and settlement.
XRP’s ledger powers “sector-based index funds,” asset baskets, and other financial instruments, expanding real-world utility within decentralized finance.
5. Remittances
Remittance companies use XRP to offer faster and cheaper international transfers.
This is particularly valuable for migrant workers sending money home, reducing transaction times from days to seconds and cutting fees, thereby increasing the amount recipients receive.
6. Banking and Trade Finance
Some banks and trade finance platforms use XRP to improve operational efficiency.
By digitizing trade documentation and facilitating instant payments, XRP is helping modernize the traditionally slow and paperwork-heavy trade finance sector.
7. Collateral & Trading
XRP can be used as collateral in digital asset trading and arbitrage.
Traders and financial institutions leverage XRP for high-speed transfers between exchanges, using its liquidity to seize arbitrage opportunities and service margin calls rapidly.
Countries adopting XRP for real-life payments, especially cross-border transactions, include several key nations across Asia, the Middle East, and beyond. Here are some notable examples of countries actively integrating XRP into their financial systems and payment infrastructures as of 2025:
Japan: A pioneer in cryptocurrency adoption, Japan has multiple banks partnered with Ripple using XRP to streamline cross-border payments. The Bank of Japan and major institutions like SBI Holdings support XRP integration to provide faster, lower-cost international transactions across Asian markets.
United Arab Emirates (UAE): The UAE is proactively integrating blockchain technology, including XRP, with banks such as Zand Bank and fintech firms using Ripple’s platform for faster cross-border payments. Dubai’s financial initiatives leverage XRP to boost transaction efficiency within and beyond the region.
South Korea: Known for its vibrant tech ecosystem and supportive crypto regulations, South Korea has seen local banks experimenting with XRP to reduce international payment costs and increase speed, making it part of the broader fintech innovation landscape.
Mexico: Financial institutions in Mexico use XRP to improve remittances, especially those coming from the U.S., reducing processing time and fees significantly.
India: Given its large remittance market and fintech growth, India is exploring the use of XRP to address the need for low-cost, quick international payments.
Singapore: XRP adoption is growing here, with increasing numbers of users and integration of Ripple’s stablecoin RLUSD into payments.
United States: Some American banks and financial institutions are starting to integrate XRP for international payments, signaling growing institutional interest.
Canada: Banks like Canadian Imperial Bank of Commerce (CIBC) and remittance services use Ripple technology, including XRP, to enable faster cross-border money transfers.
Brazil: Various financial players collaborate with Ripple to modernize the country’s payment infrastructure using XRP.
United Kingdom: Institutions and fintech firms in the UK leverage Ripple’s technology for faster, cheaper international transactions.
Thailand and Sweden: Banks in these countries are partnering with Ripple to enhance their cross-border payment capabilities by leveraging XRP.
Egypt: Major banks are collaborating with Ripple to improve payment efficiency, including through XRP-based solutions.
In essence:
XRP directly addresses major friction points in global finance by cutting costs, increasing speed, and providing new ways for banks, companies, and individuals to move and manage money—all with increasing real-world adoption in cross-border payments, liquidity management, and digital asset innovation.

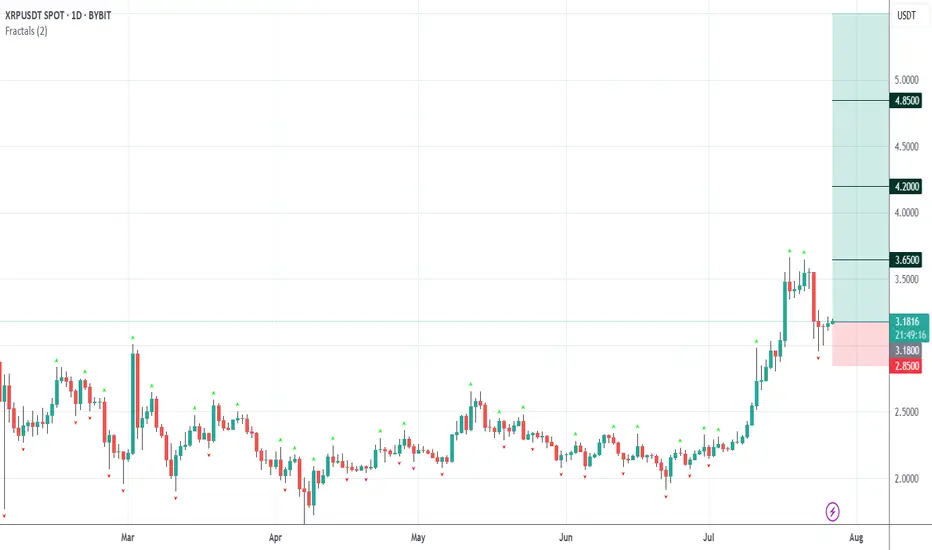
XRPUSDT - Analysis for Immediate Long Entry1. Chart Analysis
First, let's confirm the technical setup on the daily chart.
The chart shows a powerful rally in July, peaking around $3.60. The price then entered a retracement phase, pulling back as expected.
It has now dropped to the $3.15 - $3.20 zone. As we identified, this level is critical. It was the peak of the rally in early March 2025. The price is currently testing this old resistance level, and we are looking for it to act as new support. The most recent daily candle is green and appears to be bouncing right off this level. This is a textbook "support and retracement" setup, making it a prime candidate for an immediate long market entry.
2. Sentiment and Fundamental Analysis
Now, let's see if the news supports our bullish technical outlook.
"Nasdaq Firm Files $50M Plan to Integrate XRP into Core Operations" (13 hours ago) & "Nasdaq-Listed Firm Bets on XRP for Payments, Treasury in SEC Filing" (2 hours ago): This is highly significant and bullish news. A publicly-traded company integrating XRP into its core operations and treasury with a $50M plan is a massive vote of confidence. It signals real-world adoption and institutional interest, which are powerful drivers for price.
"Wellgistics Taps XRP for Payments, Collateral, and Income Plans" (22 hours ago): Another concrete example of real-world utility. A logistics company using XRP for payments and collateral reinforces the core use case for the token. This is fundamentally bullish.
"XRP Golden Cross Confirmed: Could This Be the Spark for a Major Breakout?" (24 hours ago): A "Golden Cross" (when a short-term moving average crosses above a long-term one) is a classic technical buy signal that many traders follow. While it's a lagging indicator, news articles highlighting it can create bullish sentiment and attract more buyers.
"Ripple CEO Exposes DeFi Power Move as 35M XRP Suddenly Changes Hands" (17 hours ago): This headline is slightly ambiguous but points to significant on-chain activity and strategic moves by Ripple's leadership in the DeFi space. Large token movements often precede significant price action and suggest strategic positioning, which in this context, appears bullish.
Overall Sentiment: The sentiment is overwhelmingly bullish. The news is not just hype; it's focused on concrete, fundamental developments like institutional adoption (Nasdaq firm, Wellgistics) and treasury integration. This aligns perfectly with our bullish technical setup.
Decision:
Proceed with the long trade. The technicals and fundamentals are in strong alignment.
The Trade Plan: XRPUSDT (Long)
The plan is set. We're entering a long position with a market entry now, around $3.18.
Entry Reason: Entering a long position as the price retraces to a key historical resistance level ($3.15-$3.20) that is now acting as support. The entry is confirmed by a bounce on the daily chart and overwhelmingly positive news about institutional adoption and real-world utility.
Stop Loss (SL): $2.85
Reason: This level is safely below the current support zone and below the recent swing low of the pullback. A break below $2.90 would invalidate the "resistance-turned-support" thesis. Placing the SL at $2.85 gives the trade room to fluctuate without stopping us out prematurely.
Take Profit 1 (TP1): $3.65 (Moonbag Target)
Reason: This target is just above the most recent high. A move to this level would confirm the uptrend has resumed. It's a logical place to take initial profits as there may be some sellers at the previous peak.
Action: At TP1, we take some profit and move the trailing stop to our entry price (~$3.18) to make the remainder of the trade risk-free.
Take Profit 2 (TP2): $4.20
Reason: This is a key psychological level and corresponds to a standard Fibonacci extension target (1.272 extension) projected from the previous major swing. It represents a logical next stop for the rally.
Action: When TP2 is hit, move the trailing stop up to the TP1 level ($3.65) to lock in profits.
Take Profit 3 (TP3): $4.85
Reason: This level aligns with the 1.618 Fibonacci extension, a very common target in strong trends, and is approaching the major psychological number of $5.00.
Action: When TP3 is hit, move the trailing stop up to the TP2 level ($4.20).
Take Profit 4 (TP4): $5.50 (Final Target)
Reason: This is our optimistic final target. It represents a significant psychological milestone and a potential area for a major trend peak.
Action: Close all remaining positions.
Conclusion:
The XRPUSDT long trade is a high-quality setup where both technical and fundamental factors are aligned. The risk is well-defined, and the profit targets offer a strong reward potential. The plan is now in place.
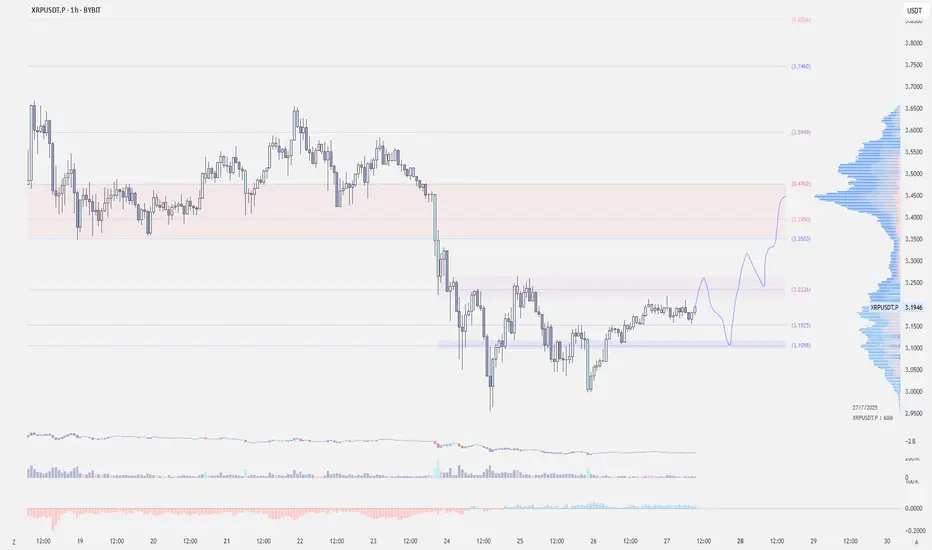
$XRP - Long Trade IdeaCRYPTOCAP:XRP | 1h
Possible retest of $3.24–3.26
If we see rejection, I'll look to enter around $3.12–3.09, targeting $3.35–3.47 (previous value area).
Stoploss set to $3.03-$3
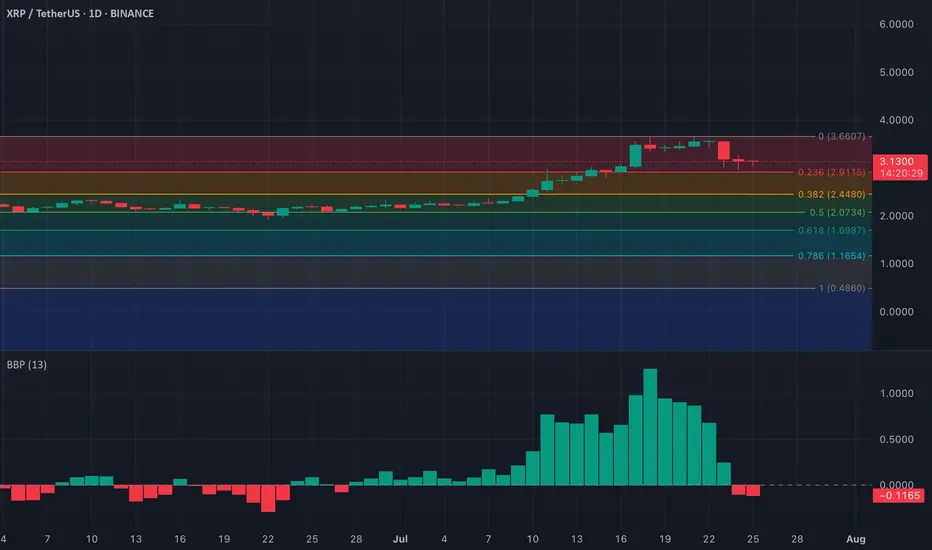
XRP – Bearish Signals from Elder-Ray IndexXRP’s bullish momentum appears to be fading, according to recent readings from the Elder-Ray Index on the daily chart. Over the past two sessions, the indicator has printed consecutive red bars, reflecting a clear shift in sentiment as buying pressure weakens.
The Elder-Ray Index evaluates the strength of bulls versus bears by measuring the difference between an asset’s price and its exponential moving average (EMA). A negative reading, like the one currently seen on XRP, means the asset is trading below its EMA — a sign that bearish pressure is outweighing bullish momentum. Traders may want to monitor closely for further downside confirmation.
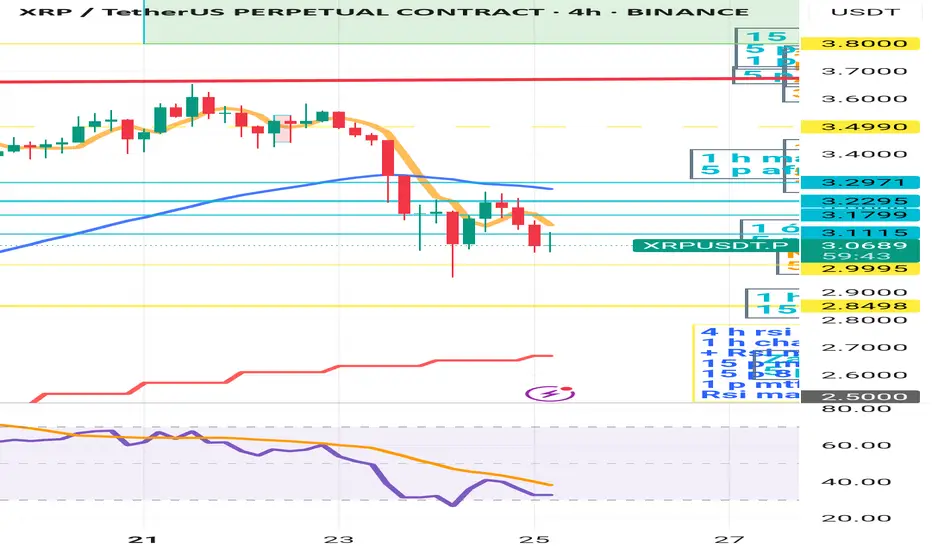
XRP is still waiting for a longI think that XRP - and looking at the Total Market Cap chart - has taken a downward trend. Although the RSI is well above 70 on the daily timeframe, the faster leg is already approaching 50. Looking at the 4-hour RSI, as long as it is below 50, I do not expect an upward movement. I see a chance for further upward movement if the chart is currently above $3.2971. It is worth watching the 4-hour 50 EMA for possible long position opening, but only if the price crosses the 4-hour 50 EMA upwards. There could be a danger if it breaks the 50 EMA on the daily, which will be around $2.7. I should add that the 4-hour 200 EMA is around $2.8, so there will be a band between 2.7-2.8 where the chart can dance before deciding which direction to take. As long as the RSI MA is above 50 on the day, long-term positions - which were started around 2023 - should not be negatively affected by this "small" sell off. I think it is worth waiting for now for longs, not to enter an upward trade into the declining chart. Attention should be focused on the 4-hour 50 ema/chart cross, and the 4-hour rsi MA 50 cross. Until these are met, starting a long is life-threatening. I am curious how you see it.
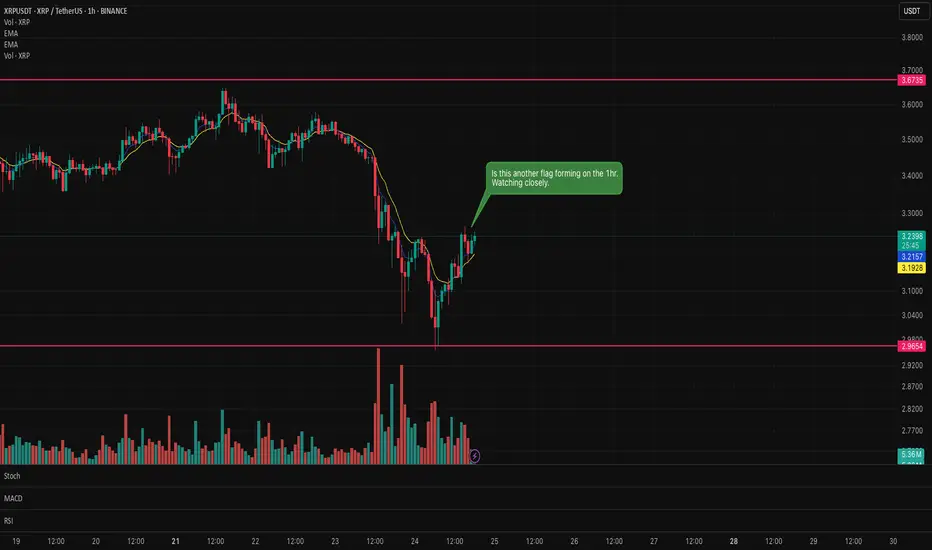
Is there another XRP flag forming on the hourly chart?Could be another flag forming on XRP. Waiting for the formation to prove confirmation as to whether it will be a bull or bear flag.
News of large amounts of XRP entering the exchanges from the CEO could mean a bear flag?
It's only appearing on the hourly so it could be a false flag.
Let's what and see what forms on the hourly candle.
XRP Bear flag confirmed. Looking for support in the decline.XRP bear flag identified on Monday 22nd has now confirmed with a nice 12% short sell.
This signals do not always confirm but when they do it is satisfying that the analysis and patience has paid off.
Trading is all about controlling emotions and being patient. Wait for the confirmation before executing.

XRP Hello friends, Ripple will probably rest a little on the middle line of the channel. Any lower is a buying opportunity, in my opinion 4.

Weekly trading plan for XRP BINANCE:XRPUSDT Last week played out perfectly - price followed our green scenario, broke through resistance, and hit all targets. Now we're clearly in a correction phase. Here's what I'm watching:
$3.16 level - Waiting for this to break before expecting consolidation in that former resistance zone
$3.30 pivot - This week's key reversal level
$3.45 resistance - If we break $3.30 but can't push past $3.45, we'll likely see the correction extend down to $3
Not making predictions here - just setting the levels that'll tell us what's next.
