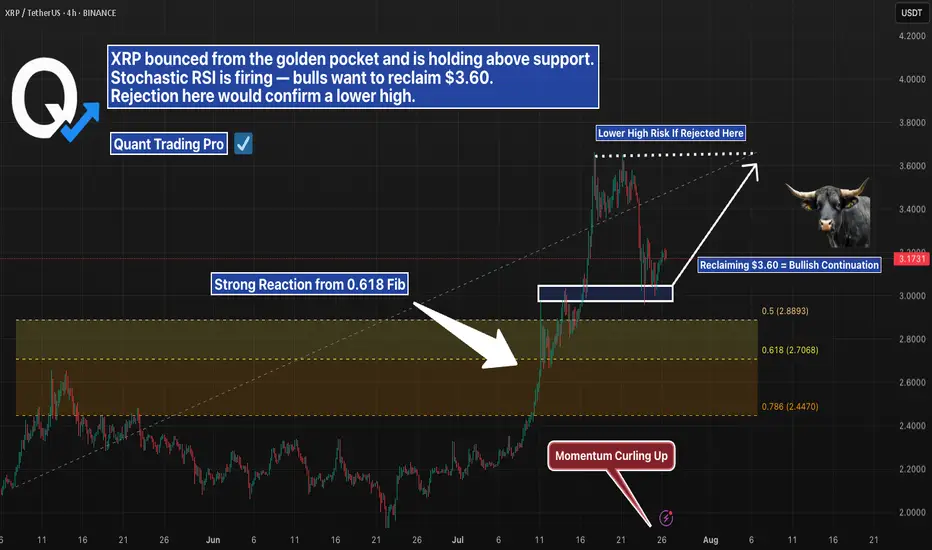
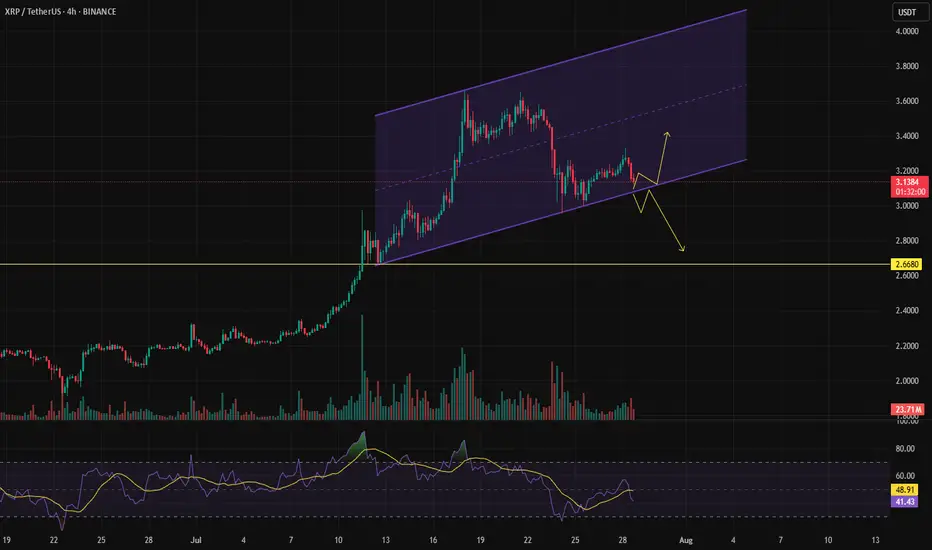
XRP 4H – Golden Pocket Bounce, But Will Bulls Reclaim $3.60?XRP pulled back cleanly into the golden pocket (0.618 Fib) after a strong rally — and buyers stepped in with force. Momentum flipped quickly, and Stochastic RSI is curling up with bullish intent.
Now price is holding above short-term support, but faces a key challenge:
→ $3.60 marks the prior high
→ Reclaiming that level would confirm bullish continuation
→ A rejection here would set up a lower high and shift structure bearish
This is a make-or-break moment for XRP in the short term. The golden pocket held — now the top of the range needs to flip.
#XRP #GoldenPocket #Fibonacci #CryptoAnalysis #StochasticRSI #LowerHighRisk #PriceAction #QuantTradingPro
XRPUST trade ideas
XRPUSDT → Range formation. Retest of resistanceBINANCE:XRPUSDT.P , after a false breakout of the daily resistance level of 3.352 and the elimination of traders, has entered a correction phase. The trading range shown below has been formed, with an emphasis on resistance...
XRP previously formed a false breakout of the daily resistance level of 3.352, as indicated in the idea above. After changing its market character, the price entered a correction phase. Focus on the range of 3.00 - 3.264. A retest of resistance (zone of interest and liquidity) is possible before falling to 3.161, 3.05 or to the liquidity zone of 3.00. There are no technical or fundamental reasons for exiting the consolidation; most likely, a retest of the zone of interest may end in manipulation and a pullback to support...
Resistance levels: 3.1609, 3.264, 3.352
Support levels: 3.05, 3.00
I do not rule out the fact that a retest of the 3.264 resistance level may have a breakout structure and the price will continue to rise, but based on the price behavior pattern on D1, the market structure, and market stagnation, I conclude that at the moment, the chances of seeing a correction from resistance are higher. Further developments will need to be considered after the retest of key zones on the chart...
Best regards, R. Linda!

XRP Potential BuyXRP will make a huge correction before taking up. This bearish pattern will last up to October of 2025. My possible prediction Price of XRP by 2026 is $12 -$15 mark up.
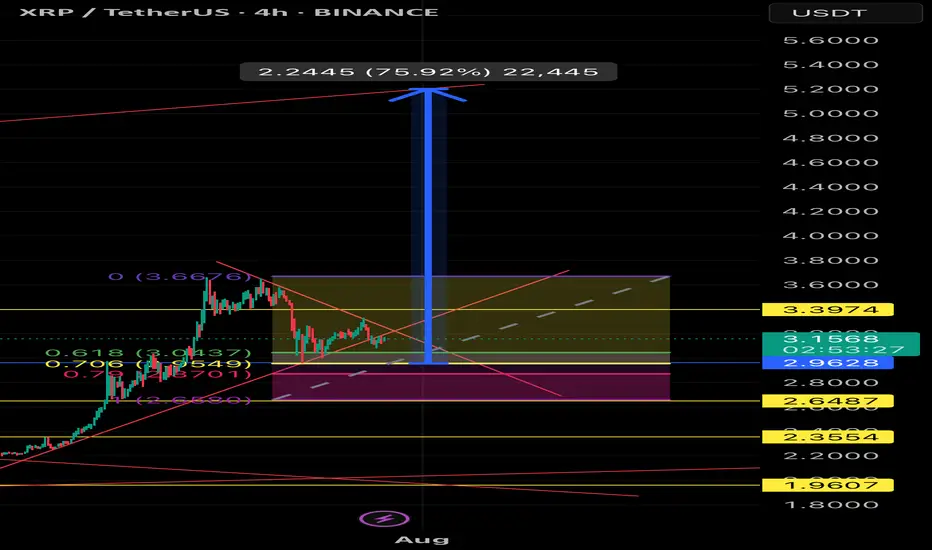
XRPUSDT Bullish Breakout Setup – 4H Chart, Fibonacci golden areaEntry: 3.16 (current level)
🛡️ Stop Loss: 2.9 (below range support)
🎯 Targets:
• TP1: 3.39 (local resistance)
• TP2: 4.50
• TP3: 5.40
• TP4: 5.90 (final target from wedge breakout – +75%)
🔍 Setup Details:
XRP is forming a bullish pennant after a strong rally. Price has held key Fibonacci retracement levels and is currently consolidating inside a wedge. A confirmed breakout could lead to a 75% move toward the $5.9 target. Volume confirmation and breakout candle close above $3.39 can accelerate the move.
⚠️ High volatility expected. Use proper risk management.
#XRPUSDT #CryptoAnalysis #Altcoins #TechnicalAnalysis #BreakoutAlert
Healthy Retest After Explosive Move – XRP Eyes More UpsideCRYPTOCAP:XRP broke out of a long accumulation range and is now coming back to retest that breakout level, a classic and healthy move.
If this retest holds, we could see the next leg up kick off soon.
Accumulated. Broke out. Now confirming.
DYOR, NFA

dump or price reversal?It's been a while that the price has been struggling with the bottom of the channel, trying to bounce back, but so far there's no sign of strength. This could lead the price to drop down to the yellow line area.
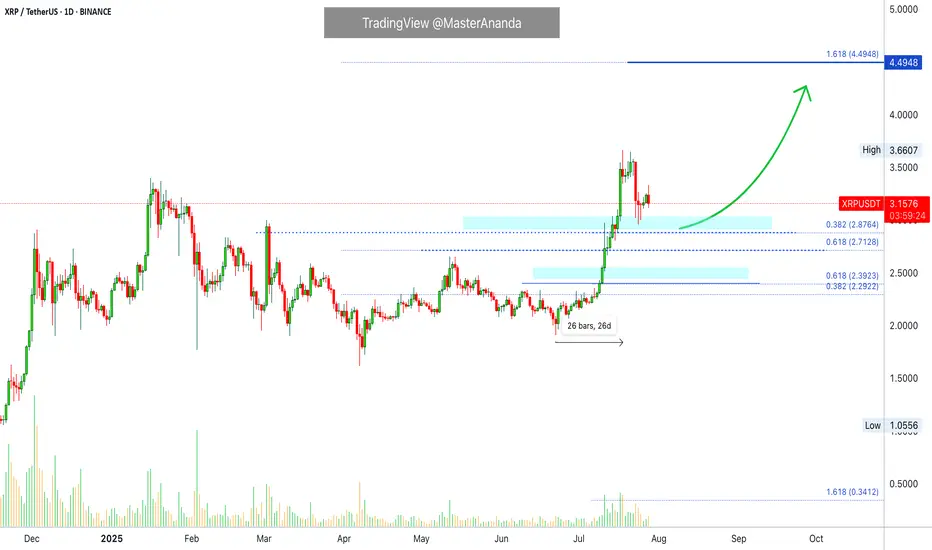
XRP Update · What To Expect Short-TermRetraces should be considered a buy opportunity. It is the only time when prices are not rising. Whenever there is a stop, a retrace, that is an opportunity to enter or buy more before the continuation of the bullish trend.
XRP started its latest major advance 22-June growing for 26 days straight peaking 18-July. there were only two red days in the entire move. This is certainly a strong advance and resulted in a new all-time high. More than 90% growth. After a strong move, there is always a pause, or correction or retrace.
A retrace can last a few days. Seeing this chart, here it can even last for weeks as I see no hurry on this chart. Prices can consolidate at support before the next advance. Some small swings are expected but nothing big and always knowing that the end result will be an advance going further toward $4.44. The bigger picture.
Do not try to SHORT within a retrace or even correction. It can lead to disaster. It is better to wait for support to show up and once confirmed buy LONG. The upside has no limitations while the downside is limited. It is harder and carries more risk, even more now that the market is bullish and people are starting to wake up. People can see the development of a major rise now, people are becoming aware and soon there will be a rush. This rush will fuel the next wave of growth.
XRP can consolidate for a little while after finding support before reaching higher. Market conditions remain strongly bullish for this pair. If support breaks, things can change.
Namaste.
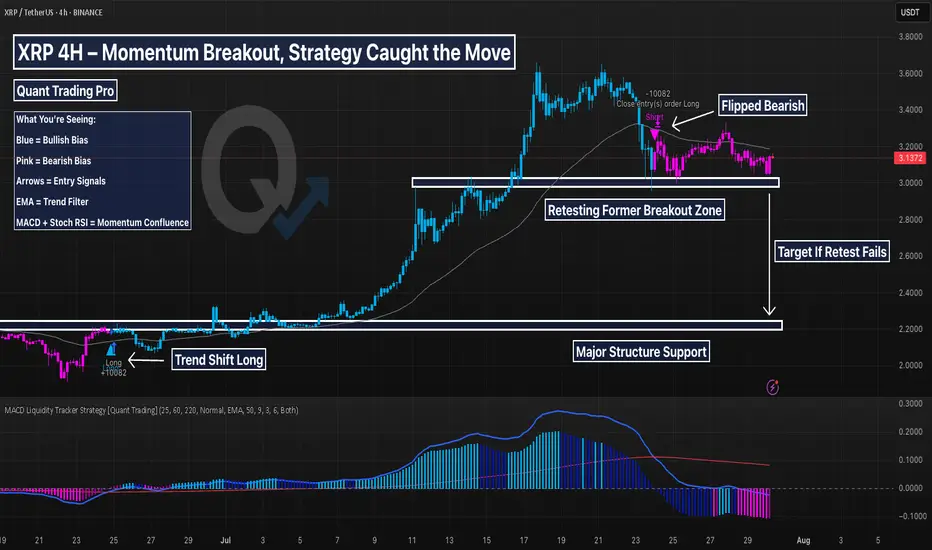
XRP 4H – This Strategy Nailed the Breakout & Tracking SupportThis XRP chart is a textbook example of the MACD Liquidity Tracker Strategy in action. After flipping bullish in late June, the system triggered a clean long and stayed in the move for over 100% before flipping bearish near the local top.
The system didn’t chase or guess — it followed clear logic:
MACD momentum confirmed
Trend aligned with EMA
State flipped blue → long triggered
Exit near top when momentum shifted
Now, XRP is in a bearish state, retesting its prior breakout zone. The MACD histogram remains below zero, and price is below the trend filter — indicating caution. But this is exactly where strategy traders prep for reversals or continuation.
🔍 Highlights:
Clean +100% trend catch
Momentum shift = smooth exit
Currently respecting support = decision zone
Still in “wait” mode — no guessing
This system shines when volatility expands. Perfect for trend traders who want clarity and control — and ideal to backtest.
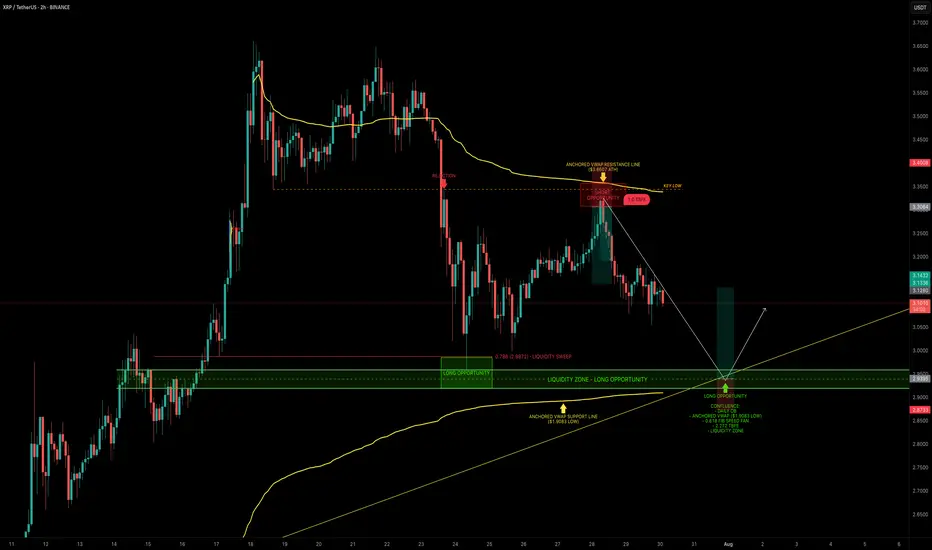
XRP — Mapping Out the Next High-Probability Long SetupXRP continues to respect key levels, delivering clean setups and strong technical reactions.
📉 Recent Price Action Recap
After the flush from $3.65 into the $3.00 support zone, XRP printed a solid bounce back toward the $3.30 resistance area, forming a clean short setup between $3.30–$3.35.
Price is now trading mid-range within the 6-day consolidation.
🟢 Next High-Probability Long Setup
A prime long opportunity lies between $2.96 and $2.9175 sitting within a key daily order block.
Confluence at this zone includes:
Liquidity pool just below the $2.9555 swing low
Anchored VWAP from the $1.9083 swing low resting just under the block
0.618 Fib Speed Fan lining up as dynamic support (July 30 – Aug 2)
2.272 Trend-Based Fib Extension at $2.9297
📈 Long Trade Setup
Entry Zone: $2.96 – $2.9175
Stop Loss: Below anchored VWAP (clear invalidation)
Target: $3.1/$3.13+
R:R: ~1:3+
💡 Educational Insight
This setup is a great example of how multiple tools layered together (like Fibonacci levels, VWAPs, order blocks and liquidity zones) can significantly increase the probability of a trade playing out.
When structure, volume-based tools and time alignment all point to the same area, it creates a high-confluence trade zone. These are the areas where risk is most defined and reward is most favourable, a principle every technical trader should anchor their strategy around.
_________________________________
💬 If you found this helpful, drop a like and comment!
Want breakdowns of other charts? Leave your requests below.
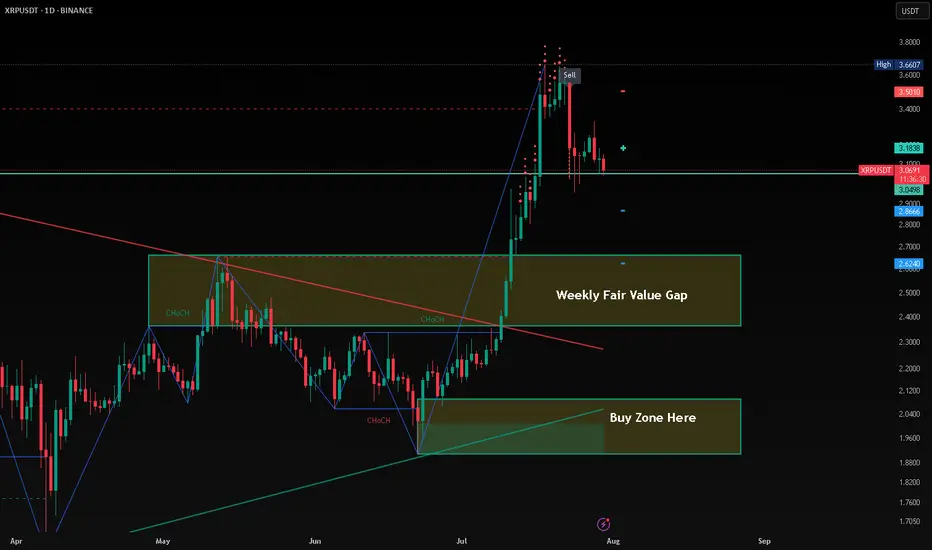
XRP | Full AnalysisHere is the full analysis for CRYPTOCAP:XRP as requested 🫡
Let’s start with the weekly timeframe:
With the recent breakout above the $3.40 high, we’ve activated a new, larger bullish sequence on the weekly chart. This sequence has its target region between $6.57 and $7.84, which I believe we will reach at minimum during this bull run.
From now on, every pullback into the B-C correction area (turquoise) can be considered a legitimate re-entry opportunity.
Daily chart:
We successfully broke the all-time high with another breakout sequence (orange), which has already completed its target region.
Now, we’re trading the overall correction level — this is the same area as the B-C correction area from the weekly timeframe. It’s the Fibonacci retracement drawn from the start of the move to point C.
Local Price Action:
After reaching the target zone (orange), we activated a new bearish sequence in the upper region, which has just completed its target zone.
Now we expect a move back into the overall correction level (blue), and after that, according to the rulebook, the next legitimate U-turn could follow.
It gets really interesting if we enter the overall correction level and then start forming a bearish structure on the lower timeframes — this is where we can apply a multi-timeframe approach, which significantly increases the probability of a successful trade.
-----
Thats the my full Analysis for CRYPTOCAP:XRP , hope it was helpful if you want me to do another analysis for any other pair just comment down below.
Also, if anyone is interested in how my trading system works, let me know and I’ll post some educational content about it.
Thanks for reading❤️

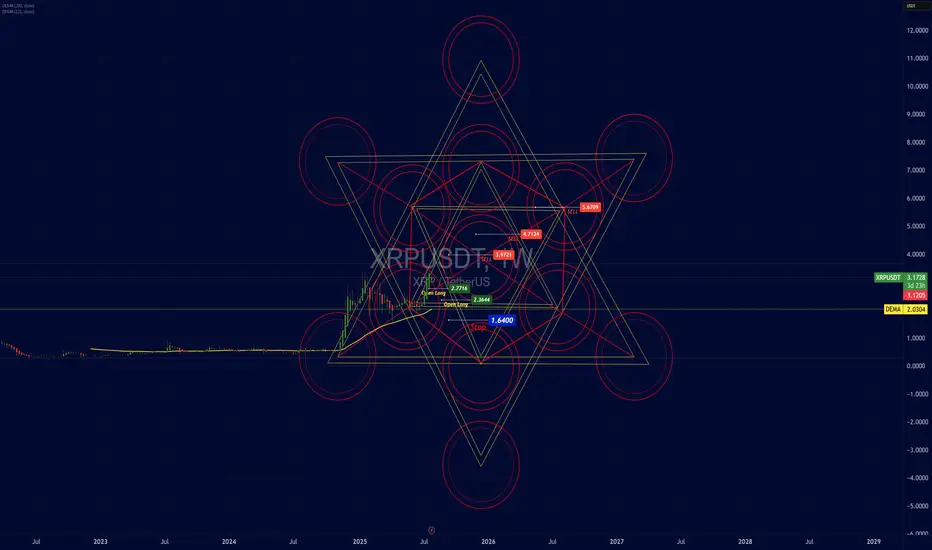
Analytical Geometry Strategy Applied to the Market — XRP/USDTAnalytical Geometry Strategy Applied to the Market — XRP/USDT
Position Trader: Action Based on the Structural Geometry of the Metatron's Cube
Operational Introduction
In medium to long-term strategic positioning (position trading), market entry must not be random or emotional — it must be grounded in predictable zones of symmetry and imbalance.
For that, we apply Analytical Geometry to chart structure, using the Metatron’s Cube — a three-dimensional geometric figure composed of 13 spheres and 78 interlinked vector lines.
The cube is a projection from a six-dimensional hyperplane onto the 2D Cartesian plane. Its application on the chart allows us to:
Delimit areas of vector confluence (support/resistance)
Identify angular energy zones and technical pressure points
Anticipate critical price inflection points based on mathematical symmetry
Structural Application on the XRP/USDT Chart
The projection of Metatron’s Cube onto the XRP/USDT chart reveals:
Entry points (Open Long) located at the lower inner vertices of the cube, where vectors converge toward the central axis — the liquidity attraction point
Supply zones (Sell) aligning with circular and angular intersections of the lines, where multiple vectors overlap — indicating movement saturation and possible redistribution
Stops placed below the angular base, representing a break in symmetry (the point where the vector loses cohesion with the model)
Structural Coordinates (Based on Vector Analysis)
Entry Points (Open Long):
Point A: (x = 2.6444, y = 0)
Point B: (x = 2.7176, y = 0)
Strategic Stop:
Point C: (x = 1.6400, y = -1), just below the lower angular base — a vector dispersion zone
Technical Targets (Supply Zones):
Level 1: x = 3.9721 (first circular layer)
Level 2: x = 4.7124 (72° expansion — common in golden ratio geometry)
Level 3: x = 5.6709 (structural exhaustion zone)
Technical Justification: Why Analytical Geometry Works
Analytical Geometry, developed by René Descartes, allows for the representation of curves, vectors, and spatial structures using numerical coordinates.
Metatron’s Cube functions as a vector mesh over the price chart — translating market behavior into a mathematical language of:
Proportions
Intersections
Angular projections
This approach enables us to:
Model price behavior as a multivariable function
Anticipate reaction zones based on angular and linear symmetry
Protect capital with stops anchored in vector-based rupture zones
Scientific Relevance
Metatron’s Cube is not merely symbolic — it remains actively used in modern physics and aerospace engineering.
At NASA, geometries derived from the Cube are applied to:
Orbital simulations
Spatial perimeter calculations on nonlinear geodesics
Angular mass distribution in interplanetary navigation systems
The same mathematical foundation used to understand celestial body dynamics is used here to identify repeatable behavior patterns in the market — with a high degree of precision.
Technical Conclusion
The market’s geometric structure is not random — it is vectorial, symmetrical, and proportional
Using Metatron’s Cube as a geometric projection allows for rational and coordinated alignment of entry, stop, and target points
The first target has already been validated, proving the structure’s effectiveness
The position remains active, with upper targets defined by vector intersections and angular saturation zones
Closing Insight
"The market’s geometry is the invisible code behind apparent movement. He who understands the vectors, masters the cycles."
This strategic model combines analytical geometry, energetic symmetry, and technical foundation in a unified framework — with precision, logic, and harmony.
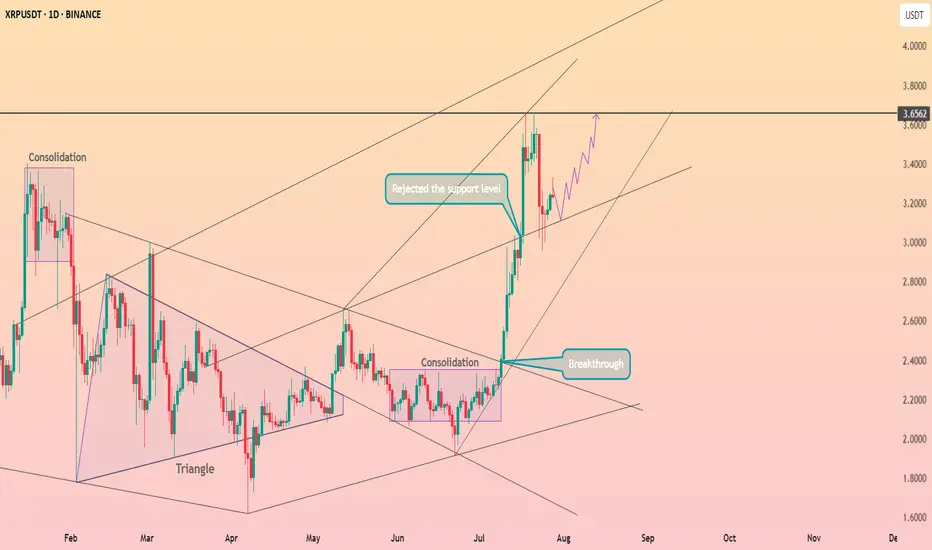
Can Ripple hit $3.40 with 15% upside soon?Hello✌
let’s dive into a full analysis of the upcoming price potential for Ripple📈.
BINANCE:XRPUSDT is poised to challenge the $3.40 level soon, supported by a notable increase in market volume 📊. This price zone also coincides with a key support area aligned with sharp Fibonacci levels, offering a strong base for potential upward movement 🔥.
✨ Need a little love!
We pour love into every post your support keeps us inspired! 💛 Don’t be shy, we’d love to hear from you on comments. Big thanks , Mad Whale 🐋

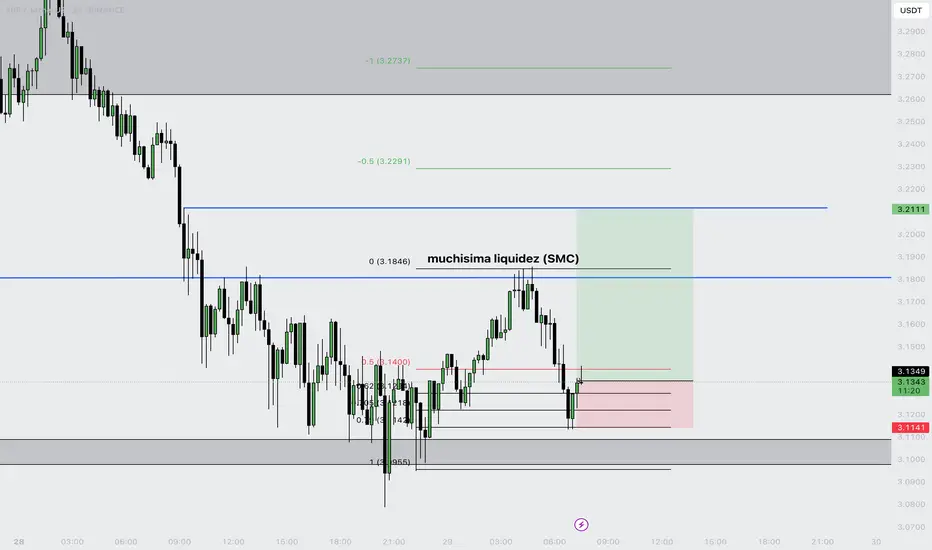
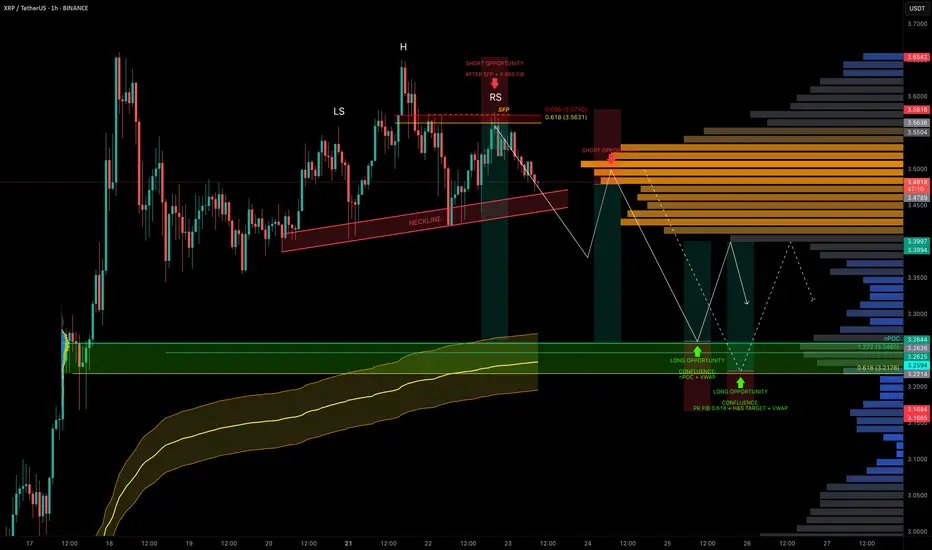
XRP Coiled in Range — Liquidity Below, Trade Setups AheadXRP has been stuck in a trading range around $3.50 for the past 5 days, offering multiple trade opportunities within the chop.
A notable short was triggered after a swing failure pattern (SFP) at the 0.666 fib retracement level near $3.563.
Now, with liquidity building to the downside, we’re watching closely for the next high-conviction setups.
🧩 Current Structure & Short Setup
🔴 Short Opportunity (Triggered):
SFP + 0.666 fib retracement at $3.563 led to rejection.
Market now shows a head & shoulders pattern forming.
Target: $3.2176 (0.618 fib retracement).
Trigger: Watch for a neckline break + retest for short confirmation.
Stop-loss: Above the right shoulder.
🟢 Long Setup:
Watching for a high-probability long around:
$3.26 → nPOC + 1.272 TBFE
$3.23 → anchored VWAP bands
This zone offers strong confluence and could act as the next launchpad.
Long Trade Plan:
Entry Zone: potential entries between $3.26–$3.22, price action needed for confirmation
Stop-loss: Below swing low at $3.1675
Target (TP): ~$3.40
✍️ Plan: Set alerts near the lows and react to price action at the zone — don’t front-run, let structure confirm.
💡 Pro Tip: Trade the Confluence, Not the Emotion
High-probability trades come from confluence, not guessing.
This setup combines nPOC, TBFE, VWAP, fib levels, and classical market structure (H&S) to map precise zones for both longs and shorts.
Let price come to you and wait for confirmation — especially in a rangebound environment where liquidity hunts are frequent.
Final Thoughts
We’re still rangebound, but liquidity is building below.
Keep an eye on the $3.26–$3.22 support zone for long entries and the H&S neckline for short breakdown confirmation.
_________________________________
💬 If you found this helpful, drop a like and comment!
Want breakdowns of other charts? Leave your requests below.
XRPThe primary regulatory catalyst boosting XRP's bullish outlook in 2025 is the resolution of Ripple Labs' long-standing lawsuit with the U.S. Securities and Exchange Commission (SEC). In March 2025, Ripple settled the case by agreeing to pay a $50 million fine, and crucially, it was clarified that XRP is not considered a security in the context of secondary market sales. This settlement removed years of significant regulatory uncertainty that had suppressed XRP's price and led exchanges to delist XRP. Following this resolution, major U.S. exchanges reinstated XRP trading, and institutional confidence in XRP surged, unlocking large-scale adoption and market participation by regulated investors.
Another key regulatory development providing bullish momentum is the passage of the GENIUS Act in the U.S. House of Representatives, approved around mid-July 2025. This legislation establishes a clearer federal framework for stablecoins and digital assets like Ripple's RLUSD stablecoin, further reducing regulatory risks and positioning XRP for broader mainstream utility and adoption.
In summary, the decisive legal settlement with the SEC and U.S. legislative progress (notably the GENIUS Act) have greatly clarified XRP's regulatory status, providing a green light for institutional entry through regulated channels such as exchange-traded funds (ETFs). The proliferation of XRP ETFs—including the approved ProShares XRP Futures ETF—amplifies this effect, enabling easier institutional and retail investment and fueling bullish price momentum
XRP Real-Life Use Cases in Finance
XRP REAL LIFE APPLICATION IN THE ECOSYSTEM.
1. Cross-Border Payments
XRP’s core financial use case is to act as a bridge for cross-border payments.
Traditional international money transfers often take days and involve high fees due to intermediary banks (the SWIFT system).
With XRP, financial institutions can instantly convert and transfer value across borders. Typical settlement times are 3–5 seconds, with transaction costs usually less than a cent.
Numerous global banks and remittance providers have adopted XRP and the RippleNet system to cut costs and provide real-time international payment services.
2. On-Demand Liquidity (ODL) & Liquidity Bridging
Banks and payment providers use XRP to manage liquidity.
With XRP as a bridge currency, financial institutions do not need to pre-fund nostro accounts in multiple countries. Instead, they can source liquidity ‘on demand’ using XRP, freeing capital and reducing operational costs.
On-demand liquidity flow improves cash efficiency and speeds settlements between a wide variety of global fiat currencies.
3. Micropayments
Due to low fees and fast settlement, XRP is suitable for micropayments.
This enables new use cases in digital content (e.g., pay-per-article, tipping creators) and gaming, where sending tiny amounts is otherwise unfeasible.
Such micropayment abilities open the door to innovative business models in finance and online services.
4. Tokenization and DeFi
The XRP Ledger supports tokenization of financial assets and decentralized finance (DeFi) use cases.
Financial firms can issue stablecoins or tokenized assets (including stocks, bonds, or other real-world assets) on-chain, fostering new kinds of investment products, automated trading, and settlement.
XRP’s ledger powers “sector-based index funds,” asset baskets, and other financial instruments, expanding real-world utility within decentralized finance.
5. Remittances
Remittance companies use XRP to offer faster and cheaper international transfers.
This is particularly valuable for migrant workers sending money home, reducing transaction times from days to seconds and cutting fees, thereby increasing the amount recipients receive.
6. Banking and Trade Finance
Some banks and trade finance platforms use XRP to improve operational efficiency.
By digitizing trade documentation and facilitating instant payments, XRP is helping modernize the traditionally slow and paperwork-heavy trade finance sector.
7. Collateral & Trading
XRP can be used as collateral in digital asset trading and arbitrage.
Traders and financial institutions leverage XRP for high-speed transfers between exchanges, using its liquidity to seize arbitrage opportunities and service margin calls rapidly.
Countries adopting XRP for real-life payments, especially cross-border transactions, include several key nations across Asia, the Middle East, and beyond. Here are some notable examples of countries actively integrating XRP into their financial systems and payment infrastructures as of 2025:
Japan: A pioneer in cryptocurrency adoption, Japan has multiple banks partnered with Ripple using XRP to streamline cross-border payments. The Bank of Japan and major institutions like SBI Holdings support XRP integration to provide faster, lower-cost international transactions across Asian markets.
United Arab Emirates (UAE): The UAE is proactively integrating blockchain technology, including XRP, with banks such as Zand Bank and fintech firms using Ripple’s platform for faster cross-border payments. Dubai’s financial initiatives leverage XRP to boost transaction efficiency within and beyond the region.
South Korea: Known for its vibrant tech ecosystem and supportive crypto regulations, South Korea has seen local banks experimenting with XRP to reduce international payment costs and increase speed, making it part of the broader fintech innovation landscape.
Mexico: Financial institutions in Mexico use XRP to improve remittances, especially those coming from the U.S., reducing processing time and fees significantly.
India: Given its large remittance market and fintech growth, India is exploring the use of XRP to address the need for low-cost, quick international payments.
Singapore: XRP adoption is growing here, with increasing numbers of users and integration of Ripple’s stablecoin RLUSD into payments.
United States: Some American banks and financial institutions are starting to integrate XRP for international payments, signaling growing institutional interest.
Canada: Banks like Canadian Imperial Bank of Commerce (CIBC) and remittance services use Ripple technology, including XRP, to enable faster cross-border money transfers.
Brazil: Various financial players collaborate with Ripple to modernize the country’s payment infrastructure using XRP.
United Kingdom: Institutions and fintech firms in the UK leverage Ripple’s technology for faster, cheaper international transactions.
Thailand and Sweden: Banks in these countries are partnering with Ripple to enhance their cross-border payment capabilities by leveraging XRP.
Egypt: Major banks are collaborating with Ripple to improve payment efficiency, including through XRP-based solutions.
In essence:
XRP directly addresses major friction points in global finance by cutting costs, increasing speed, and providing new ways for banks, companies, and individuals to move and manage money—all with increasing real-world adoption in cross-border payments, liquidity management, and digital asset innovation.

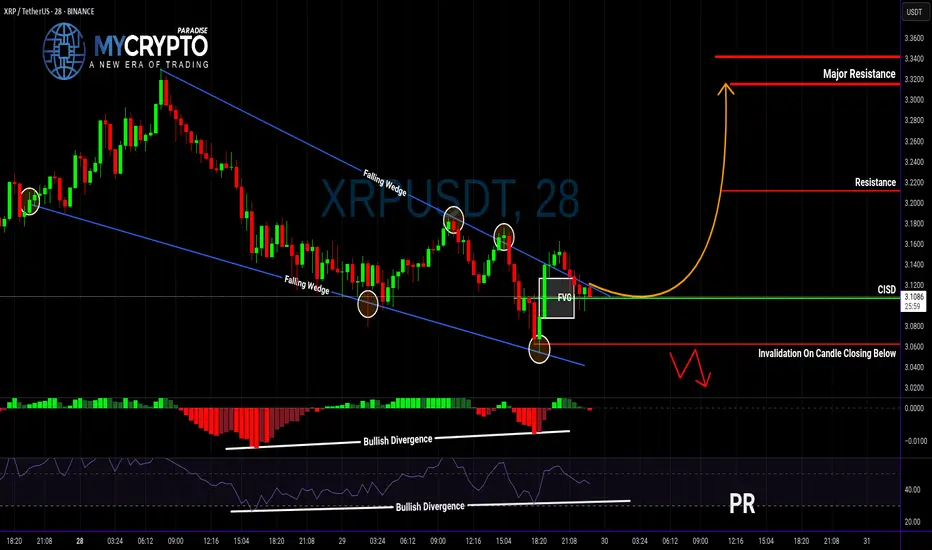
XRP Breakout Could Be a Trap… Or the Start of Something Big?Yello, Paradisers — are you about to buy into a fake breakout or position yourself right before a major move? Let’s break it down before emotions take over.
💎XRPUSDT has officially broken out of a falling wedge — a classic bullish reversal structure. What makes this breakout even more interesting is that it's supported by bullish divergence on both MACD and RSI, plus a Change In State of Delivery (CISD). All these technical signals combined significantly increase the probability of a bullish continuation.
💎Now, if you’re a disciplined trader looking for a safer entry with a higher risk-to-reward ratio, the smart move is to wait for a potential pullback to the CISD level. That would set up an opportunity offering a risk-to-reward of over 1:2.55 — not something you want to ignore.
💎But don’t get too comfortable…
💎If the price breaks down and closes below our invalidation level, the entire bullish idea is off the table. In that case, it’s wiser to stay patient and wait for clearer price action to develop. No emotional entries — only strategic moves.
🎖Strive for consistency, not quick profits. Treat the market as a businessman, not as a gambler. That’s how you’ll get inside the winner circle.
MyCryptoParadise
iFeel the success🌴
#XRP Update #5 – July 29, 2025#XRP Update #5 – July 29, 2025
The long position we opened two days ago is still active, and as I mentioned earlier, I’m not planning to use a stop. In the previous trade, we took profit with 30% of our capital at the $3.33 level. Although there has been a pullback, I’m still holding the position. I have no intention of placing a stop and will continue by averaging down if necessary.
Currently, XRP has reacted from the K-Level zone. Its target is the $3.93 level, but the first major resistance it needs to break is at $3.66. I’m continuing to hold the position for now.

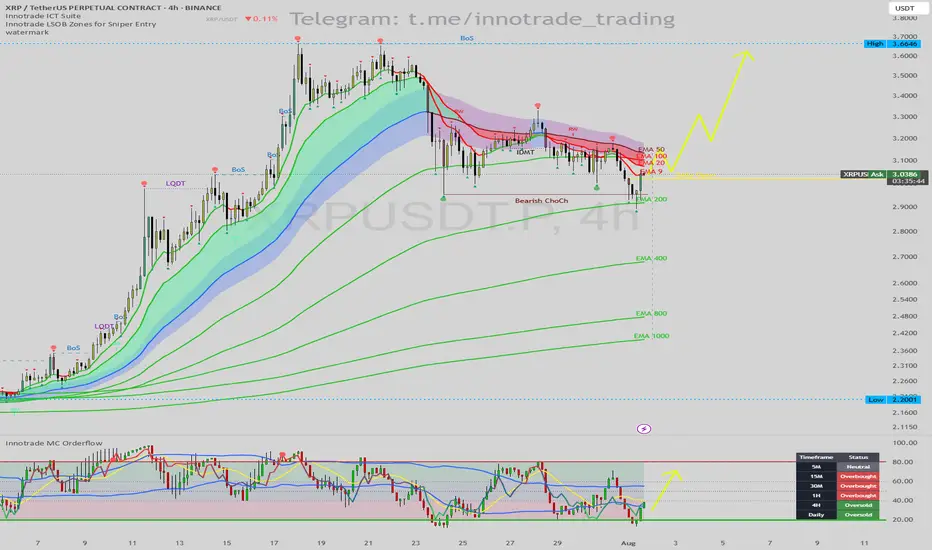
XRP/USDT: Bullish Reversal Setup at EMA 200 & Daily OversoldHello traders,
I'm seeing a compelling long setup forming on the XRP/USDT 4H chart. While the immediate trend has been bearish, multiple key indicators are now signaling that a significant bounce or reversal is highly probable.
1. Trend & Context (The "Why")
After a strong uptrend, the price has experienced a pullback, confirmed by a Bearish Change of Character (ChoCh). However, the price has now reached a critical support level where we can look for long opportunities.
Key Price Action Support: The price is currently finding support directly on the EMA 200. This is a major long-term moving average that frequently acts as a strong floor for price during a pullback.
Momentum Exhaustion Signal: The Innotrade MC Orderflow oscillator is giving a powerful confirmation for a potential bottom:
The oscillator is deep in the OVERSOLD zone (below 20), indicating that selling pressure is exhausted.
CRITICAL MTF CONFLUENCE: The Multi-Timeframe Cycle Table is the key to this trade. It shows that both the 4H and Daily timeframes are "Oversold". When higher timeframes like the Daily show exhaustion, it significantly increases the probability of a strong reversal on lower timeframes.
2. Entry, Stop Loss, and Targets (The "How")
This setup provides a clear, high-probability trade plan with a good risk-to-reward ratio.
Entry: An entry around the current price ($3.03 - $3.05) is viable as we are at the EMA 200 support. For a more conservative entry, wait for the MC Orderflow oscillator to cross back above its yellow MA.
Stop Loss (SL): $2.89. This places the stop loss safely below the recent swing low and the EMA 200. A break below this level would invalidate the bullish thesis.
Take Profit (TP) Targets:
TP1: $3.25 (Targeting the cluster of short-term EMAs and the recent swing highs).
TP2: $3.40 (The next logical area of resistance from the previous price structure).
TP3: $3.66 (The major swing high, a longer-term target if the bullish trend resumes).
Conclusion
This trade idea presents a strong case for a long position. The combination of a major technical support level (EMA 200) with a confirmed multi-timeframe momentum exhaustion signal (Daily Oversold) creates a high-probability environment for a bullish reversal.
Disclaimer: This is not financial advice. This analysis is for educational purposes only. Always conduct your own research and manage your risk appropriately.
XRPUSDT ShortWe´ve just finished the 5th wave of the bullish structure and started a 5 wave corrective structure for a bigger ABC correction. Right now we´re in the 4th wave and exspecting one more bearish move into the yellow area

XRP crash or just a pullback?It's at a very critical point, and if the price can't pull itself up, we could see a drop.
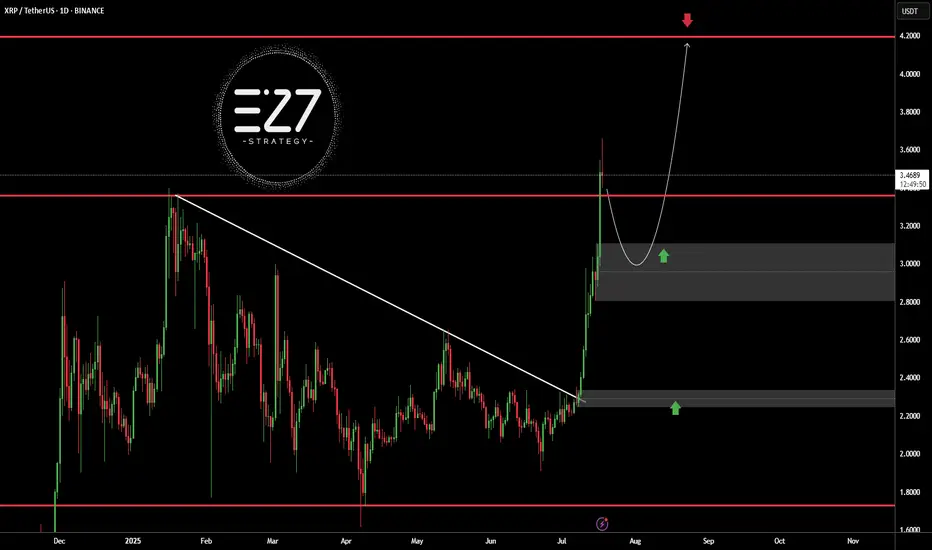
XRPUSDTBINANCE:XRPUSDT broke above its long-term downtrend line and surged to the $3.5000 resistance area, but is now undergoing a correction. The current bullish structure, with a higher high and higher low, suggests the trend remains upward. A pullback toward the $3.0000 demand zone is likely and would be a healthy retracement. Holding this area could trigger a continuation toward the key resistance at $4.2000.
Key Level Price
Main Support $2.2000
Main Resistance $4.2000
Best Buy Range $2.9500 – $3.1500
Best Sell Range $4.1000 – $4.2000
Investment Risk (Buying) Medium
⚠️Please control RISK management
XRP held the support line ┆ HolderStatBINANCE:XRPUSDT is holding above $0.685 support after a correction from recent highs. Price is stabilizing inside a horizontal channel, with buyers defending the bottom of the range. A clean push above $0.70 would reopen the path toward $0.75. The market is at a decision point with strong reactions at both ends of the range.
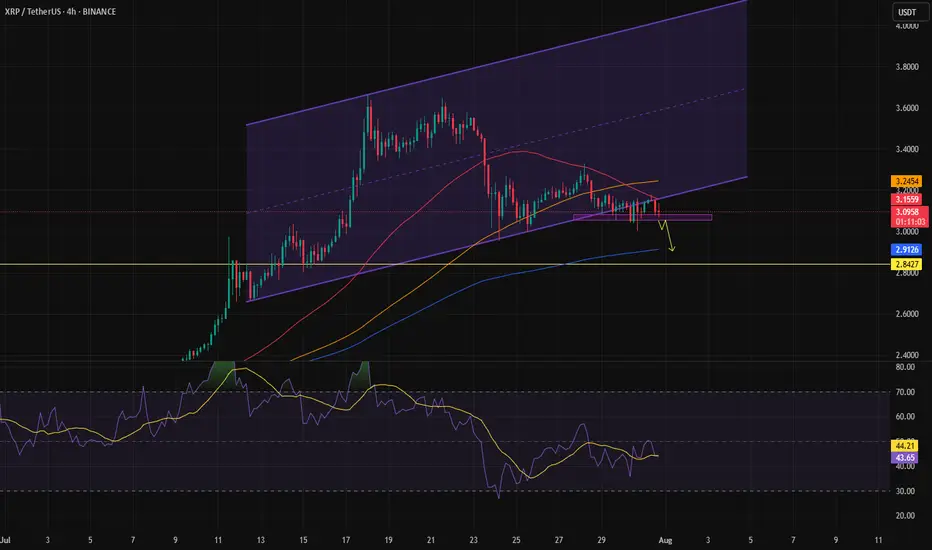
XRP 1H – 21% Decline Off the HighAfter hitting a strong resistance near $3.75, XRP has been in a steady downtrend, losing over 20% from its peak. The chart shows clear lower highs and a strong descending resistance line capping every bounce. Price action remains bearish, but short-term momentum (via Stoch RSI) shows signs of being oversold — hinting at a potential relief bounce.
To flip bias, bulls would need a clean break of the trendline and reclaim the $3.15–$3.25 area. Until then, lower highs + sustained sell volume = caution for longs.
📌 20.6% decline
📌 Downtrend intact
📌 Momentum diverging — bounce or continuation?
This setup is primed for a mean-reversion or further breakdown — stay reactive, not predictive.
