XRP Approaching 200 period, 2day MAXRP has 100% of the time come down to touch the 200-2day moving average after a pump.
This move could be the last flush before a move higher, but it does seem like this bottom wick at $1.80 may get taken out.
XRPUST trade ideas

XRP in BIG TROUBLE | BearishXRP is known as the "PUMP and DUMP" alt for a reason.
If you look at this chart from the macro timeframe, it clearly shows how XRP dumps hard after every parabolic increase - and this isn't even the entire price history..
The lower highs and lower lows we currently observe are not helping its case, either.
Pulling up the technical indicator in the weekly timeframe and we see a clear SELL - indicating that the price/trend has turned bearish.
And from what we know of XRP - it's likely that the price will drop ALL the way back to the lows, aka the beginning of the parabolic rally - possibly even further down.
______________________
BINANCE:XRPUSDT

SELL SETUP - XRP/USDT (1D)🧠 SELL SETUP - XRP/USDT (1D)
Chart by: Asif_Brain_Waves
📍 Current Price: 2.1286
📍 Short-Term Liquidity Grab Target (DT T1): 2.2851
📍 Projected Drop Target: 1.5756
📉 Bias: Bearish
🔍 Narrative & Context:
Price has recently broken below key internal structure with inefficiencies (FVGs) left behind. Currently forming a potential retracement move toward the breaker block / imbalance near 2.2851 — a likely draw on liquidity (DT T1). This area aligns with previous support-turned-resistance and offers high probability for a reversal zone.

Ripple Technical AnalyzeTrend: XRP is currently consolidating in a small box pattern (shown by the red box), after a large spike. This is often a sign of accumulation or a pause before another move.
Support: The recent support level around 1.70–2.00 should be monitored for a potential bounce if price action moves downward.
Resistance: The immediate resistance at 6.72 is a key level, where the price could face significant selling pressure.
Volume: The volume shows strong buying activity during the recent rise, but a decline in volume during the consolidation suggests indecision in the market.
Price Action: A breakout above the red box and resistance at 6.72 could suggest further upside potential, possibly targeting 10–12 range. A breakdown below support could lead to a retest of lower levels.

XRP - Excellent Signal/TA days ago. Look at Now.I gave the TA/Signal 3days ago.
Wrote "Short the sht out of it" .
Now : 13 % 🎯 👌 until now an ongoing.
Original TA here:https://www.tradingview.com/chart/XRPUSDT.P/V6Skh0wm-XRP-Looks-Bearish/
Follow for more ideas/Signals. 💲
Look at my other ideas 😉
Just donate some of your profit to Animal rights and rescue or other charity :)✌️

XRP at Key Support – Break or Bounce?
XRP is approaching the lower boundary of a symmetrical triangle, a critical decision zone that could define its next major move.
🔻 Testing key support, making this a pivotal level
📈 A bounce here could trigger an upward move toward resistance
📉 Losing support may lead to further downside pressure
Keep an eye on how price reacts at this level to determine the next trend direction 👀

XRP/USDT 4HXRP/USDT 4H Analysis
In this chart, we can see a Bullish Gartley Pattern forming on the 4-hour timeframe. The price is currently testing the D point near the key support zone, which aligns with the potential reversal area. If the price holds this level, we can expect a bullish move towards the 2.30 - 2.50 range.
🔹 Key Levels:
• Support Zone: Around 2.10 - 2.15
• Resistance Targets: 2.30 and 2.50
A potential rejection from the D point could confirm a buying opportunity, with a strong breakout above 2.30 leading to further upside momentum. However, if this support fails, XRP may experience further downside.
What are your thoughts on this setup? Let me know in the comments! #XRP #CryptoAnalysis #TradingView

XRP/USDT 4H Chart AnalysisXRP/USDT 4H Chart Analysis
Key Observations:
Symmetrical Triangle Formation
The price action is forming a symmetrical triangle pattern, indicating a potential breakout.
The triangle’s apex suggests a significant move in the coming days or weeks.
Key Support & Resistance Levels
Support: Around $2.1292 - $2.1680
Resistance Zones:
Immediate resistance at $2.1777 - $2.4
Stronger supply area around $2.6 - $2.8
If the price breaks below $2.12, further downside towards $1.40 is possible.
Supply & Demand Zones
A supply zone is marked above $2.4, meaning selling pressure may increase near this level.
A strong demand zone is present near $1.40, acting as major support in case of a breakdown.
Indicators & Market Structure
BOS (Break of Structure) and ChOCH (Change of Character) indicate previous bullish and bearish shifts.
EMA Cross (50 & 200): If a golden cross (bullish crossover) happens, upside potential increases.
Rational Quadratic Kernel (RQK): Used for trend prediction, confirming whether buyers or sellers are dominant.
Liquidity & Sessions Impact
Labels for New York, London, and Hong Kong sessions suggest liquidity traps and potential reversals in those zones.
High volume areas indicate strong institutional activity.
Potential Scenarios:
Bullish Breakout:
If price breaks above $2.4, it could rally towards $2.6 - $3.0.
A breakout above $3.2 would confirm a strong uptrend.
Bearish Breakdown:
A drop below $2.12 could push XRP to $1.80, with a worst-case target of $1.40.
Conclusion:
Watch for a breakout or breakdown from the symmetrical triangle.
Monitor volume and key session impacts (New York, London).
Support Levels: $2.12 and $1.40
Resistance Levels: $2.4, $2.6, and $3.2

XRP - Ascending Channel: Will bulls stay in control?XRP continues to trade within a well-established ascending channel on the 4-hour timeframe, maintaining a bullish structure as long as it respects this formation. The price has consistently formed higher highs and higher lows, signaling that buyers are still in control. However, recent price action suggests that XRP is at a critical decision point, with strong support below and short-term resistance above.
4H Timeframe – Golden Pocket and Imbalance Providing Strong Support
One of the key areas to watch is the golden pocket Fibonacci retracement level (0.618 - 0.65), which aligns with a 4-hour imbalance zone. This confluence has already provided two strong bounces, confirming that buyers are actively defending this area.
The golden pocket is a key retracement zone where price often finds strong support before continuing the trend. Additionally, the imbalance zone represents an area of unfilled liquidity, which price often revisits before resuming its move. The fact that XRP has reacted twice from this level suggests that it remains a critical demand zone.
As long as price remains above this level, the bullish structure is intact, and XRP could continue pushing higher within the ascending channel. The next target for bulls would be the 0.618 Fibonacci extension level, which aligns with the upper boundary of the channel.
However, if this support fails and XRP breaks below the golden pocket and imbalance zone, the structure could shift bearish, leading to a potential breakdown toward lower support levels.
1H Timeframe – Bearish Rejection from Imbalance Zone
While the 4-hour structure remains bullish, the 1-hour timeframe presents a short-term bearish case. Recently, XRP was rejected from a significant imbalance zone, suggesting that sellers are stepping in. This rejection indicates a potential short-term pullback before the next major move.
When price fails to break through an imbalance zone, it often signals that there isn’t enough liquidity to sustain the uptrend. This could lead to a retracement back to lower levels, possibly retesting the golden pocket on the 4H timeframe before another push higher.
Key Levels to Watch
Support Zone: Golden pocket (0.618 - 0.65) + 4H imbalance
Resistance Zone: 1H imbalance rejection area
Bullish Target: 0.618 Fibonacci extension, aligning with the upper boundary of the channel
Bearish Breakdown Level: A break below the golden pocket and imbalance could trigger a deeper retracement
Final Thoughts – Bullish Structure, but Short-Term Weakness
The 4H ascending channel remains intact, and the golden pocket support has held twice, indicating that the uptrend is still in play. However, the 1H bearish rejection from an imbalance zone suggests that XRP could face short-term weakness, leading to a possible retest of support before the next major move.
If XRP holds the golden pocket, the bullish bias remains strong, and we could see a continuation towards 2.80 – 2.90 in the coming sessions. However, if support fails, the structure could shift bearish, bringing lower retracement levels into play.
This setup presents both bullish and bearish scenarios, making it crucial to monitor key levels and wait for confirmation before making a trading decision.
__________________________________________
Thanks for your support!
If you found this idea helpful or learned something new, drop a like 👍 and leave a comment, I’d love to hear your thoughts! 🚀
Make sure to follow me for more price action insights, free indicators, and trading strategies. Let’s grow and trade smarter together! 📈

Xrp to $11,000Extremely sarcastic subject title! The transfer of wealth in the making will be from those that bought at $2+ and sell at $0.65 while whales buy the dip.
XRPUSDT: Trend in 15 Min time framevery important levels for XRP,
Please pay special attention to the colored levels.
>>>>>>>>>>>>>>>>>>> very sensitive <<<<<<<<<<<<<<<<<<<<<<<<
Be careful
BEST
MT

Ripple Partners with Chipper Cash To Boost Cross-Border PaymentsRipple partners with Chipper Cash to expand cross-border payments in Africa, leveraging blockchain for faster, affordable transactions.
Ripple has announced a strategic collaboration with Chipper Cash to expand its payment solutions to Africa after securing a win against the US SEC earlier this week. Through Ripple Payments, the collaboration intends to foster cross border payments in the African regions.
Notably, the crypto platform’s alliance with Chipper Cash provides a fast, low-cost, and efficient payment system that unites international treaties.
Despite the partnership and important victory over the SEC, Ripples native coin ( CRYPTOCAP:XRP ) seems unbothered by the development with the asset maintaining the $2.3 price pivot. A break above the 38.2% Fibonacci retracement point might cement a bullish breakout for CRYPTOCAP:XRP with eyes set on $5 and beyond.
Similarly, in the case of a cool-off, CRYPTOCAP:XRP might find support in the 65% Fibonacci retracement level before picking liquidity up albeit the RSI is at 48 which is a strong sign of a bullish reversal lurking around the corners.
XRP Price Live Data
The live XRP price today is $2.35 USD with a 24-hour trading volume of $2,950,161,398 USD. XRP is down 0.54% in the last 24 hours. The current CoinMarketCap ranking is #4, with a live market cap of $137,073,610,487 USD. It has a circulating supply of 58,205,697,378 XRP coins and a max. supply of 100,000,000,000 XRP coins.

XRP LONG SETUP ALL trading ideas have entry point + stop loss + take profit + Risk level.
hello Traders, here is the full analysis for this pair, let me know in the comment section below if you have any questions, the entry will be taken only if all rules of the strategies will be satisfied. I suggest you keep this pair on your watchlist and see if the rules of your strategy are satisfied. Please also refer to the Important Risk Notice linked below.
Disclaimer

XRP ABC Setup: Ready for a Bullish Reversal at Support?Hey traders! 👋
What do you think of this ABC setup? I’m expecting point C to form right at the support box. If we start seeing a bullish reversal from here, I’ll be opening a market order and trading it back up.
What’s your plan for XRP and this setup? Let’s share some thoughts and see if we can catch this move together! 💡
Note: This is not financial advice. Always do your own research before making any trading decisions!

$Xrp possible inverse head and shouldersPossible inverse head & shoulders with a target of 2.38 to 2.42$

XRP ANALYSIS🔮#XRP Analysis 💰💰
#XRP is trading in a symmetrical triangle in a weekly time frame and if it breakouts with high volume then we can see a bullish momentum in #XRP. Before that we will see little bit bearish movement towards its support zone and that a bullish movement.
🔖 Current Price: $2.3520
⏳ Target Price: $2.9740
⁉️ What to do?
- We can trade according to the chart and make some profits in #XRP. Keep your eyes on the chart, observe trading volume and stay accustom to market moves.💲💲
🏷Remember, the crypto market is dynamic in nature and changes rapidly, so always use stop loss and take proper knowledge before investments.
#XRP #Cryptocurrency #Pump #DYOR

XRP LONG TRADE SETUPXRP has done BOS sudden after MSS and taking lows liquidities, As lows liquidities has been taken now highs liquidities left that why looking for long in perfect area, I have marked internal liquidity FVG as long entry zone and external (below swing low) as DCA. Check chart.

XRPUSDT Looking Bearish M30Hi there,
XRPUSDT has the potential to pull up into the supply zone and turn bearish to 2.4188 and 2.400.
Right now, the price is consolidating in a bearish zone.
Happy Trading,
K.
Not trading advice.

2.20 Support levels broken , 2.60 rejected , breakthrough to 3+?XRP Technical Analysis – March 6
In my previous analysis, I indicated that XRP was at a key resistance level and could potentially seek lower support levels. As anticipated, it broke the $2.20 support and dropped to $1.90 before gradually climbing back to $2.60, only to face an instant rejection at that level.
During the move up to $2.60, I noticed that the trading range and the higher lows were becoming progressively tighter. What I mean by this is that in my last post, I observed roughly a $0.10 price difference in support and resistance levels on lower timeframes (30M, 15M, and below). However, this time, the price seems to be moving more aggressively as it approaches $2.60 and $3.
In my opinion, XRP is likely to create a lower high as it approaches $2.60, and I expect a potential breakout from this range. If it doesn’t break upward, I’ll be watching for support in the $2.30–$2.40 range, while hoping it holds above $2.20. That level appears significant as XRP looks to be breaking the downtrend, with horizontal and vertical patterns forming lower highs and short-term support levels. The price has been bouncing off these supports, gradually creating new, higher support zones.
I hope this analysis is clear and helpful. This is my second time posting. I’ve been taking profits and re-entering at lower prices, carefully trading within these ranges. XRP often makes moves that look like it’s about to skyrocket, so it’s essential to learn and recognize these patterns.

Shiba Inu (SHIB) Shows First Major Bullish Signal Amid Market ReAfter weeks of downward pressure, Shiba Inu (SHIB) (traded on WhiteBIT) has recorded its first notable bullish retrace, hinting at a potential trend reversal. The asset is currently trading near $0.00001337 and has successfully broken above the 26-day EMA—a key technical level that often signals the start of broader upward momentum.
This breakout is significant, marking SHIB’s first major move above resistance since February’s downtrend. The token’s local support now sits at $0.0000122, and if bullish momentum continues, SHIB could target the next major resistance at the 50 EMA ($0.0000145). A further push above this level could solidify the reversal.
Additionally, the Relative Strength Index (RSI) at 50.75 suggests growing buying pressure. A move above the 55-60 zone would reinforce the bullish setup and potentially trigger further gains. With market liquidity also increasing, traders seem to be re-entering SHIB, setting the stage for possible continued upside.

XRP - Looks Bearish XRP looks really red in terms of volume, CVD etc..
Small retailors are going for Long (low TF) but Smart Money is really decreasing!
Short the sht out of it if the lower blue trend line (marked as blue) breaks downward.
Follow for more ideas/Signals. 💲
Look at my other ideas 😉
Just donate some of your profit to Animal rights and rescue or other charity :)✌️

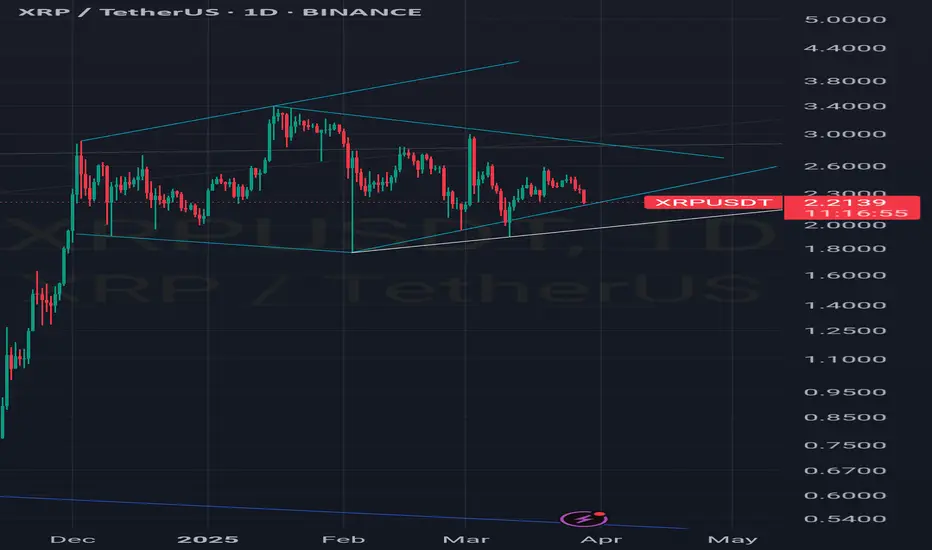
Ripple - bigger triangle at playWatching XRP here, we should see one more push higher for wave D in the triangle, then a 3 wave down to complete the wave E of the triangle

