Comprehensive Analysis: SHORT Signal on XRPUSDT1. News Analysis (Market Sentiment)
The news actually reflects a strongly positive sentiment for XRP’s long-term fundamentals:
"Brazil's VERT Debuts Tokenized Credit Platform on XRP Ledger With $130M Issuance" : This is a very bullish piece of news. It highlights real-world adoption of the XRP Ledger (XRPL) for high-value transactions.
"VERT Launches Blockchain Platform on XRPL for $130M Deal" : This is the same news reported by a different source, confirming the significance of this adoption.
Bridging the Analysis:
Here lies the crucial difference between investors and traders. As long-term investors, this kind of news would motivate us to buy and hold XRP. But as day traders, we understand the common market behavior of “Buy the Rumor, Sell the News.”
The massive price rally before this announcement might indicate the market already anticipated this news. Now that the news is official, early buyers may begin taking profits, triggering selling pressure.
Sentiment Conclusion:
While the news is fundamentally positive, it could strengthen the case for a SHORT position in the short term. This “sell on good news” reaction is a common phenomenon in trading.
2. Technical Analysis (Chart Structure)
The daily chart of XRPUSDT supports a SHORT position even more convincingly:
Climactic Top Rejection : A sharp price rally ends with a long upper wick candle around the $3.60 area. This is a classic sign of buyer exhaustion and aggressive seller entry.
Short-Term Bearish Structure : A large red candle formed after the top, signaling that sellers have taken control. The current price is trading well below that top, confirming the rejection was valid.
Room for Correction : Below the current price, there’s a clear “gap” or market inefficiency. The first logical target for a correction is around $2.80 - $2.90, where the 50 EMA meets the upper edge of the Fair Value Gap (green box). This gives us a clean profit target.
Combined Conclusion:
Yes, based on a combination of “Sell the News” sentiment and clear bearish technical structure, the argument for a SHORT position on XRPUSDT is very valid. We are going against the positive headlines, but following price action signals.
Trading Plan: SHORT Operation on XRPUSDT
Position: SHORT
Asset: XRPUSDT (Perpetual Contract)
Current Status: ENTRY
Entry Reason:
We’re entering based on short-term bearish momentum after a strong rejection from the supply zone, expecting the price to fill the inefficiency below.
Entry Type: Market Order
Why: The bearish move is in progress. We want to catch it now before the price drops further and skips our limit order. We'll execute at the current market price (~$3.01).
Stop Loss (SL): $3.62
Why: Placed slightly above the previous swing high. If price breaks this level, our SHORT thesis is invalid, and we exit to prevent further losses.
Take Profit (TP) Targets & Risk/Reward:
We'll scale out profits in phases to lock in gains.
TP1: $2.85
Why: Confluence of 50 EMA and top of Fair Value Gap
Risk/Reward: ~1:2.8 (Risking $0.61 to gain $1.75 — very healthy ratio)
TP2: $2.55
Why: Mid-point of the Fair Value Gap — a common magnet for price
TP3: $2.25
Why: Full gap fill + retest of prior support/resistance area
TP4: $1.85
Why: Ambitious target — filling the second, deeper Fair Value Gap. Possible in a panic-driven selloff.
Position Management:
Once TP1 is hit:
Move SL to Entry ($3.01) to secure a risk-free trade on the remaining position.
We’ll continue to monitor the price and adjust the trailing stop loss as each TP level is reached.
XRPUST trade ideas

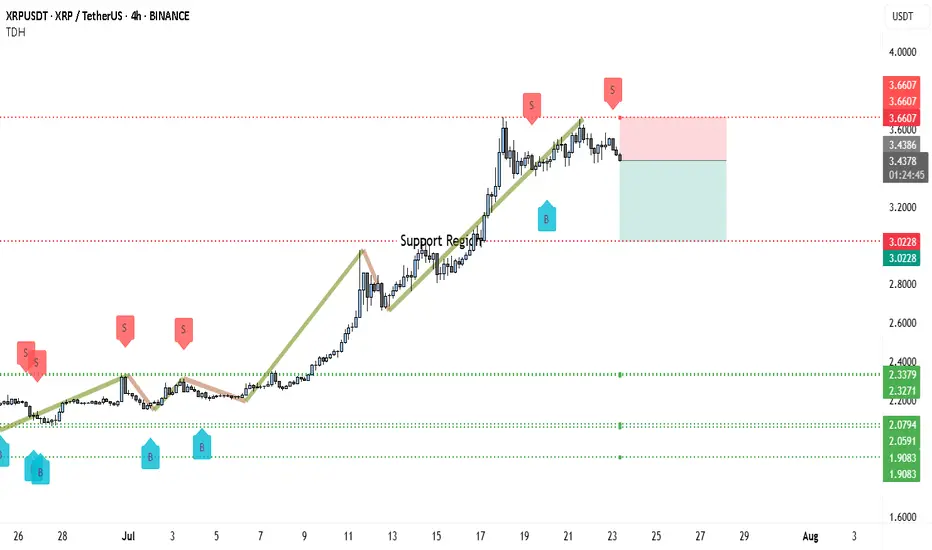
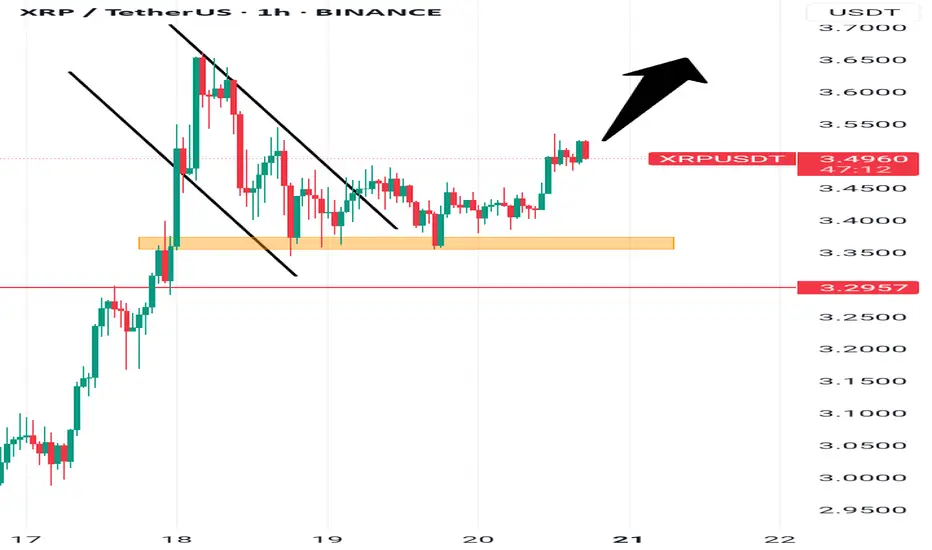
Is XRP About to Crash to $2.40? Charts Don’t LieXRP has been in a steady bullish run throughout July, but cracks are beginning to show. The price recently failed to hold above the key $3.66 resistance, and what once looked like a strong continuation setup now hints at exhaustion. Price action shows clear hesitation near the $3.60–$3.66 region, where multiple “Sell” (S) markers have emerged.
More importantly, the ascending trendline has been broken, and XRP is consolidating beneath it — often a sign of a shift in structure. A lower high has now formed, which could be the early warning of a short-term top.
If buyers can't reclaim the $3.43–$3.60 zone soon, XRP could enter a deeper pullback phase. The former support band between $3.02 and $3.05 is now being tested from below, and if this flips to resistance, further downside looks likely.
There’s a visible liquidity void below $3.00, and with XRP having rallied significantly, a retracement to retest deeper support zones wouldn’t be surprising. Areas like $2.80, $2.40, and even $2.00 are still untouched and could attract buying interest if panic kicks in.
📊 Trading Setup
• Entry (Sell): Around $3.43 (confirmed rejection)
• Stop Loss: Just above $3.66 (key resistance and invalidation zone)
• Target 1: $3.02 (minor support zone)
• Target 2: $2.40–$2.33 (stronger cluster with past reaction)
• Risk-to-Reward: Approx. 1:1.8 — favorable for swing short
The structure is now showing early signs of bearish reversal. The failure to break above $3.66, break of the trendline, and formation of a lower high all signal weakness. If XRP drops below $3.02 and holds there, it may trigger a more aggressive selloff toward mid-$2s. This short setup is valid as long as the price stays below $3.66 — beyond that, bulls might regain control.
Let me know if you want a continuation scenario or need this adapted for tweet threads or YouTube script.
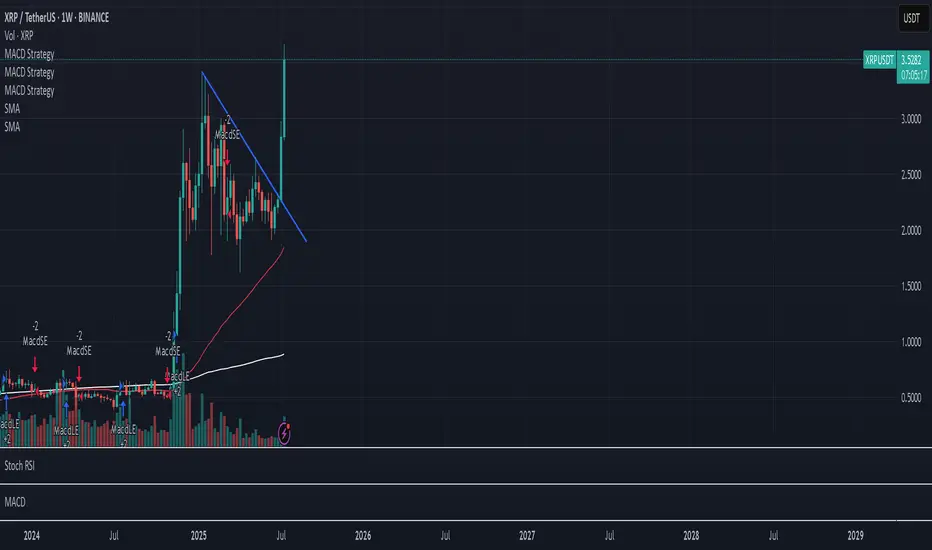
XRP TRENDXRP is following the same pattern.
Following Trend as well.
Final Target 6-8 USD maybe 10-12 USD
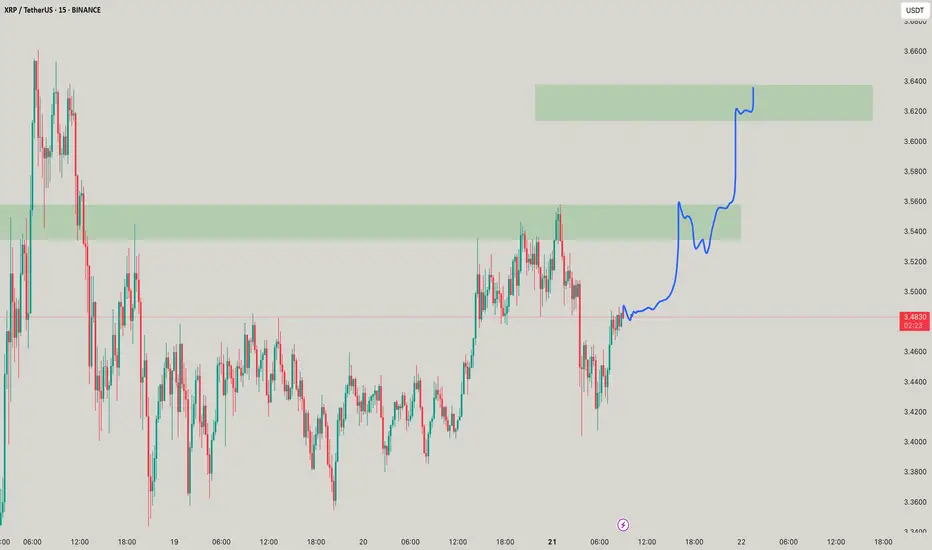
HolderStat┆XRPUSD seeks to the $4BYBIT:XRPUSDT remains steady above $3.10 after the recent breakout. Resistance at $3.40 is being tested. A move above it may unlock $3.55+.

Xrp BOS at 3.17 with bullish engulfing and volume. A break of structure is first sign of strength which would be a bullish candle breaking 3.17. I am looking for a 3.17 push through, with high volume in compared to last candles on the 1hr time frame. Once a break of 3.17 occurs, I need a retest of the 3.17 area with another bullish candle to confirm my entry long. I will be looking to take minor profits as price moves through key supports of 3.2,3.23,3.3. Once they have been pushed through I will hold and take profit as I see fit. My tight sl will be 3.13. I will not be looking at wicks. I will strictly be looking at candle bodies.

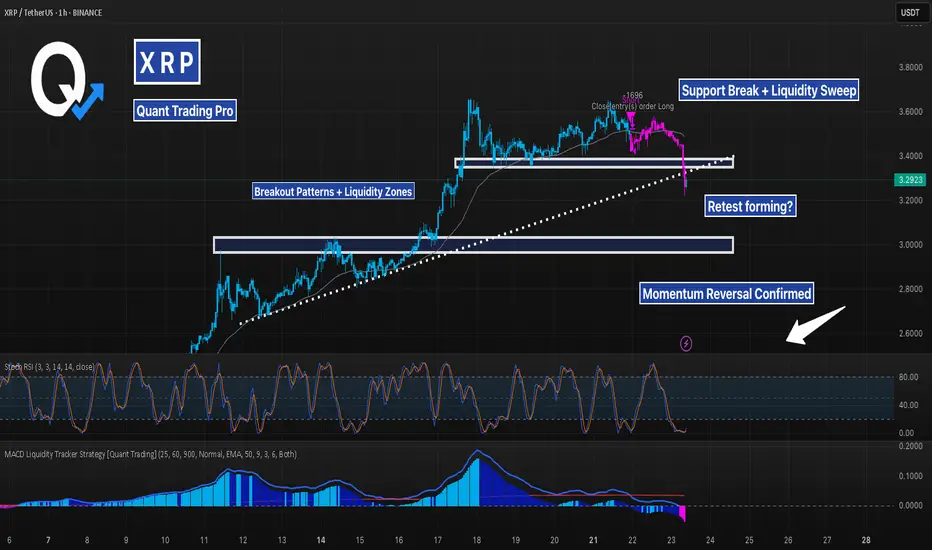
XRP Breakdown – Trend Break & Liquidity Zone Retest In ProgressXRP just gave us a clean breakdown below a well-formed ascending structure, violating both its dynamic trendline and horizontal support.
Let’s break down the setup:
🔹 Trend Context: Price was holding cleanly above the MA and respecting a dotted trendline, bouncing off prior breakout zones multiple times. This uptrend was sustained for days, with momentum supported by both MACD histogram expansion and Stoch RSI resets.
🔹 Structure Shift: After a minor consolidation, price rejected from the upper range and aggressively broke below support. The last long was closed during this transition — confirming the momentum was fading.
🔹 Liquidity Zones: The prior resistance-turned-support zone failed, with price wicking below and potentially sweeping stop orders before stabilizing.
🔹 Momentum Flip: MACD histogram has flipped red, and Stoch RSI is deeply oversold. This signals possible short-term exhaustion, but trend structure is clearly damaged.
Traders now face two scenarios:
1️⃣ Bearish case → Breakdown holds, and price trends lower into deeper liquidity (~3.00 or even 2.71).
2️⃣ Bullish case → Price reclaims structure with strength, invalidating the breakdown and trapping early shorts.
Key levels are in play. Wait for confirmation — especially on the retest.
#XRP #Breakdown #CryptoAnalysis #MACDStrategy #SupportResistance #LiquidityZones #TrendBreak #TechnicalAnalysis #AlgoTrading #QuantStrategy
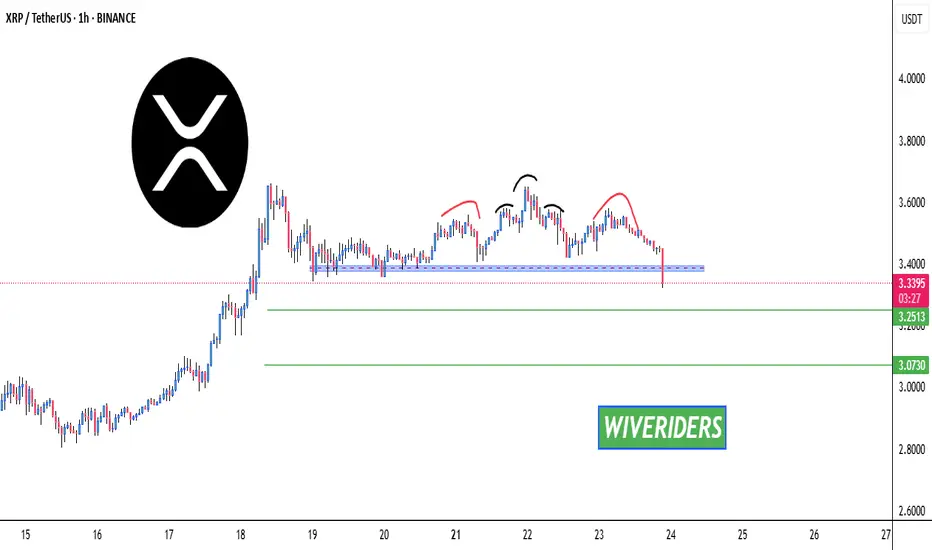
Bearish Patterns & Support Test🚨 CRYPTOCAP:XRP Price Update – Bearish Patterns & Support Test 📉
CRYPTOCAP:XRP has now formed two bearish Head & Shoulders patterns –
• One small H&S pattern
• One larger H&S pattern
Currently, XRP is testing the blue support zone.
📌 If this blue support breaks, the price could drop further toward the green line levels,
which are strong zones where buyers previously stepped in.
✅ Watch for potential bounce at the green zone – this could present a solid long opportunity if confirmation is seen.
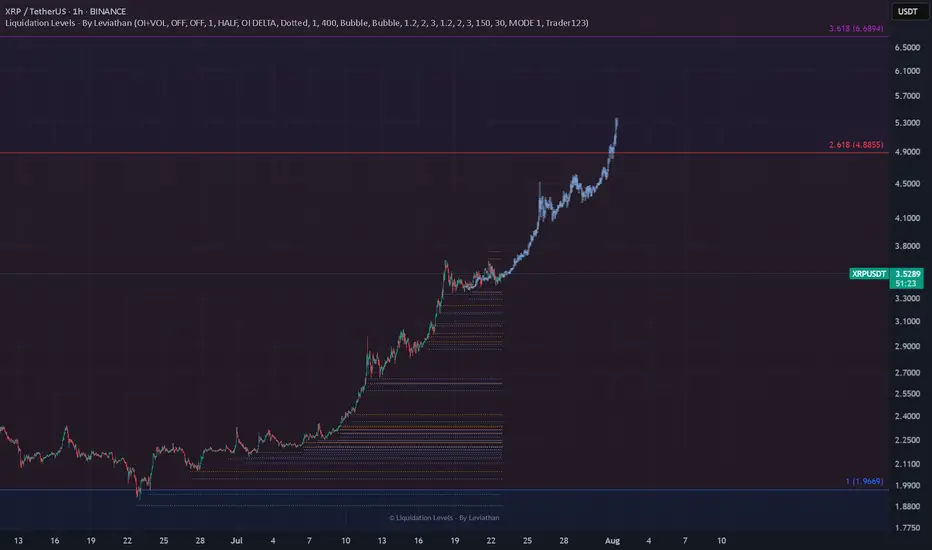
XRP: Whales Exit Pressure Plummets 94%! New ATH Incoming?CRYPTOCAP:XRP is consolidating near its recent highs, but don't let that fool you! Fresh on-chain data suggests a major move is brewing.
Latest analysis shows: BINANCE:XRPUSDT
🔹 Whale-to-Exchange Flow has plummeted by a staggering 94%, indicating large holders are strongly reducing their selling intent. This massive drop in supply pressure is a HUGE bullish signal!
🔹 New holders are entering and showing strong conviction, absorbing any remaining selling.
🔹 Key resistance sits at $3.59, with a potential push towards $4.64 based on Fibonacci extensions. Crucial support at $2.95 defends the bullish outlook.

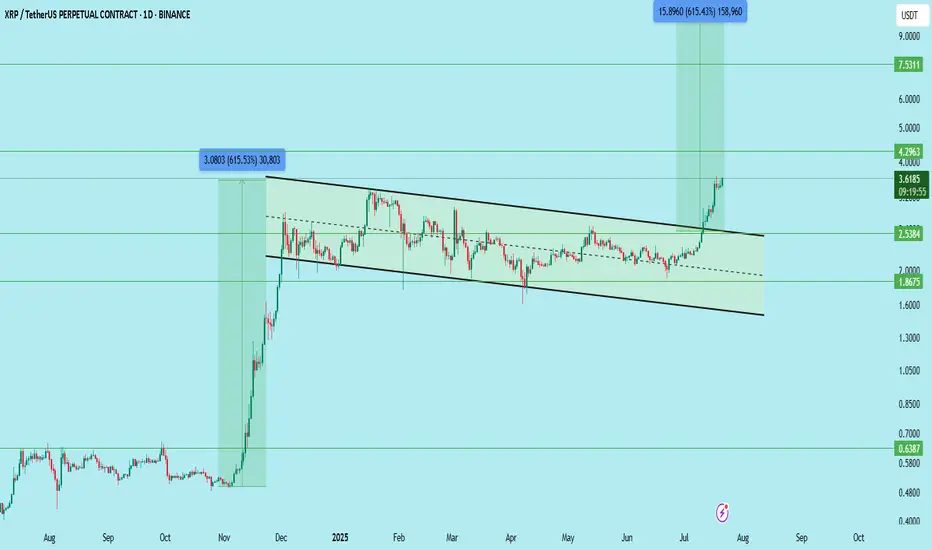
XRP Update | Long-Term Breakout In PlayCRYPTOCAP:XRP has successfully broken out of the descending channel and is currently approaching the key resistance zone at $4.29 — the first major long-term target shared earlier.
What’s next?
It’s now trading at a critical resistance, and a retest is highly likely. A clean pullback to the $3.51–$3.57 zone will offer the ideal entry opportunity for long-term positional traders.
Updated Trade Setup:
Entry: $3.51–$3.57 (wait for retest)
Stop Loss: Below $3.38
Support Zones: $2.53 / $3.51
Resistance Zones: $4.29 / $7.53 / $11.98 / $18.00
Targets:
TP1: $4.29 (nearly hit)
TP2: $7.53
TP3: $11.98
TP4: $18.00
This breakout structure remains highly bullish. Let price come to you — avoid chasing the move. A retest entry could offer better RR for the next leg.
DYOR | Not Financial Advice
DeGRAM | XRPUSD above the support level📊 Technical Analysis
● Price is now building above the former 3.39 resistance after the purple multi-month trend-cap break; three higher closes there confirm the zone as fresh support and signal a “run-away” gap.
● July’s 0.85 USDT impulse flags to the rising-channel crest and round-number offer at 4.00, reinforced by the 1.618 Fib projection of the June-July base while the parabolic guide-line of higher lows remains intact.
💡 Fundamental Analysis
● Santiment reports the ten largest wallets added >30 M XRP this week amid media chatter of constructive SEC–Ripple status talks, underlining continued dip absorption.
✨ Summary
Long 3.40-3.50; sustained trade above 3.39 targets 3.80 → 4.00. Bias void on a 16 h close below 2.95.
-------------------
Share your opinion in the comments and support the idea with a like. Thanks for your support!

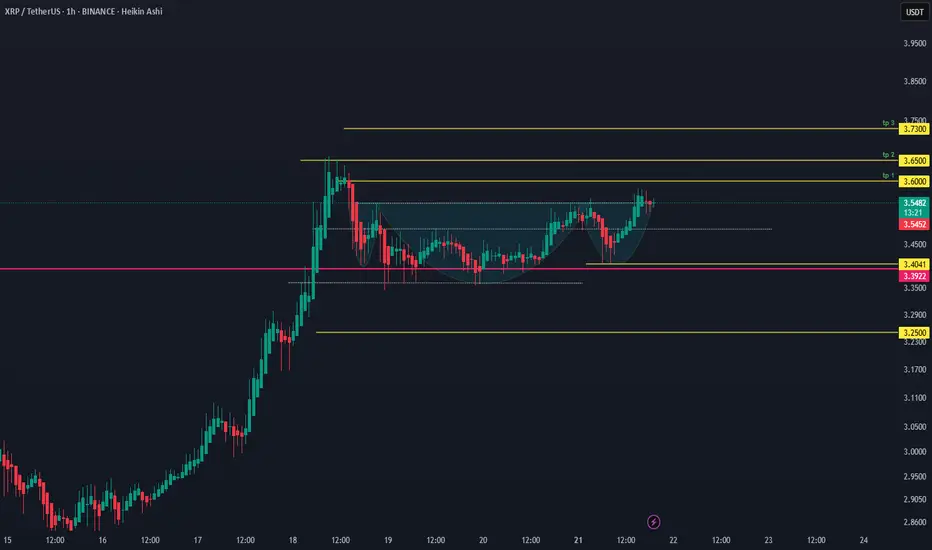
xrpusdt 1hr time frame bullish iH&S patternactivated bullish patter on top of prev. ATh level. targets are 3.60, 3.65 and 3.73
invalidation: a close below 3.40
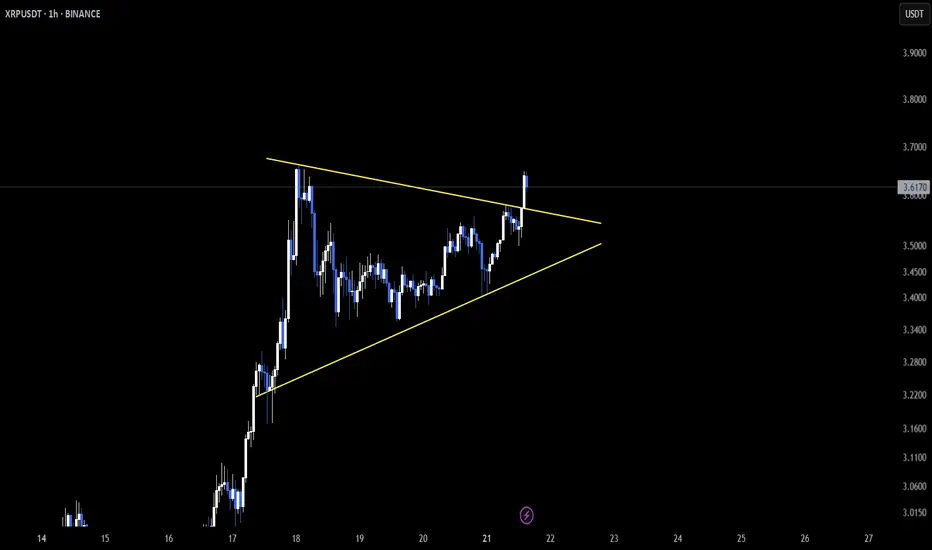
XRP – Intraday Breakout in MotionCRYPTOCAP:XRP is showing signs of strength on the 1-hour chart, breaking out of a symmetrical triangle 📈. This classic pattern often signals continuation when confirmed properly.
A clean retest of the breakout zone could open the door for another bullish leg up 🔄.
Short-term traders should stay cautious though—lower timeframes can lead to quick traps or fakeouts ⚠️.
For now, momentum is leaning bullish. Keep your eyes on how price behaves from here! 👀
XRP - Probable Trade!!! Very Yet!This trade is very probable and very to your extend beyond your imagination! Wait and watch!
$PEPE chartCRYPTOCAP:PEPE cup and handle. Cup in the making? CRYPTOCAP:PEPE has one of the highest beta as a meme coin and is a high beta proxy for Ethereum. ETH is on its way to $4000 now
Bullish movemmentXrp passed its previous highest high denoted with a red line(resistance level), continued moving upward and created a pull back.
On the H1, there is a clear w formation as the bigger structure and a small range followed by a continuous move upwards.
The move will continue complete the W formation.
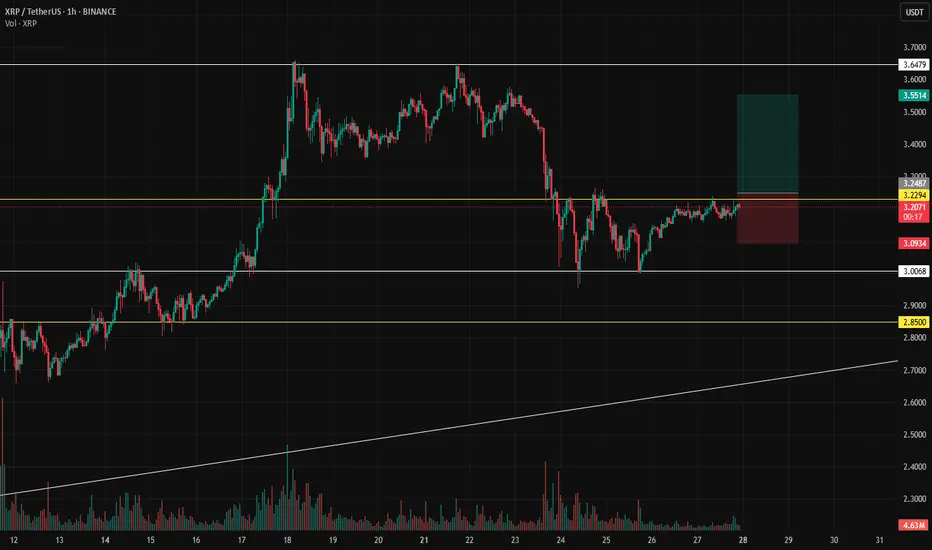
XRP | Trade-setup📌 Now that the target region has been reached, XRP is now allowed to approach its full correction level.
Trademanagement:
- I'm placing long orders at each level and SL right before the next level. (If the price continues climbing, I’ll adjust the trend reversal level (orange) accordingly and update my limit orders.)
- Once the trade reaches a 2 R/R, I’ll move the stop-loss to break-even.
- From a 3 R/R onward, I’ll start locking in profits.
✅ I welcome every correction from here on —
but I won’t enter any new positions at these top levels.

XRP LongFollowing a significant decline, the asset will take support and bounce back from this point.
Disclaimer: This is not financial advice.
This algorithm provides highly precise buy and sell signals with alerts:

XRPUSDT - range projection Measures the possible price projection for XRP x0 . The large whale of over 1 billion in volume makes a good case that someone with smarts knows that this asset has a bright future. the platform where the exchange was made couldn't fill quick enough. Generally a whale or even a mini whale will be expecting to double their investment to take money off the table and that usually happens at the last resistance, so if the last solid resistance was a $ 3:00 you can expect a buy price of around $ 1:50...... anything lower than that is a bonus to stay on top of any possible draw down.

Perfect Wicoff pattern..XRP is showing this structure with clear volume confirmation, strong support/resistance reactions, and a spring phase — it would be considered a “perfect” Wyckoff accumulation pattern.

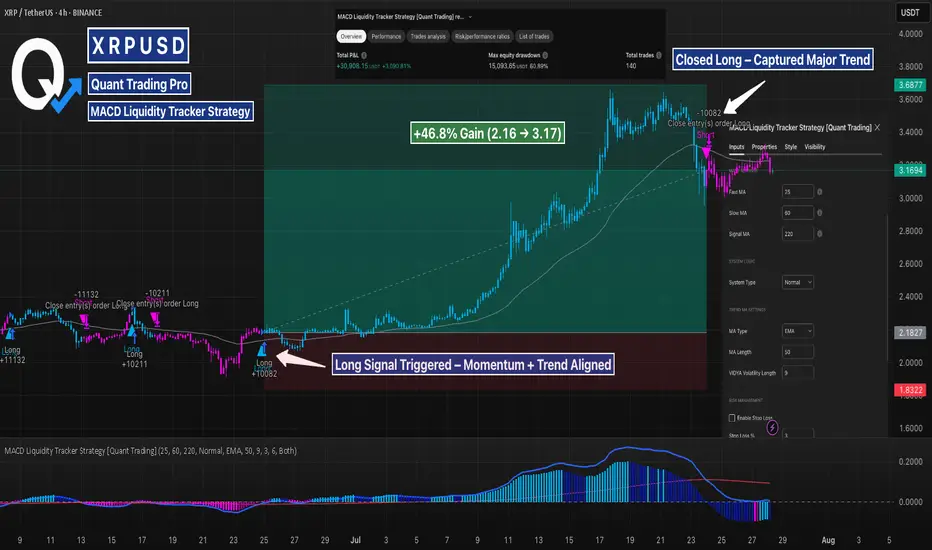
XRP MACD Liquidity Tracker Strategy – Clean Trend Catch (4H)This backtest showcases how the MACD Liquidity Tracker Strategy handled a major trend shift on XRP’s 4H chart. The long was triggered once MACD momentum aligned with the 60/220 EMA trend filters — clean confirmation without noise.
The system stayed with the move through a multi-day rally and exited as momentum began to fade. Visual bias (blue = long, pink = short) made trend context easy to follow, and the settings ensured no premature signals during consolidation.
📊 Strategy Inputs:
MACD: 25 / 60 / 220
Trend Filter: 60 & 220 EMA
System Type: Normal
A great example of how combining momentum + trend confirmation filters can remove second-guessing. This is Backtest Idea #1 in a 10-post strategy series.
XRP Bulls Returning We have seen XRP take some dips to 2.99 and reject strong. 3.00 support has been formed and we could see XRP moving to $4 this week if the higher low point is on the charts. Fundementals say that XRP banking is in a pending state, also rumor says that their Lawsuit will be dropped completely this week by SEC. Price action tells its all, we shall wait for come bullish hourly candles until we click the buy button

Ripple (XRP): Seeing Smaller Bullish Movement To AccumilateRipple coin has extended itself heavily since november but what we noticed is how close the 200EMA line on the daily timeframe has come to the market price, which is our main point of interest as of now.
More in-depth info is in the video—enjoy!
Swallow Academy