XRP prediction🔍 XRP/USDT Weekly Analysis
📊 Technical Overview:
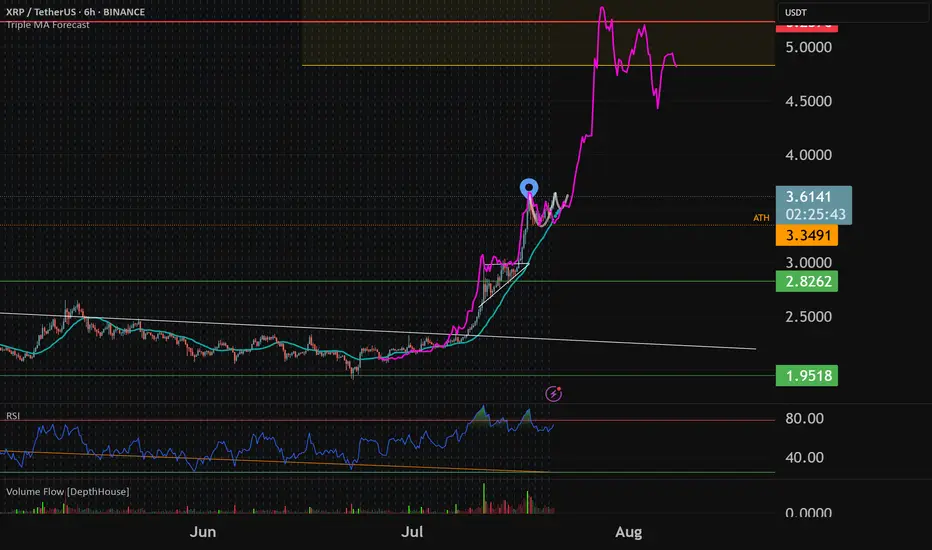
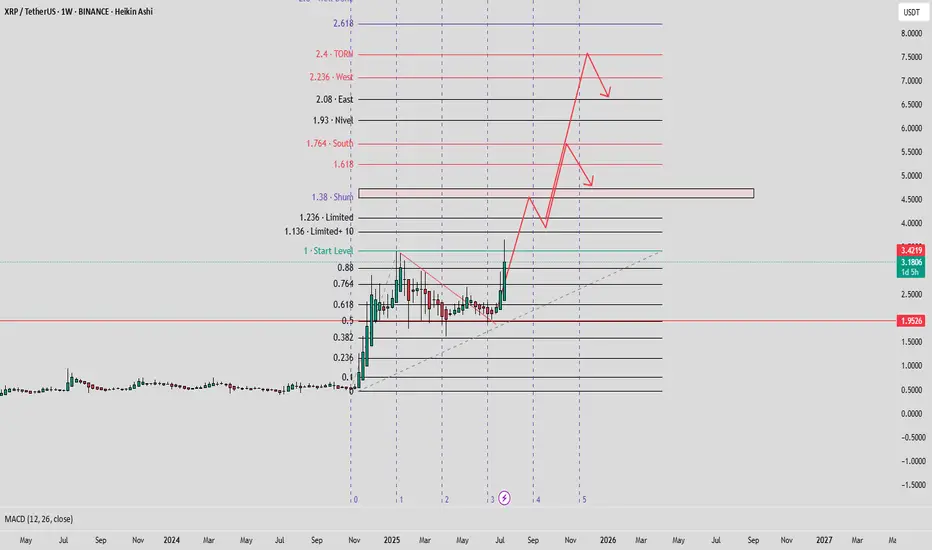
• XRP recently broke out of a long-term descending trendline with strong bullish momentum.
• Key support zone now rests around $2.09 – previous resistance turned support.
• Price is currently consolidating around $3.18 after a strong impulse move.
🎯 Targets:
• First target:
🔸 $4.00 expected around November 2025
• Second target:
🔸 $4.80 expected around March 2026
These targets align with Fibonacci arc projections and historical resistance levels.
📈 Trend Strength:
• Breakout backed by strong volume suggests momentum is sustainable.
• If price holds above $2.94, bullish continuation is likely.
⚠️ Risk Levels:
• Losing support at $2.09 could invalidate the bullish setup and push price back to the lower range.
XRPUST trade ideas

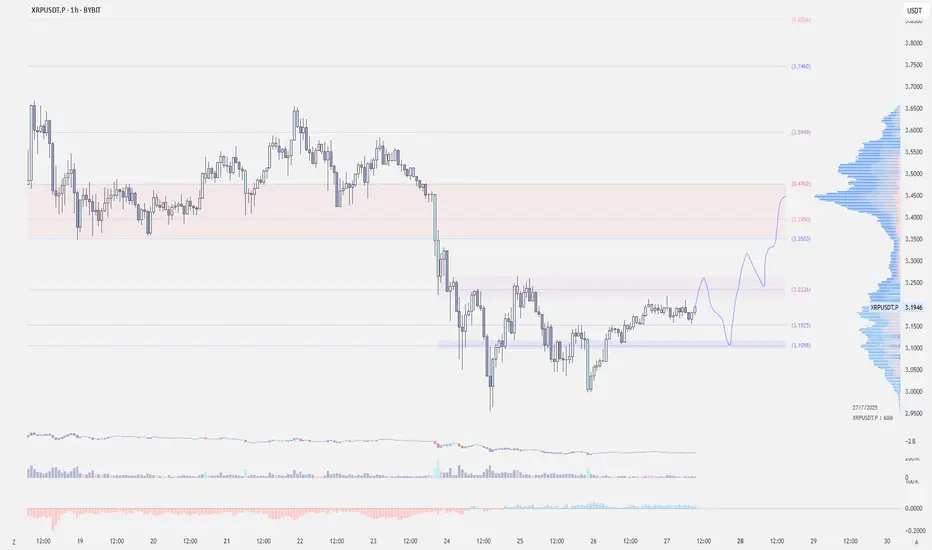
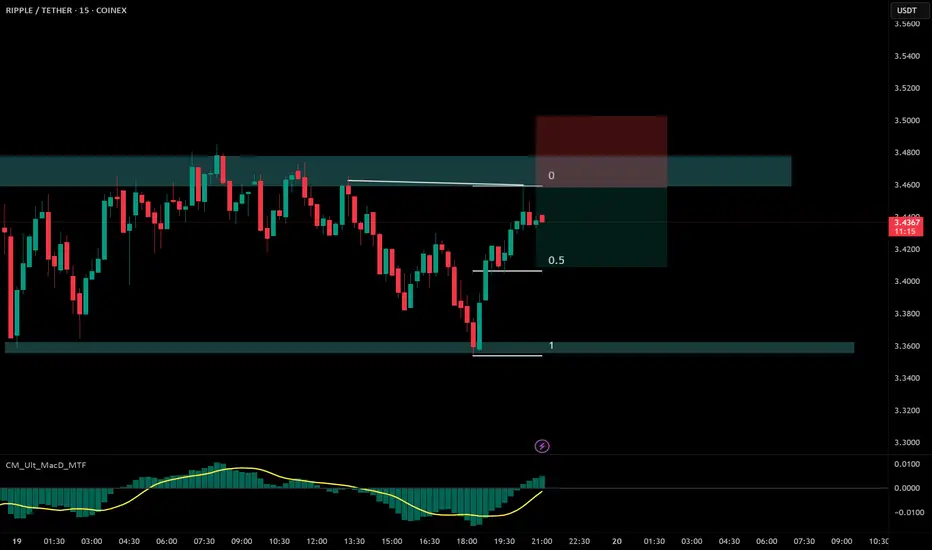
$XRP - Long Trade IdeaCRYPTOCAP:XRP | 1h
Possible retest of $3.24–3.26
If we see rejection, I'll look to enter around $3.12–3.09, targeting $3.35–3.47 (previous value area).
Stoploss set to $3.03-$3
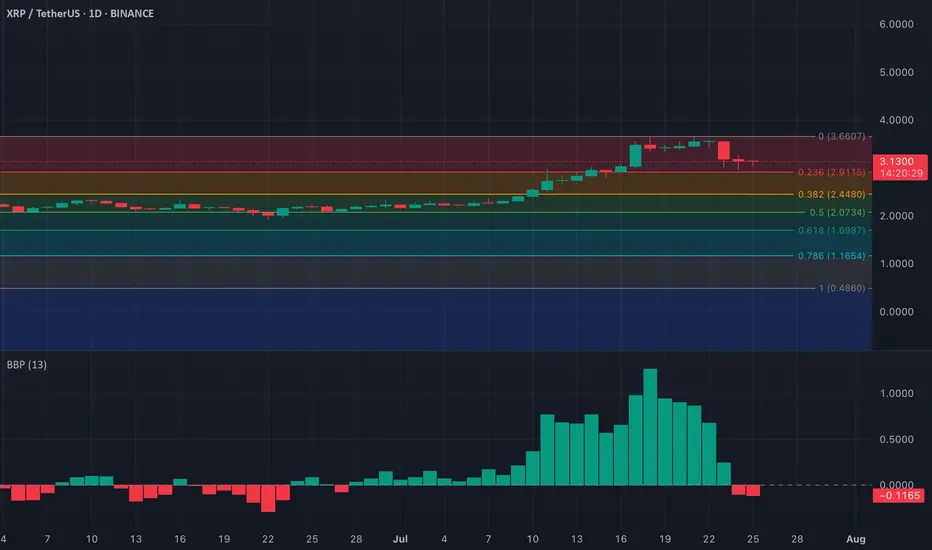
XRP – Bearish Signals from Elder-Ray IndexXRP’s bullish momentum appears to be fading, according to recent readings from the Elder-Ray Index on the daily chart. Over the past two sessions, the indicator has printed consecutive red bars, reflecting a clear shift in sentiment as buying pressure weakens.
The Elder-Ray Index evaluates the strength of bulls versus bears by measuring the difference between an asset’s price and its exponential moving average (EMA). A negative reading, like the one currently seen on XRP, means the asset is trading below its EMA — a sign that bearish pressure is outweighing bullish momentum. Traders may want to monitor closely for further downside confirmation.
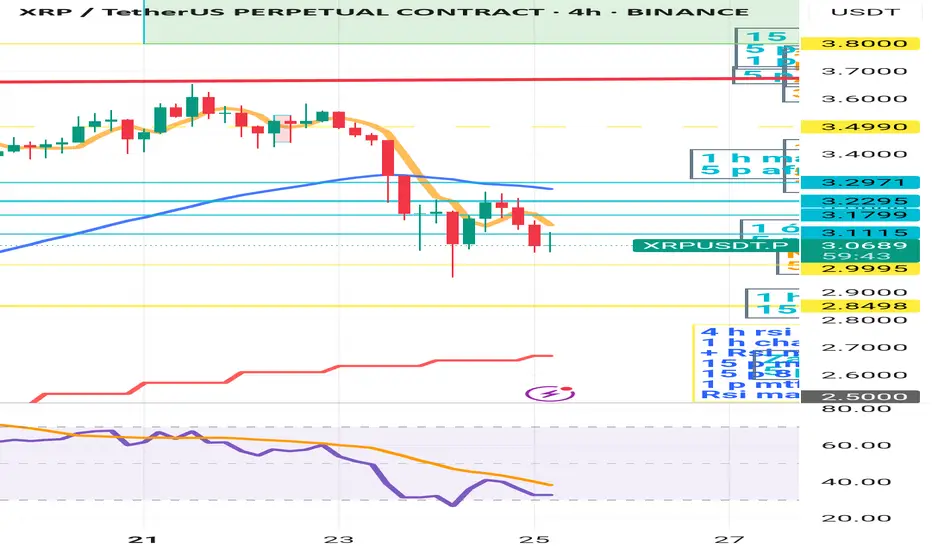
XRP is still waiting for a longI think that XRP - and looking at the Total Market Cap chart - has taken a downward trend. Although the RSI is well above 70 on the daily timeframe, the faster leg is already approaching 50. Looking at the 4-hour RSI, as long as it is below 50, I do not expect an upward movement. I see a chance for further upward movement if the chart is currently above $3.2971. It is worth watching the 4-hour 50 EMA for possible long position opening, but only if the price crosses the 4-hour 50 EMA upwards. There could be a danger if it breaks the 50 EMA on the daily, which will be around $2.7. I should add that the 4-hour 200 EMA is around $2.8, so there will be a band between 2.7-2.8 where the chart can dance before deciding which direction to take. As long as the RSI MA is above 50 on the day, long-term positions - which were started around 2023 - should not be negatively affected by this "small" sell off. I think it is worth waiting for now for longs, not to enter an upward trade into the declining chart. Attention should be focused on the 4-hour 50 ema/chart cross, and the 4-hour rsi MA 50 cross. Until these are met, starting a long is life-threatening. I am curious how you see it.
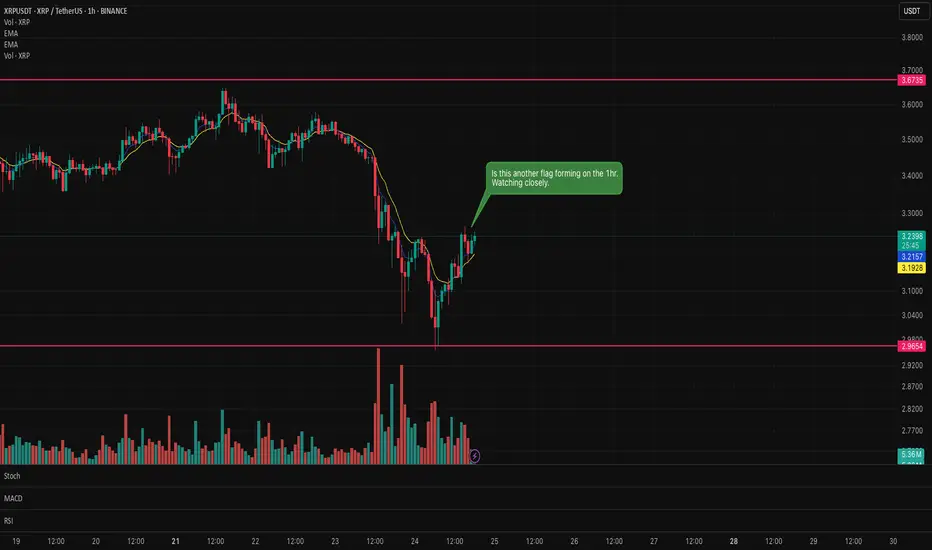
Is there another XRP flag forming on the hourly chart?Could be another flag forming on XRP. Waiting for the formation to prove confirmation as to whether it will be a bull or bear flag.
News of large amounts of XRP entering the exchanges from the CEO could mean a bear flag?
It's only appearing on the hourly so it could be a false flag.
Let's what and see what forms on the hourly candle.
XRP Bear flag confirmed. Looking for support in the decline.XRP bear flag identified on Monday 22nd has now confirmed with a nice 12% short sell.
This signals do not always confirm but when they do it is satisfying that the analysis and patience has paid off.
Trading is all about controlling emotions and being patient. Wait for the confirmation before executing.

XRP Hello friends, Ripple will probably rest a little on the middle line of the channel. Any lower is a buying opportunity, in my opinion 4.

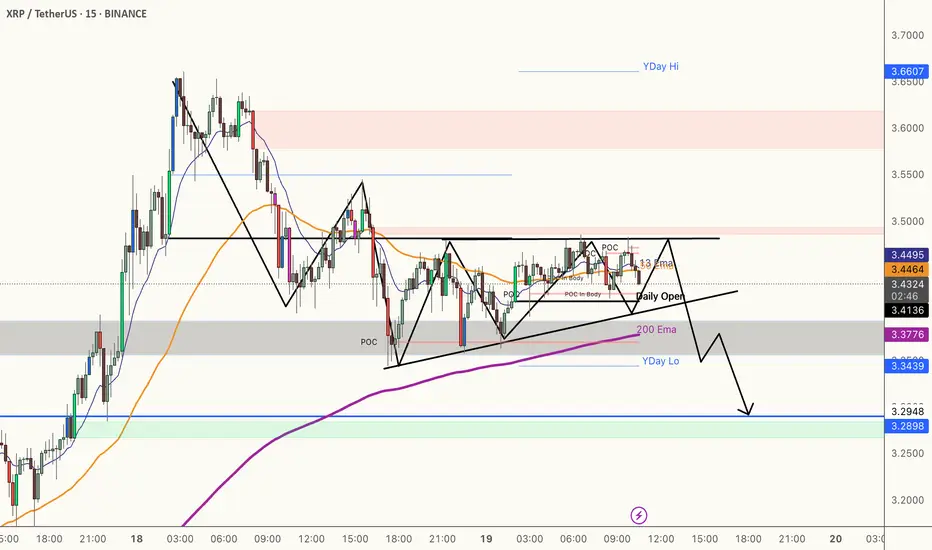
Weekly trading plan for XRP BINANCE:XRPUSDT Last week played out perfectly - price followed our green scenario, broke through resistance, and hit all targets. Now we're clearly in a correction phase. Here's what I'm watching:
$3.16 level - Waiting for this to break before expecting consolidation in that former resistance zone
$3.30 pivot - This week's key reversal level
$3.45 resistance - If we break $3.30 but can't push past $3.45, we'll likely see the correction extend down to $3
Not making predictions here - just setting the levels that'll tell us what's next.

$XRP SHORT POSITIONING 🚨 XRP Market Update – July 22, 2025
📉 Current Price: ~$3.49 USD
24H Range: $3.43 – $3.64
24H Volume: Over $10 Billion
Market Sentiment: Slight correction amid broader crypto market pullback.

XRP To $5-$5.25Typical XRP breakout pattern. Expect cup and handle consolidation to keep forming this week before a quick move to $5 before th end of the month. From there i expect a broader market correction but final pt's around $6-7
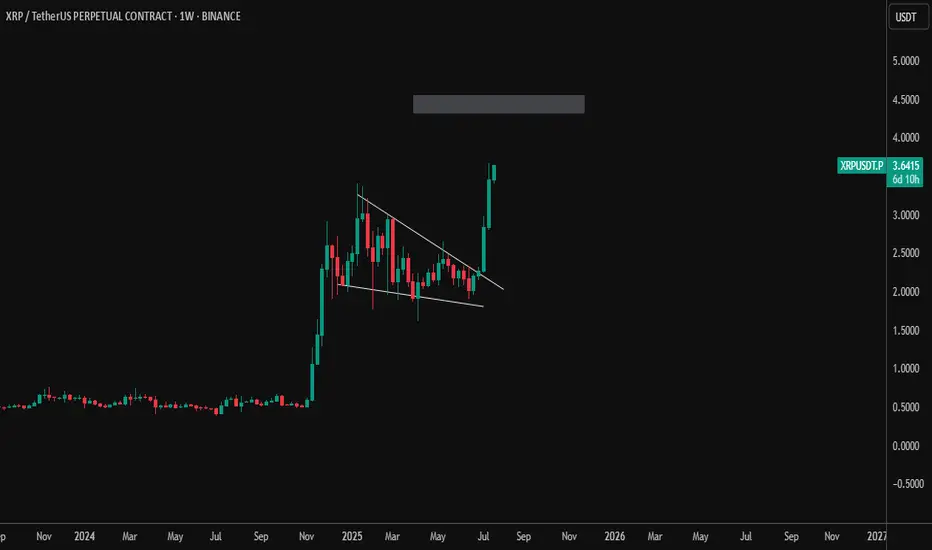
#XRPUSDT – Massive Breakout from Bullish Pennant | Eyeing $4.80+XRP has exploded out of a multi-month bullish pennant formation on the weekly timeframe, confirming a strong continuation pattern after a period of consolidation.
🔹 Key Technical Insights:
✅ Bullish pennant structure formed after a parabolic run
✅ Strong breakout candle with volume confirmation
🔼 Price now testing $3.60+ area
🎯 Target zone next: $4.80–$5.00, aligned with previous price inefficiencies and psychological resistance
📌 Why This Matters:
XRP is showing one of the cleanest technical breakouts among large-cap altcoins
Weekly breakout from consolidation = high probability continuation
Ideal for swing traders looking for momentum plays
As long as the breakout structure holds, XRP could continue its rally toward the upper target range.
XRP intra?
Hi
We have a mini break @ 3.55 ( 2 times this high )
Mini becoz we have a higher price to break 3.65
This is a good indication= printing higher prices
30m formed a triangle
Will it break this bullish triangle and make new high/ test 3.65
Void= if triangle break lower.. (then will be looking another setup)
Trading, stop loss ready.. if printing less than 3.55 range to 3.50.
All the best
Not a guru
This not a signal.. coz u 'll need to think before entry

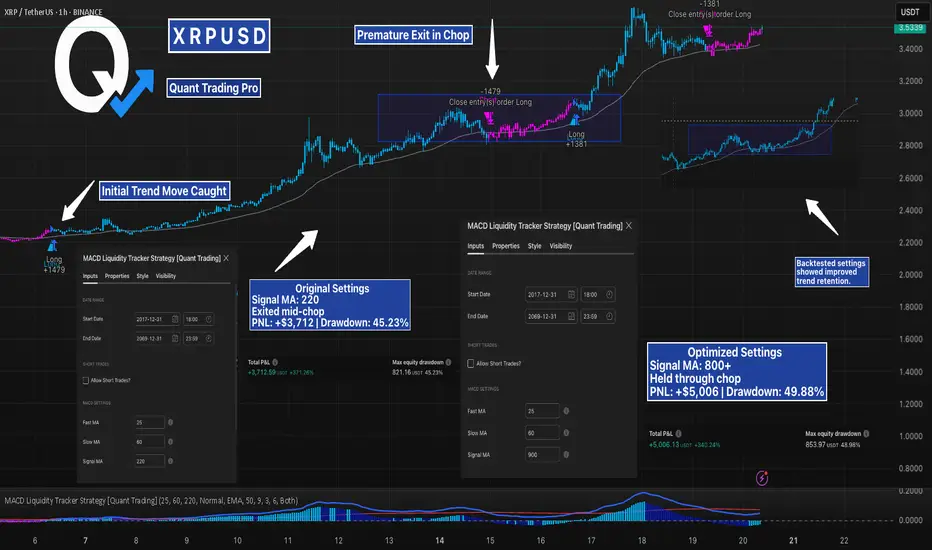
XRP- Caught The Move. Then Got Chopped. How Backtesting Fixed ItXRP printed a strong trend — and the strategy caught it early. But partway through the move, price stalled in a tight range and the position was exited early.
That’s where backtesting and tuning come in.
In the first test, the strategy used default settings with Signal MA = 220. It entered cleanly, but exited mid-chop.
After adjusting the Signal MA to over 800, the strategy started holding through the noise and stayed in the move — with higher PNL and a slightly increased drawdown. Ended on 900.
This is the power of understanding how your system behaves in different conditions.
By adjusting signal sensitivity, you can reduce premature exits without chasing every move. The goal isn’t perfection — it’s better retention of valid trends without overfitting.
This example shows how simple tweaks, backed by clear test results, can make a measurable difference.
—
#XRPUSD #Backtesting #MACDStrategy #LiquidityTracker #CryptoTrading #TradingView #QuantTradingPro #StrategyOptimization #TradingSystems
XRP - Long termIt should be noted that any asset may experience a sudden decrease in value, but XRP has had a slight decrease in price after a 150% increase from the price of $0.50. Although this currency will definitely increase in the future, it is necessary to pay attention to the decreases and make purchases within the price support areas because these support areas are highly regarded by the general public. In this analysis, two limits have been identified that are used to enter the market in the event of a price drop.
Sasha Charkhchian


#XRP ALMAZOV PROJECTION#XRPUSD ALMAZOV PROJECTION WEEKLY
Price projection according to Almazov's theory, Bitcoin should at least touch $1.3, before pulling back or continuing to go long if its dimensionality decreases.
XRPUSDT SELLConsidering the divergence and price patterns and price support, expect a drop to the price of the opinion model.
Ripple Update: Is XRP Ready for Another 500% Growth?Hey friends, it’s Skeptic 🩵 . In this video, I’m giving an update on Ripple’s conditions , reviewing past triggers, and what to do with your long positions in futures if you’re still holding. For spot, what’s the move? I dove into XRP/BTC analysis and, at the end, broke down BTC.D , which just had a major event you need to pay close attention to. Don’t forget money management, and stay clear of FOMO. Drop your thoughts on XRP in the comments so we can chat about it!

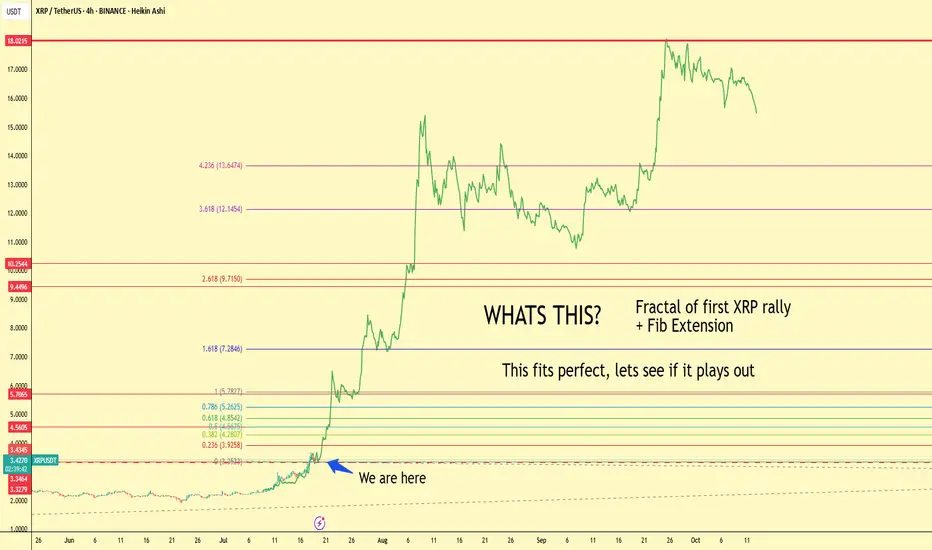
18$ XRP Mapped Out Projection – HOLD🚀 Just sharing some insights to help you explore what XRP might be capable of.
The chart you see here is a projection inspired by the path of XRP’s first major bull run. Surprisingly, I was able to map out around 95% of the key support and resistance levels using the Fibonacci extension tool.
📚 A little history lesson — while history doesn’t repeat itself exactly, it often rhymes in patterns.
Let’s see if XRP has another surprise in store for us this cycle. 🔄✨
#XRP #Crypto #FibLevels #Bullrun #ChartAnalysis
XRP : ETF...Hello dears
Considering the good growth we had, you can see that the price is stuck in a long-term range and has not managed to break it yet...
We must be prepared for any scenario, so the best thing to do is to buy stepwise, of course with capital and risk management.
Note that this analysis is on a daily time frame and may take a while, so if you are not patient, do not enter.
*Trade safely with us*

XRP needs a short and fast correction!After a long ride with HL triangles and pomps, it looks like an LH triangle and correction is on demand as TOTAL2 hit its big resistance.
Be wealthy and follow your strategy❤️

XRP - Time to buy again!The price has shown strong growth after breaking the head and shoulders pattern, and this upward trend may not end here. It could reach around $4 after a slight correction.
Best regards CobraVanguard.💚

XRPUSD ShortI expect XRP to make another move to the downside for a larger correction before we see further bullish momentum. On the 15-minute timeframe, a triangle pattern is currently forming, suggesting that a break below the 200 EMA is likely