XRP – Dual Trends Active, Ready to Outperform - $7 Incoming
Two active trends on CRYPTOCAP:XRP right now—monthly and weekly confirmations are in, which significantly boosts the probability of hitting the first target.
Honestly, I see this outperforming CRYPTOCAP:ETH , though both are worth holding.
With both timeframes aligned, I’m expecting a strong move.
Targeting $7 on CRYPTOCAP:XRP and over $7k on $ETH.
XRPUST trade ideas
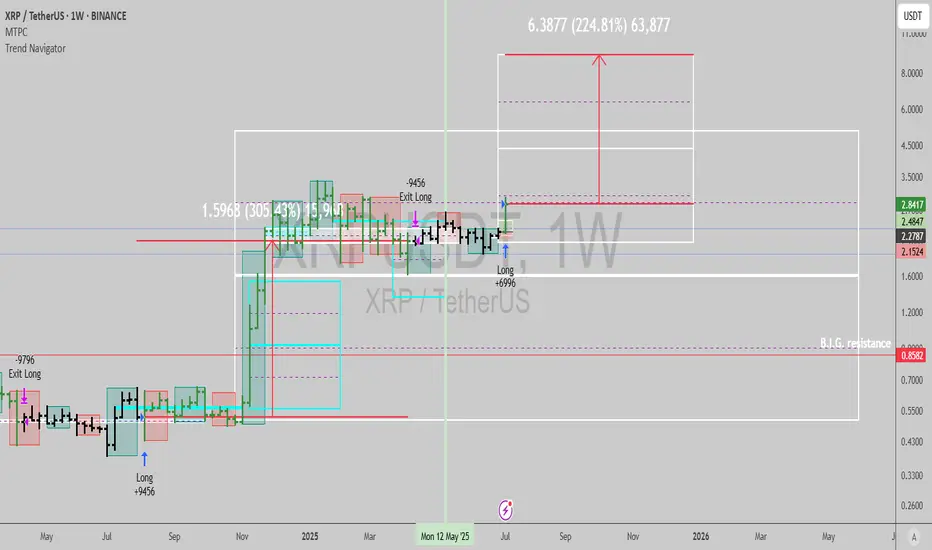
$XRP: Long term buy signalGN gents, interestingly, Ripple is one of the strongest charts in crypto currently, and it has flashed long term buy signals indicating the bull market continues NOW.
The last trade netted 305% upside, I estimate at least 224% can be achieved from here, with very low risk.
Best of luck!
Cheers,
Ivan Labrie.
XRP-- Ripple Hi everyone
Xrp can have another upward leg and there exists some fundamental support.
So in my opinion these levels are good to buy some.
DYOR!
Good luck

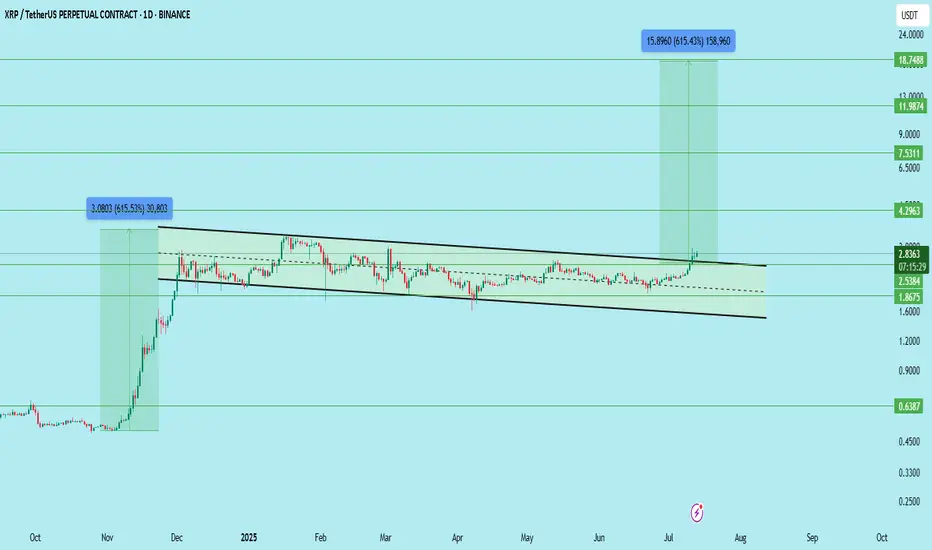
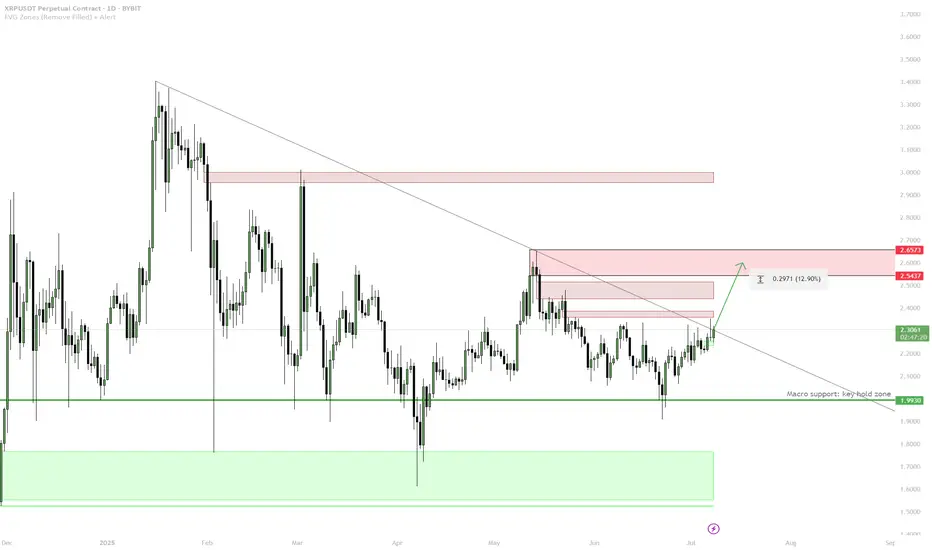
XRP/USDT – Long-Term Breakout Setup FormingXRP has broken out of a multi-month falling channel and is showing early signs of a macro bullish shift. However, price has printed a series of strong green candles, so waiting for a clean retest before entry is advised.
Key Levels:
Support Zones: 2.5384 | 2.00 | 1.8675
Resistance Zones: 2.8340 | 4.2963 | 7.5311 | 11.9874 | 18.7488
Breakout Level: 2.5384 (channel breakout and current structure retest area)
Setup Strategy:
Entry (Ideal): On retest near 2.53–2.60 support zone
Stop Loss: Below 2.00 (or tighter depending on risk appetite)
Target 1: 4.2963
Target 2: 7.5311
Target 3: 11.9874
Target 4 (Final): 18.7488
Upside Potential: Over 600% if the structure plays out fully
Structure Insight:
Multi-month falling channel breakout confirmed
Continuous green candles suggest short-term overextension
Safer entry lies in retest and hold of the breakout zone
Long-term accumulation zone forming between 2.53–2.83
This setup favors long-term investors and swing traders waiting for a macro move. Let the price come to you — avoid chasing.
DYOR | Not Financial Advice
#XRP #Ripple
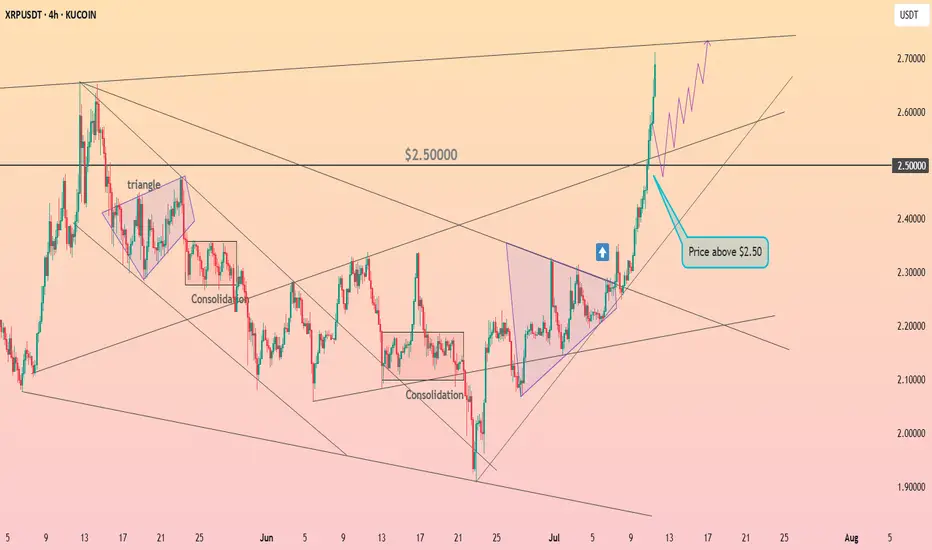
XRP: Bullish Continuation is Imminent!Keep an Eye on XRP
Now is the time to watch XRP. If the price breaks to the upside, we could see a significant move that might take it above $2.95!
Trading Setup
If you’re considering trading XRP, here’s a quick setup that may help you.
The idea is: Buy when the price breaks above $2.5 and take profits at the levels shown in the chart.
Targets:
1. $2.6
2. $2.75
3. $2.95
-------------------------------------------
About our trades:
Our success rate is notably high, with 10 out of 11 posted trade setups achieving at least their first target upon a breakout price breach (The most on TW!). Our TradingView page serves as a testament to this claim, and we invite you to verify it!

Xrp cup and hundleChart Xrp/usdt (4h)
Classic cup&hundle breakout in play. price broke above the neckline $2.5 with strong volume, followed by a clean retest of the breakout zone

#XRPI would look for a 1.80 1.90 low but don’t count on dipping much below 2 usd if at all. Set buy targets from 1.60’s up to low 2.00’s like 2.13
As much as I hate to admit it the XRP is truly an army not to mention that chart looks super strong esp with fed rate cuts coming within the year or t least announce a new fed chair

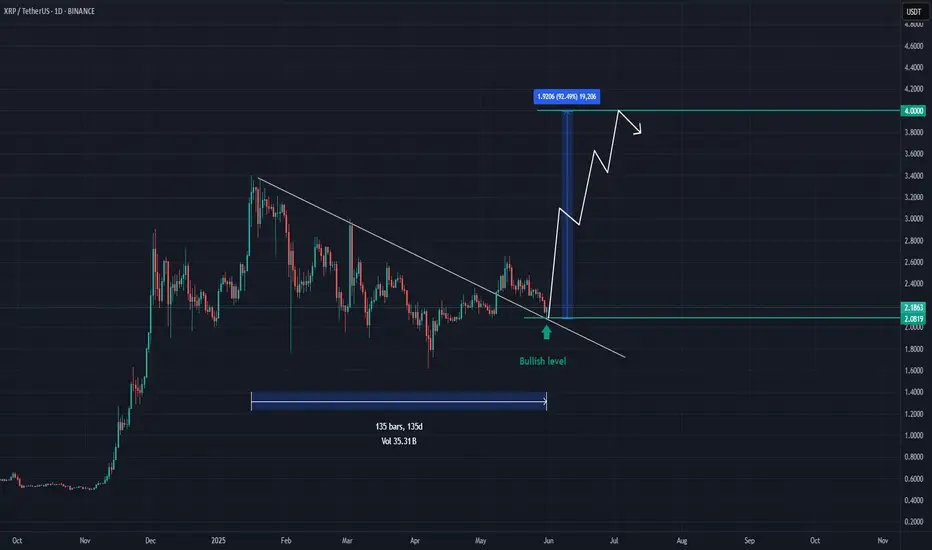
XRP - This is one of many great opportunitiesXRP is reaching a solid level of $2.1.
I believe this level will attract investors for the following reasons :
Technicals :
After breaking the main resistance trendline, XRP is now reaching a solid support level presented in green.
Price action :
- In accumulating since Jan '25
- Resisted to last market dumps
Beyond technicals :
- Very strong community
- Real services and strong team
Market sentiment :
The investors are now looking for a strong asset to invest in. They may switch their alts to any coin that shows strenght. For now, XRP is on the top list.
Recap :
- Risks : bad news from the team , whales dumping , ...
- Main Target : $4
- Reward : near 100%
BITSTAMP:XRPUSD COINBASE:XRPUSD BYBIT:XRPUSDT.P CRYPTOCAP:XRP KUCOIN:XRPUSDT
Bullish Flag on #XRPWe can see a clear picture of #XRP forming a bull flag, it will stay and consolidate as traders take off of profit. Price will have a new accumulation zone prior to another leg up, its a matter of time it makes ATH. As the price is discovering new zone, a fib golden zone puts it at $ 5.6 and a bull flag to $10 for sure.
The bears need to step in and invalidate the breakout that's to happen before their eyes and suppress the price from discovering in order to secure profit.

XRP breakout above $2.29 Confirmed – Is $4 the Next Stop? #LONGAt the inflection point of $2.29, the long-term trend broke out, suggesting the price could run up to $3.00 and potentially $3.40 with continued positive sentiment. A news catalyst could trigger a rapid spike towards $4.00.
At $2.70, #FOMO traders entered. Following a short period of consolidation and breakout, the price reached a high of $2.90.
The price action remains bullish and is currently in a zone of interest that could attract previous investors and traders. A news catalyst is key to bringing in the necessary liquidity and volume. If buyers can hold the price within this zone, we may see a continuation of the pattern.
A retest of $2.90 followed by a slight pullback to $2.70 is possible before the uptrend resumes.
XRPRipple’s CEO Brad Garlinghouse has made bold statements in 2025 about XRP’s potential to disrupt and capture a significant share of SWIFT’s cross-border payments market. Here are the key points:
Ripple’s Ambition vs. SWIFT
Goal: Ripple aims to capture up to 14% of SWIFT’s current cross-border payment volume within five years. SWIFT currently handles over $5 trillion daily in money transfers and more than 45 million financial messages.
Focus on Liquidity, Not Just Messaging: Garlinghouse emphasizes that SWIFT’s traditional strength is in messaging between banks, but the real value lies in liquidity—the actual movement of funds. Ripple’s blockchain-based XRP Ledger offers both messaging and instant liquidity, enabling faster and cheaper cross-border transfers.
XRP as a Bridge Currency: XRP facilitates instant currency conversions, reducing the need for banks to hold large foreign currency reserves in multiple countries, freeing up capital and improving efficiency.
Why XRP Could Gain Market Share
Speed and Cost: XRP transactions settle within 3–5 seconds and cost less than a cent, compared to SWIFT transfers that can take days and cost $20–$50 per transaction.
Central Bank and Institutional Interest: Several central banks are reportedly studying Ripple’s network alongside SWIFT’s systems in pilot programs, signaling growing institutional acceptance.
Blockchain Integration: Ripple is launching an Ethereum Virtual Machine (EVM)-compatible sidechain on the XRP Ledger, expanding its ecosystem and utility for decentralized applications, which could enhance adoption.
Legal Clarity: Following the SEC’s dismissal of remaining claims against Ripple in mid-2025, XRP’s legal status as not being a security has boosted confidence among investors and institutions.
Potential Impact on XRP Price
Experts suggest that if XRP captures a significant portion of SWIFT’s liquidity layer, its price could rise substantially, potentially reaching three-digit levels in USD.
Current XRP price is around $2.25–$2.92, up over 300% since late 2024, but many analysts believe it remains undervalued relative to its utility and potential market share.
Summary
Aspect Details
SWIFT Daily Volume $5 trillion+ in cross-border payments
Ripple’s Target Market Share Up to 14% within 5 years
XRP’s Role Bridge currency providing instant liquidity
Transaction Speed & Cost 3–5 seconds, <$0.01 vs SWIFT’s days and $20–$50
Institutional Adoption Increasing, with central bank pilots underway
Legal Status SEC claims dismissed; XRP not a security
Price Potential Analysts project possible three-digit USD price
Conclusion
Ripple is positioning XRP as a disruptive alternative to SWIFT’s legacy system, focusing on liquidity and speed rather than just messaging. With growing institutional interest, blockchain innovation, and a clearer legal environment, XRP could capture a meaningful share of global cross-border payments, potentially driving significant price appreciation over the next five years.
#XRP

XRP - Next Upside Price TargetsPlease Refer to our last post:
After we go the first confirmation of the breakout as outlined in the previous post we have now blown through the second confirmation. Instead of the retest we got a break of the LTF high starting an upwards trajectory.
Now price is fighting the 0.786 right around the psychological $3 level. If we are able to hold above the 0.618 ($2.70) and continue our rise past $3. Most likely price will rapidly increase to the yellow dotted line around $3.30 with our high only being $0.10 above that.

Good moment for try to Buy XRPGood moment for try to Buy XRP. We are in a sideways trend and are now approaching its upper border. We will take a breakout. Stop under the lower line of the channel. We'll see

XRP is making moves!Will it break $3, or drop back to $2? Previous Cycles showed that a correction might be next in line for the crypto market as a whole. Which means, if it happens, altcoins will get affected a lot...Do not get shaken out, after the correction expect a huge rally, but for now...it might be a perfect point to secure some profit.
Not investment advice.
#xrp #bitcoin #crypto #short #analysis
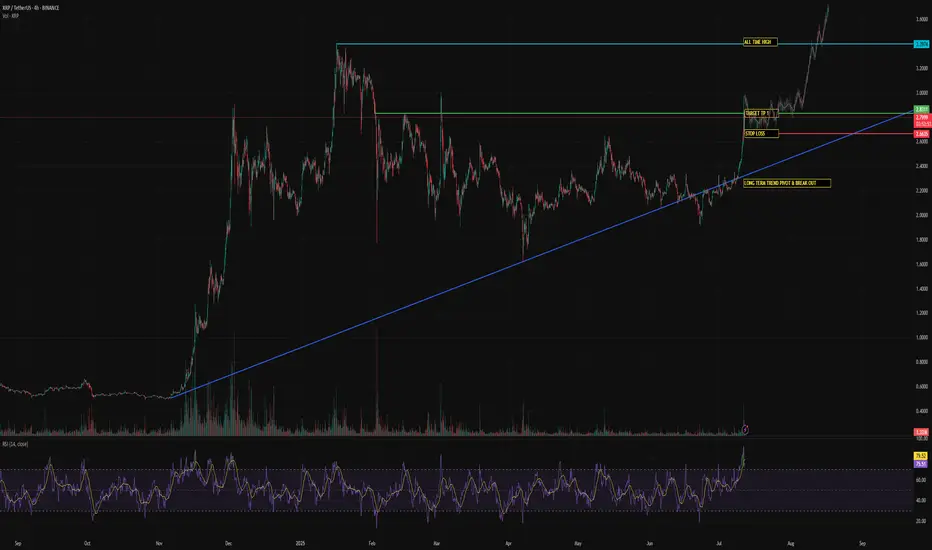
XRP — Macro Support Hold & Redbox Target1. Macro support (1.99) held — bullish bias
2. Enter on confirmed break and hold above trendline
3. TP1: 2.54–2.60 (first redbox)
4. TP2: 2.65+ (next supply)
5. Stop: Below macro support = invalid
Xrpusdt 4hr time frame bullish iH&SComing from bearish 1st tp area (fib 1.217) from our previous bearish activated pattern " " and now invalidated is a bullish strong move on my POV, as the majority of shorters are taking their profit at the nearest support as sign of fear making a new trend and now formed a bullish ih&s pattern.
Targets are 2.45, 2.6 and 2.8. currently trading above 100 and 200 daily ma which is sign of good bullish move.
Pattern invalidation if closes below 2.15.

XRP Ready To Grow: $4.5 w/ 5X Lev = 475% Profits PotentialThe last time XRP moved above EMA55 daily was in early November 2024, you know pretty well what happened right after. Just a few days after EMA55 was conquered as resistance XRP grew from a price of $0.54 to a peak of $2.90 in less than one month. It continued to rise and peaked again but this time at $3.40. The market turns bullish above EMA55 and this same signal is active, valid, live today.
XRPUSDT has been fighting with EMA55, fluctuating around this level, since late April. Now, this resistance is no more. The bullish bias is fully confirmed after a decisive higher low. This is it... This is all we need, the next target is up.
» 95% is the easy target at $4.50. With 5X lev. we get 475%.
We've done this together many times before... This is not the last target but since this is a strong resistance we can wait for the retrace and enter again once support is found. That is, there will be a stop at this level.
This is a strong chart setup. The price is not the best ever, it would be better to enter lower and that is why we have only 5X. With a lower price we can do 7X, 8X and even up to 10X. Hardly ever I recommend more than 10X, it just isn't necessary and the risk is too high.
I am wishing you great profits and continued success.
This is a friendly reminder to let you know that XRP is ready to grow.
Thank you for reading.
Namaste.

HolderStat┆XRPUSD above the $2.5KUCOIN:XRPUSDT has rallied sharply, breaking above the key $2.50 resistance following multiple consolidation and triangle patterns. Momentum remains strong, and price structure supports continuation toward the $2.75 resistance zone.
Ripple (XRP): Looking For Breakout | Possible Good Buy EntryRipple has had an insane buy-side volume lately, and the price is currently testing the local resistance zone (neckline area). We are looking for a proper breakout from this area (which will happen if we keep current buyside momentum as it is). As soon as we get it, we are going to look for a buy entry, which should lead the price towards our major target of the upper resistance zone.
Swallow Academy

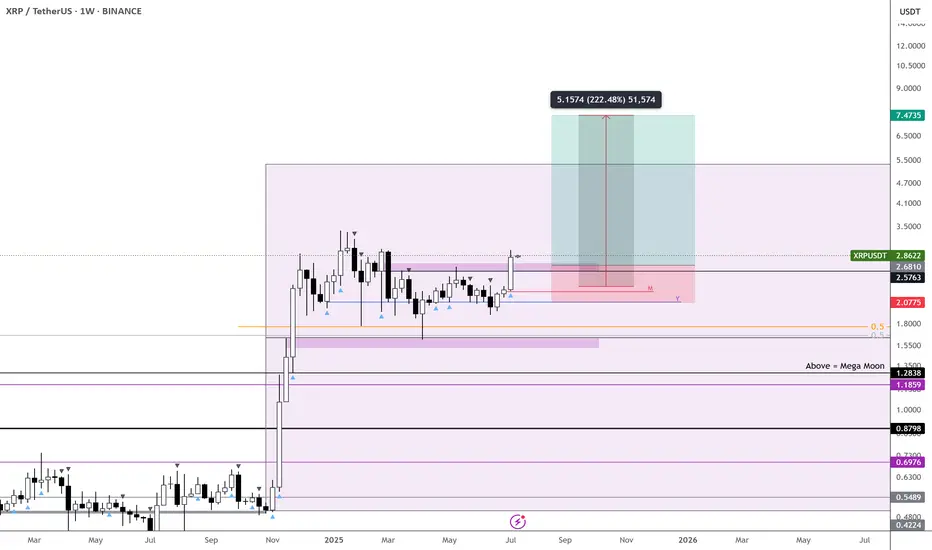
$XRP Bull flag breakout done!🚨 CRYPTOCAP:XRP has exploded from a 7-month bull flag accumulation pattern! 📈🔥
A clean break above $2.40 unlocks the next leg:
→ $3.38
→ $5.10
→ $7.42 potential 🚀
This bull flag has detonated
You had 7 months to accumulate — now comes the markup. So far following the arrows from the last analysis. It should follow the next arrow to 7.5$ as well.

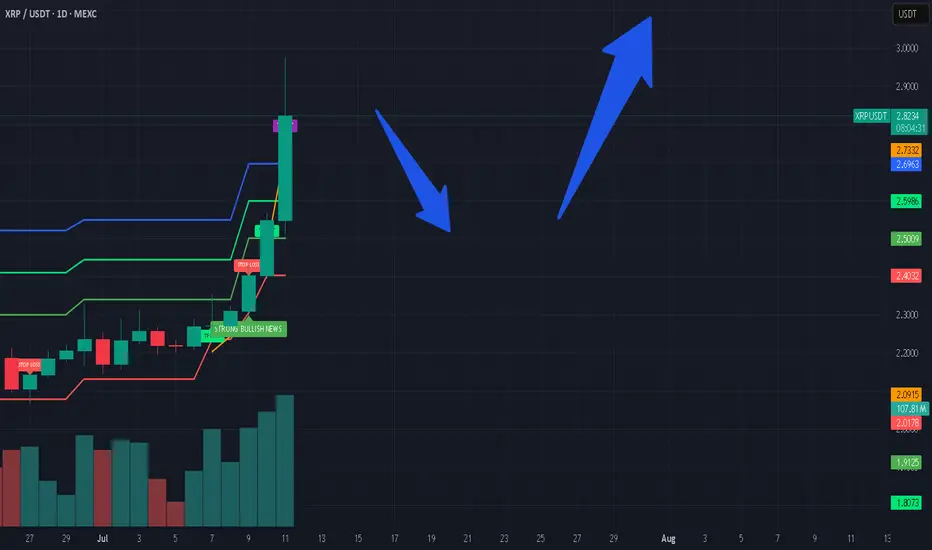
Long XRP, fast 11% profit✅ 1. Buy Zone Identified
The “Buy zone” is a green area where the price has recently been consolidating (moving sideways).
💡 If the price breaks above this level or shows strength here, it could be a good opportunity to enter a long (buy) trade.
🎯 2. Take Profit Target: +11%
The “Take Profits” line above the buy zone suggests a potential 11% upside.
This is where you might want to sell your position and lock in gains if the price moves in your favor.
🛑 3. Stop Loss: -7%
The “Stop Loss” is clearly marked below the buy zone, with a 7% risk.
This is your safety net , if the price falls to this level, the trade automatically closes to prevent further loss.
📦 4. Volume Profile (on the right side)
The blue and yellow bars show the Volume Profile, which highlights price levels where most trading activity happened.
🔹 The cluster near the buy zone means there was strong interest in this area — it could act as a support zone.
🚀 Simple Summary
The chart shows a bullish setup for XRP/USDT.
There’s a clear Buy zone where price is trying to break higher.
The profit target is +11%, and the stop loss is -7%.
Volume data supports this as an important price zone.

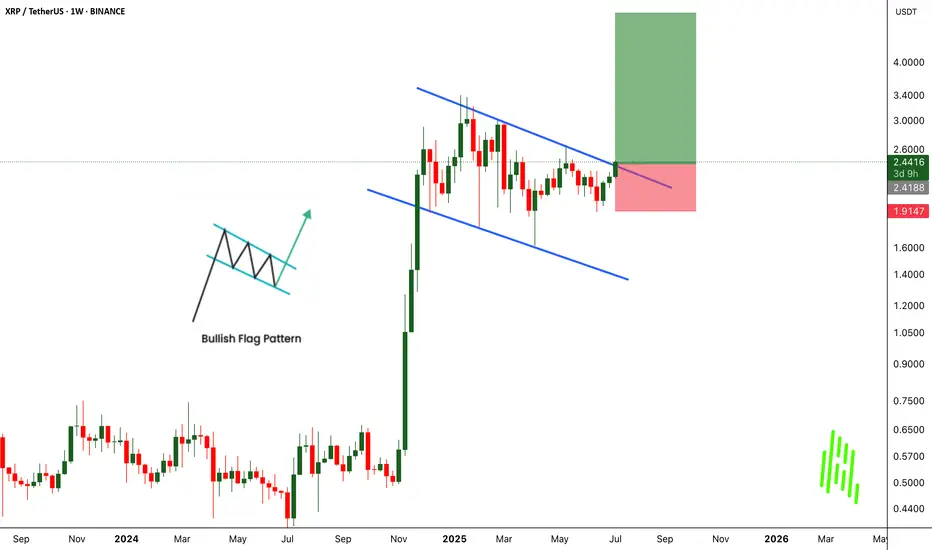
XRPUSDT Breaks Out of Bullish Flag - Big Moves Ahead!BINANCE:XRPUSDT has broken out of a classic bullish flag pattern on the weekly chart, signaling a strong continuation to the upside. This textbook setup is known for its high success rate, and the breakout suggests the potential for significant gains if momentum continues.
The CRYPTOCAP:XRP community remains strong, with long-term holders showing confidence and resilience. With the current market structure and support from loyal investors, there’s a real possibility for the price to double from this breakout zone.
The strategy is simple. Buy and hold for the long term. But as always, traders must manage risk carefully and use a proper stop loss. Let the flag fly high. CRYPTOCAP:XRP could be ready for a major pump from this level.
BINANCE:XRPUSDT Currently trading at $2.43
Buy level : Above $2.4
Stop loss : Below $1.9
Target : $5
Max leverage 3x
Always keep stop loss
Follow Our Tradingview Account for More Technical Analysis Updates, | Like, Share and Comment Your thoughts
XRP - Wait For It!Hello TradingView Family / Fellow Traders. This is Richard, also known as theSignalyst.
📈 Is history repeating itself? 🤔
XRP is now back at the $1.75–$2 support zone and forming a fresh inverse head and shoulders pattern.
As long as this support holds, we’ll be on the lookout for new long opportunities. 🟢
For the bulls to take over in the short term, a break above the green neckline is needed.
And for long-term control, a break above the red structure is essential. 🔺
For now, we wait patiently! ⏳
📚 Always follow your trading plan regarding entry, risk management, and trade management.
Good luck!
All Strategies Are Good; If Managed Properly!
~Rich
