XTIUSD trade ideas

USOIL Bearish Reversal Setup from Rising Wedge Near Value AreaThis 1H chart of USOIL (WTI Crude Oil) shows a clear rising wedge formation approaching a strong supply zone near the $75.07 resistance level. The projection suggests a potential liquidity grab above the wedge, followed by a sharp bearish breakdown. The target for the drop is around $66.36, indicating a significant downside move after a failed breakout attempt. Price action traders should watch for bearish confirmation once the structure breaks.

Strait of Hormuz risk priced in—or not yet?Iran has repeatedly threatened to block the Strait of Hormuz during periods of heightened tension with the U.S., notably in 2011, 2018, and 2020. The Strait is considered the world’s most critical oil chokepoint, with nearly 20 million barrels passing through daily.
Several banks warn that a full closure could push crude prices above $120–$150 per barrel, or higher if the disruption is prolonged. Still, most analysts view a complete shutdown as unlikely, since Iran also depends on the Strait to export its own oil.
Technically, recent WTI candles suggest that the risk premium may be fading. Price action near $74 shows hesitation, raising the risk of a developing double top—particularly if support at $70 fails. Unless tensions escalate materially, such as the U.S. becoming more directly involved, WTI may consolidate between $70–$74.

WTI CRUDE OIL: There is no better time to sell that this.WTI Crude Oil has turned overbought on its 1D technical outlook (RSI = 71.048, MACD = 2.830, ADX = 41.529) and this is technically the most efficient level to sell on the long term. Not only is that the top of the dotted Channel Down but last week the price got very close to the 1W MA200, which has produced the last 3 major rejections since the week of August 12th 2024. Technically the market still has some room to move upwards and test it but since it rose purely on the latest Middle East conflict, it is more likely than not to see an equally quick price deflation and rebalancing. The earlier bearish waves (September 2023 onwards), initially targeted the 0.786 Fibonacci level and then bounced. That translates to TP = 61.00 (at least) towards the end of the year.
See how our prior idea has worked out:
## If you like our free content follow our profile to get more daily ideas. ##
## Comments and likes are greatly appreciated. ##

Analysis of the latest crude oil market trendCrude oil prices stabilized after a sharp rise on Tuesday, with the market keeping a close eye on the potential escalation of conflicts in the Middle East. According to market surveys, Iran's crude oil export infrastructure has not been directly hit so far, and most of the impacts are still concentrated on shipping. However, analysts point out that if the conflict spreads to the entire region, oil prices are likely to rise further significantly. The current rise in crude oil prices is not only dominated by actual supply and demand but is highly influenced by geopolitics. Market sentiment is extremely vulnerable to disturbances from external events. As the global energy artery, the stability of the Strait of Hormuz provides strong support for oil prices. When the uncertainty of the geopolitical situation intensifies, attention should be paid to the release of U.S. official inventory data and the development of diplomatic processes.
Technical analysis of crude oil: The moving average system is in a bullish arrangement, and the medium-term objective trend direction is upward. The current trend is in the rhythm of the main upward trend. The fast and slow lines of the MACD indicator coincide with the bullish columns above the zero axis, indicating that the bullish momentum is currently full. It is expected that the medium-term trend is expected to usher in a rising rhythm.
you are currently struggling with losses,or are unsure which of the numerous trading strategies to follow,You have the option to join our VIP program. I will assist you and provide you with accurate trading signals, enabling you to navigate the financial markets with greater confidence and potentially achieve optimal trading results.
Trading Strategy:
buy@72.0-72.5
TP:74.0-74.5

WTI drops as Trump keeps markets guessing Despite a huge draw in US crude inventories - not that this was going to move the market given the focus being firmly fixated on the Middle East situation - oil prices fell as Trump kept markets guessing about US military involvement in Iran. The US president said: "I may do it. I may not do it. Nobody knows what I’m going to do." The US president also revealed that he told Israel PM Netanyahu to keep going, but has not given an indication that the US will provide more help. Meanwhile, Iran has issued an evacuation warning for residents of Haifa, Israel. This suggests that the conflict is far from over. But for now at least, the US is not getting involved, if one can believe Trump.
Anyway, WTI is now back at short-term support here, around the $72 handle. If it goes back above $73.00 again then we may see momentum build up again to the upside, especially if the war between Iran and Israel escalates.
By Fawad Razaqzada, market analyst with FOREX.com

Oil Traders Brace for Impact: US War or Pullback?WTI Crude Oil – Intraday Update: Tension Builds Inside Rising Channel
1H Technical Outlook — June 18, 2025
🧭 Current Market Structure:
WTI is currently trading at $72.54, holding above key support but struggling to break through a strong intraday supply zone around $73.80–74.00. Price has formed a rising channel, gradually climbing with higher highs and higher lows—often a pre-breakout structure.
Momentum on the Stochastic oscillator is turning, suggesting the market is preparing for a strong directional move.
📊 Key Technical Levels:
Resistance Zones:
$74.00 – intraday supply
$76.00 – swing high zone
$78.00+ – war-driven extension target
Support Zones:
$70.00 – mid-channel & psychological level
$68.00 – previous breakout zone
$66.00 – bearish continuation target if war is ruled out
🔺 Scenario 1: US-Iran War Escalates (Bullish Breakout)
If the U.S. launches airstrikes or there is confirmed military escalation:
Expect immediate breakout above $74.00.
Price likely to test $76.00, followed by an impulsive move toward $78.00+.
Intraday traders should watch for breakout retest setups on lower timeframes (M15/M5).
🛢️ Market could price in a $5–$10 geopolitical premium per barrel within hours if conflict begins.
🔻 Scenario 2: No War / De-escalation (Bearish Breakdown)
If headlines signal de-escalation or diplomacy:
Rising channel may break to the downside.
WTI could fall back to test $70.00, and if broken, flush toward $68.00–66.00 support.
Watch for bearish engulfing candles, divergence, or momentum fading.
📉 Oil often unwinds risk premium quickly when fear fades — beware sharp selloffs.
🔁 Neutral Intraday Note:
Price currently consolidating between $72.00–74.00 inside an ascending channel.
Break above or below this range will dictate momentum.
Wait for confirmation candle close before entering breakout trades.
🛡️ Risk Management:
Avoid large overnight positions — news headlines can cause gaps or whipsaws.
Use tight stops if trading breakout/down; volatility is news-driven.
Consider options strategies for limited risk exposure (calls above $74 / puts below $70).
📢 If you found this analysis valuable, kindly consider boosting and following for more updates.
⚠️ Disclaimer: This content is intended for educational purposes only and does not constitute financial advice.

Massive Oil Move Incoming? Only One Thing Can Stop ItOIL – Overview
Oil Rallies to 5-Month High as Israel-Iran Tensions Escalate
Oil prices surged to a five-month high early Wednesday amid escalating conflict between Israel and Iran. The ongoing airstrikes between the two nations, along with reports that the Trump administration is considering military involvement, have intensified concerns over a broader regional war.
Since Israel launched a surprise strike on Iran last week targeting nuclear sites, oil has risen nearly 10%, fueled by fears of potential supply disruptions. President Trump has publicly called for Iran's "unconditional surrender," signaling heightened geopolitical risk.
Despite the ongoing conflict, Iran's oil exports remain largely unaffected, and the country has not yet disrupted shipping through the Persian Gulf — a critical route supplying around 20% of global oil demand. However, markets remain on edge over the potential for further escalation that could directly impact supply.
Technical Outlook:
Oil maintains bullish momentum as long as it trades above 72.21, with upside targets at:
➡️ 77.21
➡️ 79.50 — key breakout level
➡️ 85.40 — next resistance zone
➡️ Potential extension to 88.40 if momentum continues
🔻 A shift to bearish sentiment is only likely if negotiations begin between Iran and Israel, signaling potential de-escalation.
Key Levels:
• Pivot: 73.20
• Resistance: 77.21 / 79.50 / 85.40
• Support: 69.55 / 68.33 / 66.03
Caution: Any signs of de-escalation or negotiations between Iran and Israel could quickly reverse the trend.

USOIL:Go short before you go long
The idea of crude oil is still to go long. Today, the more appropriate entry point is 72-72.3, there is still a little space at present, if you consider selling short first, then the more appropriate short point is 73-73.3 range. Give to the point to do, to wait to do more.
Trading Strategy:
SELL@73-73.3
TP: 72-72.3
BUY@72-72.3
TP: 73.7-74
↓↓↓ More detailed strategies and trading will be notified here ↗↗↗
↓↓↓ Keep updated, come to "get" ↗↗↗

USOIL - Near CUT n REVERSE Area? holds or not??#USOIL.. straight bounce after #IranvsIsrael war situation, and now market just reached near to his current Resistance Area / region
keep close that region and if market holds then drop expected otherwise not at all.
NOTE: we will go for cut n reverse above region on confirmation.
good luck
trade wisely

weekly price chart of WTI Crude Oil (CFDs on Crude Oil - WTI) 🔍 Key Observations:
1. Downtrend Line (Black Diagonal Line)
The chart has a descending trendline drawn from a previous high (around mid-2022), connecting lower highs.
This trendline represents a long-term resistance level — each time the price approached it, it was rejected.
2. Support Zone (Green Box)
A horizontal green zone marks a strong support area, roughly between $62–$67.
This area has been tested multiple times in the past (as both support and resistance), indicating it's a key level where buying interest appears.
3. Recent Price Action
The price recently dipped below the green support zone, forming a false breakdown or bear trap, then strongly rebounded back above it.
The price is now around $73.20, approaching the descending trendline (resistance).
🔧 Technical Interpretation:
Trend: Overall long-term downtrend (as seen from the descending trendline).
Current Momentum: Strong bullish bounce from the support zone.
Key Resistance: Around $74–$76, where price meets the descending trendline.
Key Support: Around $62–$67, the highlighted green zone.
🔮 What to Watch Next:
Bullish Scenario: If price breaks above the descending trendline and sustains above $76, it could signal a trend reversal or breakout.
Bearish Scenario: If price gets rejected at the trendline, it may retest the $67 zone or lower.
Volume: Not shown here, but would be important to confirm the breakout.

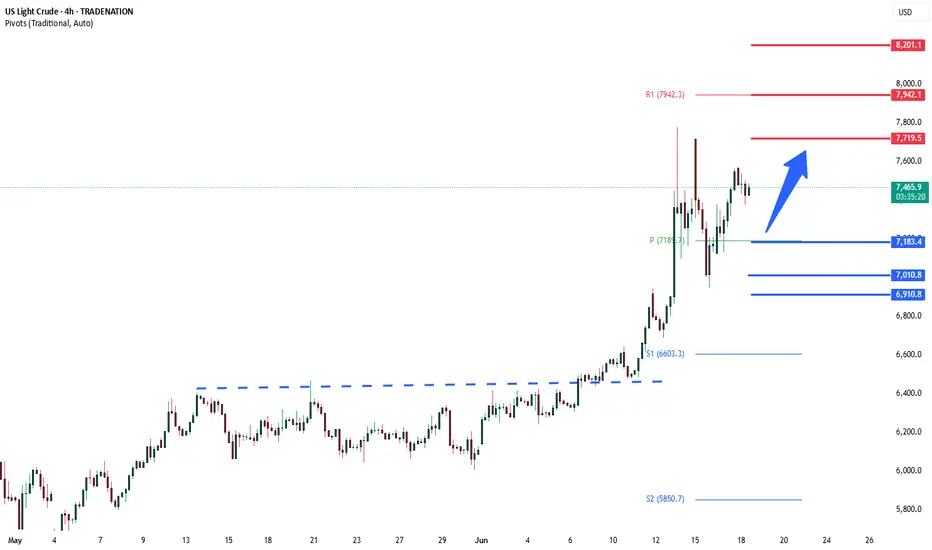
USOIL BEARS WILL DOMINATE THE MARKET|SHORT
USOIL SIGNAL
Trade Direction: short
Entry Level: 73.10
Target Level: 68.31
Stop Loss: 76.29
RISK PROFILE
Risk level: medium
Suggested risk: 1%
Timeframe: 3h
Disclosure: I am part of Trade Nation's Influencer program and receive a monthly fee for using their TradingView charts in my analysis.
✅LIKE AND COMMENT MY IDEAS✅

WTI Crude Oil bullish on geopolitical riskWTI Price: Trading around $74.60, extending gains in European trading hours.
Key Drivers Today:
Geopolitical Risk:
Tensions between Israel and Iran are rising.
Trump called for Iran’s “unconditional surrender,” increasing fears of US involvement.
Iran may shut the Strait of Hormuz — a key oil shipping route — which could disrupt supply and push prices higher.
Bullish API Inventory Data:
US crude stockpiles dropped by 10.1 million barrels last week (vs. -0.6M expected).
Signals strong demand or tighter supply, adding bullish pressure to WTI.
Trading Implication:
Geopolitical risk + surprise inventory draw = bullish bias for WTI.
Watch for momentum toward $77.20 resistance, with support near $71.80.
Eyes now on EIA data for confirmation and any new Middle East headlines for further upside.
Key Support and Resistance Levels
Resistance Level 1: 77.20
Resistance Level 2: 7940
Resistance Level 3: 82.00
Support Level 1: 71.80
Support Level 2: 70.00
Support Level 3: 69.00
This communication is for informational purposes only and should not be viewed as any form of recommendation as to a particular course of action or as investment advice. It is not intended as an offer or solicitation for the purchase or sale of any financial instrument or as an official confirmation of any transaction. Opinions, estimates and assumptions expressed herein are made as of the date of this communication and are subject to change without notice. This communication has been prepared based upon information, including market prices, data and other information, believed to be reliable; however, Trade Nation does not warrant its completeness or accuracy. All market prices and market data contained in or attached to this communication are indicative and subject to change without notice.
USOIL FUNDAMENTALS AND TECHNICALS USOIL (WTI Crude) is currently trading near the 72.00 level and is setting up for a potential breakout from a long-standing descending channel on the higher time frame (3D chart). Price has approached the upper boundary of this bearish channel after a strong bullish rally in recent sessions. This indicates growing bullish momentum, and any sustained breakout above the descending trendline could open the path toward the 98.00 zone, a major structural target based on previous price action and Fibonacci projections.
The recent bullish surge in crude oil prices has been fueled by a combination of supply-side constraints and renewed optimism around global demand. OPEC+ continues to show discipline in supply management, and geopolitical tensions in oil-producing regions are adding risk premiums. Furthermore, the Fed’s recent signals of a potential pause in tightening, combined with an improving outlook for Chinese demand recovery, are creating a supportive environment for commodities, particularly oil. These fundamental tailwinds align with the technical structure hinting at an upside breakout.
Technically, USOIL has broken back above a critical mid-channel support level and is now challenging the descending resistance line. The most recent impulsive candles suggest strong buyer conviction. If this momentum holds, we could see a retest followed by continuation toward the 98.00 psychological level. The structure also supports a higher low formation, which is another bullish signal for long-term traders watching the macro channel breakout.
From a trading standpoint, this setup is high probability with a well-defined invalidation zone below 65.00. The confluence of macro catalysts, technical breakout formation, and seasonal demand trends makes this a compelling bullish opportunity. I am closely monitoring price action for confirmation to go long on the breakout and ride the potential wave toward the upper supply region near 98.00.
U

USOIL:A long trading strategy
Oil prices also fell sharply under the stimulus of the news, and then completed the correction rebound in the sub-session, and now back to around 71 again. The current trend is in the upward rhythm of the main trend, and it is expected that the trend of crude oil will be mainly in the form of shock consolidation.
Trading ideas than yesterday did not change too much, adjust the appropriate profit point.
Trading Strategy:
BUY@70.5-70.8
TP: 71.8-72.3
↓↓↓ More detailed strategies and trading will be notified here ↗↗↗
↓↓↓ Keep updated, come to "get" ↗↗↗

usoil usoil is also in range for long we have to wait for 5 min candle should give closing above 73 so long trade we be active and for short if 5 min candle is giving closing below 72.500 the short trade will active

USOIL 1 - Hour Chart AnalysisUSOIL 1 - Hour Chart Analysis
Key Levels
Support: ~69.50 (short - term), 67.70 (critical backup).
Resistance: 73.50 (major hurdle, tested before).
Trend, Pattern & Middle East Conflict
Price oscillates between support/resistance, with a potential “V - shaped reversal”. Middle East conflicts add high uncertainty:
Escalation: Fears of supply cuts could push price above 73.50 rapidly.
De - escalation: May pressure price down, but 67.70/69.50 still get support from lingering supply - risk worries.
Trading Strategies
Bullish: If 69.50 holds (e.g., long lower shadows/bullish candles), small - size long. Target 73.50; stop - loss ~69.20. Watch for sudden conflict news.
Bearish: If 69.50 breaks (consecutive closes below), short. Target 67.70; stop - loss ~69.80. Stay alert to conflict updates.
Note: Oil prices hinge on supply - demand, Middle East tensions, and the USD. Combine tech/fundamental analysis; manage risk strictly.
⚡️⚡️⚡️ USOil ⚡️⚡️⚡️
🚀 Buy@ 70.50 - 71.00
🚀 TP 73.00 - 74.00
Accurate signals are updated every day 📈 If you encounter any problems during trading, these signals can serve as your reliable guide 🧭 Feel free to refer to them! I sincerely hope they'll be of great help to you 🌟 👇

WTI Oil H1 | Falling toward a pullback supportWTI oil (USOIL) is falling towards a pullback support and could potentially bounce off this level to climb higher.
Buy entry is at 73.31 which is a pullback support that aligns with the 38.2% Fibonacci retracement.
Stop loss is at 70.90 which is a level that lies underneath a swing-low support and the 61.8% Fibonacci retracement.
Take profit is at 77.60 which is a swing-high resistance.
High Risk Investment Warning
Trading Forex/CFDs on margin carries a high level of risk and may not be suitable for all investors. Leverage can work against you.
Stratos Markets Limited (tradu.com ):
CFDs are complex instruments and come with a high risk of losing money rapidly due to leverage. 63% of retail investor accounts lose money when trading CFDs with this provider. You should consider whether you understand how CFDs work and whether you can afford to take the high risk of losing your money.
Stratos Europe Ltd (tradu.com ):
CFDs are complex instruments and come with a high risk of losing money rapidly due to leverage. 63% of retail investor accounts lose money when trading CFDs with this provider. You should consider whether you understand how CFDs work and whether you can afford to take the high risk of losing your money.
Stratos Global LLC (tradu.com ):
Losses can exceed deposits.
Please be advised that the information presented on TradingView is provided to Tradu (‘Company’, ‘we’) by a third-party provider (‘TFA Global Pte Ltd’). Please be reminded that you are solely responsible for the trading decisions on your account. There is a very high degree of risk involved in trading. Any information and/or content is intended entirely for research, educational and informational purposes only and does not constitute investment or consultation advice or investment strategy. The information is not tailored to the investment needs of any specific person and therefore does not involve a consideration of any of the investment objectives, financial situation or needs of any viewer that may receive it. Kindly also note that past performance is not a reliable indicator of future results. Actual results may differ materially from those anticipated in forward-looking or past performance statements. We assume no liability as to the accuracy or completeness of any of the information and/or content provided herein and the Company cannot be held responsible for any omission, mistake nor for any loss or damage including without limitation to any loss of profit which may arise from reliance on any information supplied by TFA Global Pte Ltd.
The speaker(s) is neither an employee, agent nor representative of Tradu and is therefore acting independently. The opinions given are their own, constitute general market commentary, and do not constitute the opinion or advice of Tradu or any form of personal or investment advice. Tradu neither endorses nor guarantees offerings of third-party speakers, nor is Tradu responsible for the content, veracity or opinions of third-party speakers, presenters or participants.

The best opportunity is when crude oil falls
💡Message Strategy
Crude oil futures fell in the European session on Monday (June 16), giving up earlier gains, as a new round of hostilities between Israel and Iran had limited impact on oil production and exports.
WTI briefly rebounded to $77.49, close to last week's high, which was also our second profit target, but failed to break through the key resistance level near $78.09.
Oil prices surged 7% on Friday, driven by geopolitical risks, pushing crude to its highest level since January. However, Monday's reversal reflected the lack of immediate threats to supply routes, especially the strategically important Strait of Hormuz.
If Iran's production drops sharply due to the conflict, the global oil supply buffer will be quickly exhausted and oil prices may usher in a new round of surges. Faced with this complex situation, investors, oil-producing countries and consumers need to be prepared to meet the possible energy storm.
This is also the reason why we repeatedly emphasize that crude oil should be long when it falls. We can foresee its upward momentum, and the pullback is only in a moment without any signs.
📊Technical aspects
The short-term (1H) trend of crude oil continued to fluctuate upward, and the price near 74 was tested. The moving average system relies on the bullish arrangement of oil prices, and the short-term objective trend direction remains upward.
In the morning, the oil price hit a new high near 75.30, and then fell back and closed with a negative real candlestick. The short-term momentum is still bullish, and it is expected that the trend of crude oil will continue to maintain a high-level oscillating upward rhythm.
💰 Strategy Package
Long Position:69.50-70.50
The first target is around 73.00
The second target is around 75.00

WTI crude oil Wave Analysis – 17 June 2025
- WTI crude oil reversed from round support level 70.00
- Likely to rise to resistance level 78.00
WTI crude oil recently reversed from the round support level 70.00 coinciding with the upper trendline of the recently broken up channel from May.
The downward reversal from the support level 70.00 formed the weekly Japanese candlesticks reversal pattern Bullish Engulfing – which increases the probability WTI will continue to rise in the active impulse wave C.
Given the strength of the active impulse wave C, WTI crude oil can be expected to rise to the next resistance level 78.00 (target for the completion of wave (4), which reversed the price in January).

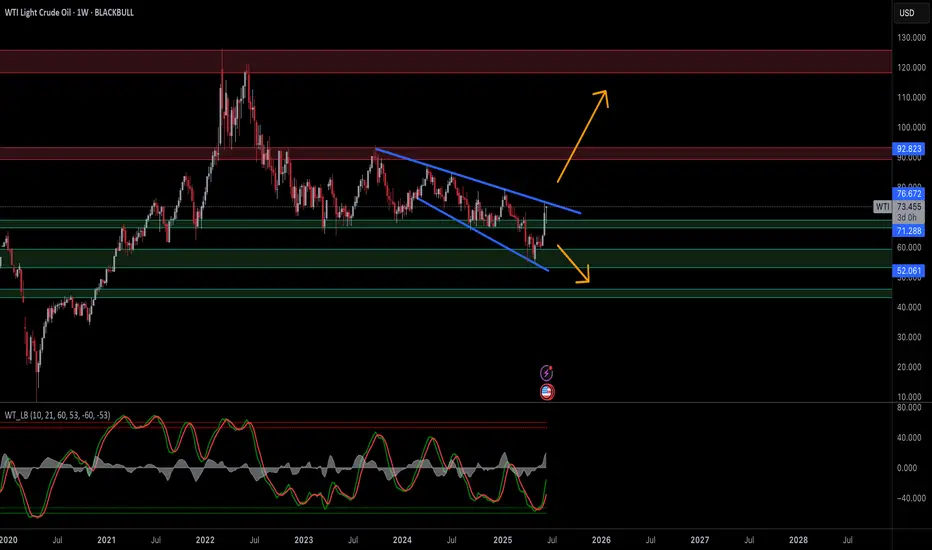
Oil Eyes $90+ as U.S.–Iran Conflict LoomsWTI Crude Oil — Bullish Reversal in Play as War Risk Escalates
Technical & Geopolitical Outlook — Weekly Chart | 17 June 2025
🧭 Current Market Condition:
WTI crude oil is breaking out of a multi-month falling wedge, a classically bullish reversal pattern, after bouncing from the $67–68 support region. This technical move is further amplified by rising geopolitical tensions in the Middle East, particularly fears of a potential U.S. military strike on Iran, which would threaten global oil supply routes through the Strait of Hormuz.
The current breakout attempt aligns with a sentiment shift from oversold to recovery mode, supported by a sharp rise in weekly momentum indicators.
📊 Key Technical Highlights:
Bullish Falling Wedge Breakout: Price breaking above descending resistance.
Key Resistance Levels:
$76.67 – immediate supply zone
$92.82 – prior breakout area; major target if breakout sustains
Key Support Levels:
$71.28 – breakout retest level
$67.00–$68.00 – wedge base, strong historical support
$52.00 – longer-term bearish invalidation (unlikely unless demand collapses)
Momentum: Weekly stochastic sharply rising from bottom, signaling strength building.
🔺 Bullish Scenario — If U.S. Attacks Iran:
If the U.S. carries out military strikes on Iranian targets, oil prices are highly likely to:
Price in geopolitical risk premium of $10–$20/barrel.
Spike toward $90–$100 range within days or weeks due to:
Fears of supply disruption (Hormuz choke point)
Panic buying and short covering
Strategic reserves hoarding
Technical Targets:
$76.67 → Break above confirms bullish continuation
$92.82 → First major upside target
$100–$110 → Stretch target if conflict escalates or prolongs
🛢️ Energy traders and institutions typically front-run geopolitical escalations, so price can jump before any physical conflict if tensions remain unresolved or rhetoric intensifies.
🔻 Bearish Scenario — Fake Breakout or De-escalation:
Rejection from $76.67 or failure to hold above $71.28 can trigger pullbacks.
If tensions cool and Iran conflict is diplomatically diffused:
WTI may slide back toward $68.00 and re-enter the wedge.
Below $67.00, oil could revisit $60–$52 range in a risk-off macro environment.
🛡️ Risk Management & Outlook:
Geopolitical events can override technicals, especially in commodities.
Gaps, whipsaws, and sharp reversals are common — caution with overnight positions.
Consider hedging strategies or limited-risk option plays if trading leveraged oil instruments.
📢 If you found this analysis valuable, kindly consider boosting and following for more updates.
⚠️ Disclaimer: This content is intended for educational purposes only and does not constitute financial advice.
OIL🛢️ Oil is caught in an unbalanced price zone due to rising global tensions.
Prices have spiked and with that, inflation risks are back on the table.
Now here's the play I see forming:
📌 The Fed might choose not to cut interest rates as a way to cool inflation without printing more money.
📌 This also puts pressure on China to act since rising oil prices hurt their economy too, they may push Iran to scale back aggression in order to stabilize global markets.
Everything is connected. This isn’t just about oil it’s about global strategy, inflation control, and power dynamics.

WTI above $75 on fears of US involvement in Israel-Iran conflictThe Israel-Iran situation is quite different this time and with Trump announcing that *we* now have full control over Iranian skies, suggesting the US is entering the fray – hardly a surprise to be honest - this is not going to end well. The conflict may get far worse in the short-term, and this will send shockwaves through the oil markets – especially if there are disruptions in the Strait of Hurmuz. Oil prices could easily spike to $100 and higher in the worst-case scenario. So, the situation is quite serious, unfortunately. Let's hope that it quickly de-escalates and lives are not lost.
But make no mistake, this could get really big - especially with headlines like these coming out in the last few minutes:
*US OFFICIALS SAY TRUMP 'SERIOUSLY CONSIDERING' STRIKE ON IRAN: AXIOS;
*TRUMP TO MAKE POLICY DECISION ON ISRAEL-IRAN: AXIOS
*IRAN WILL SOON LAUNCH 'PUNITIVE' OPERATION AGAINST ISRAEL: IRNA
The picture is looking quite grim, unfortunately.
by Fawad Razaqzada, market analyst with FOREX.com
