WTI Oil H1 | Falling toward an overlap supportWTI oil (USOIL) is falling towards an overlap support and could potentially bounce off this level to climb higher.
Buy entry is at 61.31 which is an overlap support that aligns with the 38.2% Fibonacci retracement.
Stop loss is at 59.95 which is a level that lies underneath a multi-swing-low support.
Take profit is at 62.54 which is a pullback resistance that aligns with the 61.8% Fibonacci retracement.
High Risk Investment Warning
Trading Forex/CFDs on margin carries a high level of risk and may not be suitable for all investors. Leverage can work against you.
Stratos Markets Limited (tradu.com ):
CFDs are complex instruments and come with a high risk of losing money rapidly due to leverage. 63% of retail investor accounts lose money when trading CFDs with this provider. You should consider whether you understand how CFDs work and whether you can afford to take the high risk of losing your money.
Stratos Europe Ltd (tradu.com ):
CFDs are complex instruments and come with a high risk of losing money rapidly due to leverage. 63% of retail investor accounts lose money when trading CFDs with this provider. You should consider whether you understand how CFDs work and whether you can afford to take the high risk of losing your money.
Stratos Global LLC (tradu.com ):
Losses can exceed deposits.
Please be advised that the information presented on TradingView is provided to Tradu (‘Company’, ‘we’) by a third-party provider (‘TFA Global Pte Ltd’). Please be reminded that you are solely responsible for the trading decisions on your account. There is a very high degree of risk involved in trading. Any information and/or content is intended entirely for research, educational and informational purposes only and does not constitute investment or consultation advice or investment strategy. The information is not tailored to the investment needs of any specific person and therefore does not involve a consideration of any of the investment objectives, financial situation or needs of any viewer that may receive it. Kindly also note that past performance is not a reliable indicator of future results. Actual results may differ materially from those anticipated in forward-looking or past performance statements. We assume no liability as to the accuracy or completeness of any of the information and/or content provided herein and the Company cannot be held responsible for any omission, mistake nor for any loss or damage including without limitation to any loss of profit which may arise from reliance on any information supplied by TFA Global Pte Ltd.
The speaker(s) is neither an employee, agent nor representative of Tradu and is therefore acting independently. The opinions given are their own, constitute general market commentary, and do not constitute the opinion or advice of Tradu or any form of personal or investment advice. Tradu neither endorses nor guarantees offerings of third-party speakers, nor is Tradu responsible for the content, veracity or opinions of third-party speakers, presenters or participants.
XTIUSD trade ideas

USOIL Today's Trading Strategy:
Recently, oil prices have generally shown a narrow oscillating trend. In terms of influencing factors, on the one hand, uncertainties in global economic growth have made the outlook for oil demand unclear, putting some downward pressure on oil prices. For example, the slowdown in economic growth in some countries and insufficient factory capacity have reduced demand for crude oil. On the other hand, the production policies of the Organization of Petroleum Exporting Countries (OPEC) and its allies are also influencing oil prices. If they plan to increase production, the supply of crude oil in the market will rise, and prices may fall.
USOIL Today's Trading Strategy:
USOIL SELL@62.0~62.5
SL:63
TP:61~60

Bearish reversal?WTI Oil (WTI/USD) is rising towards the pivot and could reverse to the 1st support, which is a pullback support.
Pivot: 65.18
1st Support: 55.69
1st Resistance: 71.43
Risk Warning:
Trading Forex and CFDs carries a high level of risk to your capital and you should only trade with money you can afford to lose. Trading Forex and CFDs may not be suitable for all investors, so please ensure that you fully understand the risks involved and seek independent advice if necessary.
Disclaimer:
The above opinions given constitute general market commentary, and do not constitute the opinion or advice of IC Markets or any form of personal or investment advice.
Any opinions, news, research, analyses, prices, other information, or links to third-party sites contained on this website are provided on an "as-is" basis, are intended only to be informative, is not an advice nor a recommendation, nor research, or a record of our trading prices, or an offer of, or solicitation for a transaction in any financial instrument and thus should not be treated as such. The information provided does not involve any specific investment objectives, financial situation and needs of any specific person who may receive it. Please be aware, that past performance is not a reliable indicator of future performance and/or results. Past Performance or Forward-looking scenarios based upon the reasonable beliefs of the third-party provider are not a guarantee of future performance. Actual results may differ materially from those anticipated in forward-looking or past performance statements. IC Markets makes no representation or warranty and assumes no liability as to the accuracy or completeness of the information provided, nor any loss arising from any investment based on a recommendation, forecast or any information supplied by any third-party.

US-Oil will further push upside After Testing TrendlineHello Traders
In This Chart XTIUSD HOURLY Forex Forecast By FOREX PLANET
today XTIUSD analysis 👆
🟢This Chart includes_ (XTIUSD market update)
🟢What is The Next Opportunity on XTIUSD Market
🟢how to Enter to the Valid Entry With Assurance Profit
This CHART is For Trader's that Want to Improve Their Technical Analysis Skills and Their Trading By Understanding How To Analyze The Market Using Multiple Timeframes and Understanding The Bigger Picture on the Charts
Forecast of the market trend at the opening on Monday”Oil prices remained under pressure this week, experiencing a notable decline due to multiple factors. As of Friday's Asian morning session, Brent crude futures fell 37 cents to $64.07 per barrel, while U.S. WTI crude futures dropped 39 cents to $60.81 per barrel. Brent crude fell 2% for the week, while WTI declined 2.7%.
Key Drivers of Oil Price Weakness
Stronger U.S. Dollar
The U.S. House of Representatives passed President Donald Trump’s tax-cut and fiscal spending bill, boosting the U.S. dollar index against a basket of currencies.
As oil is dollar-denominated, a stronger dollar typically reduces purchasing power for non-USD buyers, suppressing oil prices.
Supply-Demand Sensitivity and Market Sentiment
The combination of dollar strength and expectations of OPEC+ production increases has intensified bearish sentiment in the oil market.
While demand is gradually recovering, significant upward pressure on supply—including potential output hikes from OPEC+ and rising U.S. shale production—has created near-term volatility.
Technical Outlook and Trading Strategy
Short-Term Trend: Oil prices are likely to remain in a sideways-to-downward oscillation due to supply-demand imbalances.
Key Levels:
Resistance: $63.0–$63.5 per barrel (short-term overhead resistance).
Support: $60.5–$60.0 per barrel (critical near-term support zone).
Trading Approach:
Consider rebound shorting as the primary strategy, with retracement buying as a secondary approach.
Use rallies toward $63.0–$63.5 to initiate short positions, targeting support at $60.5–$60.0, with stop-losses above $64.0.
Note: Monitor OPEC+ policy updates and U.S. inventory data for potential shifts in market sentiment. Volatility may rise ahead of key economic indicators.

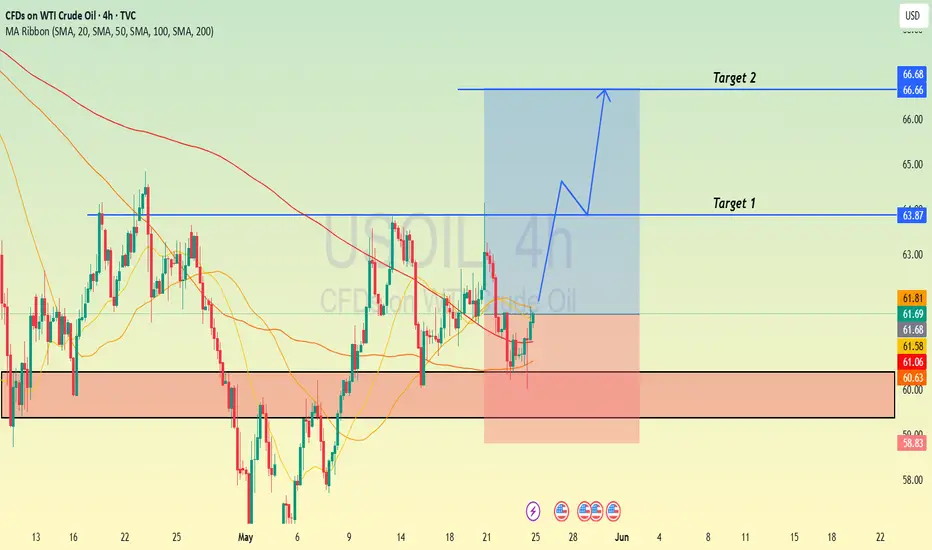
WTI - Bullish Momentum Targets $65US Light Crude has demonstrated remarkable resilience after experiencing a significant correction from March highs around $72 down to the $55 support zone in late April. The commodity has since staged an impressive recovery, climbing steadily from those April lows to current levels near $62, effectively reclaiming more than half of the previous decline. This recovery pattern suggests strong underlying demand and buying interest at lower levels, with crude oil successfully breaking above key resistance areas during its ascent. The current price action shows the market consolidating near recent highs while maintaining an upward bias, with the technical structure indicating further upside potential toward the resistance zone highlighted around $65. Given the strong bounce from support, sustained momentum, and the overall recovery trajectory, the higher probability scenario favors a continuation of the bullish move targeting the upper resistance band.
Disclosure: I am part of Trade Nation's Influencer program and receive a monthly fee for using their TradingView charts in my analysis.

USOIL: Market of Sellers
Our strategy, polished by years of trial and error has helped us identify what seems to be a great trading opportunity and we are here to share it with you as the time is ripe for us to sell USOIL.
Disclosure: I am part of Trade Nation's Influencer program and receive a monthly fee for using their TradingView charts in my analysis.
❤️ Please, support our work with like & comment! ❤️

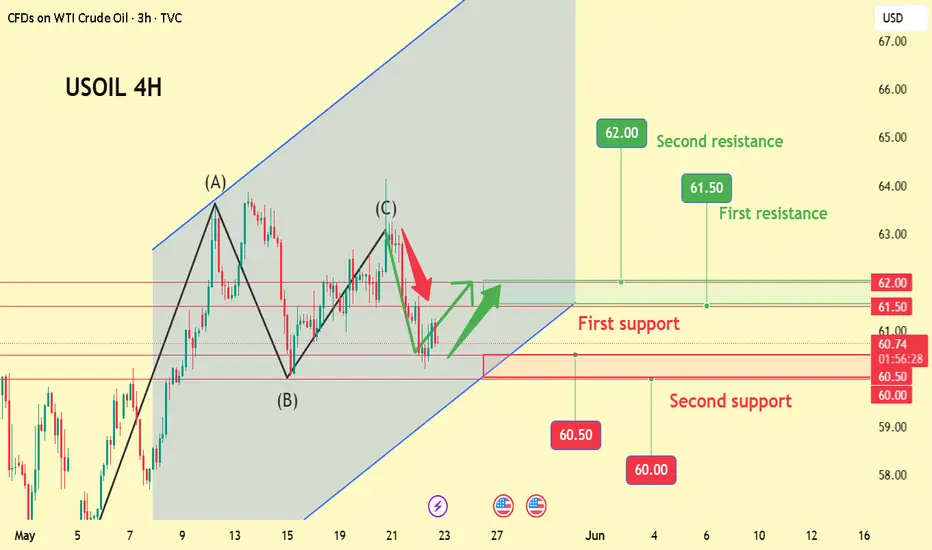
The outlook for the crude oil market next weekOutlook for Next Week's Crude Oil Market
Next week, the crude oil market will (most likely) remain in a range-bound pattern. If OPEC+ lacks clear and forceful measures regarding the implementation of production cuts and future supply plans, concerns about supply surpluses will continue to exert downward pressure on oil prices. Additionally, if global economic data does not improve significantly, the demand side will struggle to provide sufficient support for prices.
However, tensions in the Middle East persist, with relations between Israel and Iran remaining highly strained. If conflicts escalate—for example, if Iranian nuclear facilities are attacked—global crude oil daily production capacity could be reduced by at least 1 million barrels. This risk of supply disruptions would instantly drive up oil prices.
As a result, investors next week need to closely monitor OPEC+ dynamics, Middle East geopolitical developments, and global economic data to seize investment opportunities in the crude oil market.
The outlook for the crude oil market next week, I hope it will be helpful to you
USOIL BUY@61.0~61.5
SL:60
TP:62.5~63

The outlook for the crude oil market next week, I hope it will Outlook for Next Week's Oil Price: Entering a Volatile Stalemate
Next week's crude oil market is likely to enter a consolidation phase, driven by two conflicting forces:
. Geopolitical Uncertainties: A Double-Edged Sword
- U.S.-Iran Negotiations: The fifth round of U.S.-Iran talks is planned, but significant disagreements remain over nuclear sanctions and regional influence. A breakdown in negotiations could reignite tensions in the Strait of Hormuz (through which 20% of global oil flows), potentially disrupting 1.5–2 million bpd of Iranian supply and triggering short-term price surges.
- Russia-Ukraine Ceasefire Prospects: Unclear progress in peace talks leaves risks of renewed disruptions to Black Sea exports (critical for Russian crude and Ukrainian grain shipments), adding volatility to an already tense market.
- The outlook for the crude oil market next week, I hope it will be helpful to you
USOIL BUY@61.0~61.5
SL:60
TP:62.5~63

USOIL: Bulls Are Winning! Long!
My dear friends,
Today we will analyse USOIL together☺️
The market is at an inflection zone and price has now reached an area around 61.687 where previous reversals or breakouts have occurred.And a price reaction that we are seeing on multiple timeframes here could signal the next move up so we can enter on confirmation, and target the next key level of 62.377.Stop-loss is recommended beyond the inflection zone.
❤️Sending you lots of Love and Hugs❤️

The outlook for the crude oil market next weekThis year, the crude oil market has been facing a tough time, with demand remaining sluggish. The growth in crude oil consumption has been slow, and inventories have been continuously building up. Institutions such as JPMorgan Chase have pointed out that the growth in global crude oil demand is much worse than expected. Moreover, OPEC+ is set to raise the crude oil supply ceiling from June, and has been increasing production in the previous few months, which has led to a further increase in the amount of crude oil in the market. Coupled with the recovery in shale oil production in non - OPEC+ countries such as the United States, and the expansion of production capacity in Norway, Brazil, and other countries, the supply side has exerted great pressure on oil prices. From the demand side, the slowdown in global economic growth has made people more cautious about industrial production and energy consumption. In addition, the energy structure is undergoing a transformation, with the share of oil in energy demand falling below 30% for the first time. The increasing number of electric vehicles and the growing use of renewable energy in the industrial sector have also contributed to the weak growth in crude oil demand.
The outlook for the crude oil market next week, I hope it will be helpful to you
USOIL SELL@62.0~62.5
SL:63.5
TP:61~60

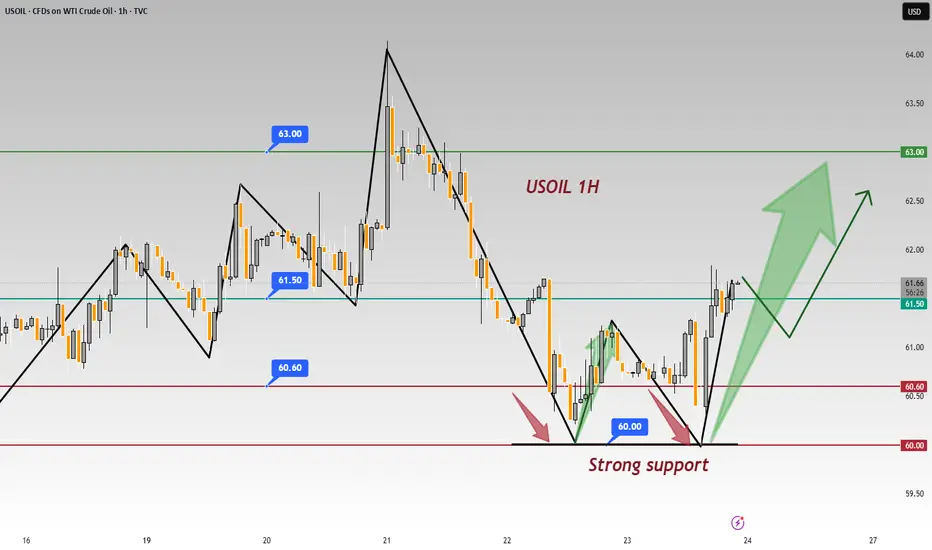
In - depth: USOIL 1 - hr Chart - Significance of 60.00 Support In the USOIL 1 - hour chart, 60.00 acts as a strong support 💪.
Support Validation
The price twice failed to break 60.00 and rebounded 📈. Psychologically, investors see 60.00 as a key level 🔑. Approaching it, buy orders pour in as they think crude oil is undervalued 📉. Technically, it's on a support line from prior lows, and repeated tests have fortified its support 🛡️.
⚡️⚡️⚡️ USOil ⚡️⚡️⚡️
🚀 Buy@ 60.00 - 60.60
🚀 TP 62.50 - 62.80
Accurate signals are updated every day 📈 If you encounter any problems during trading, these signals can serve as your reliable guide 🧭 Feel free to refer to them! I sincerely hope they'll be of great help to you 🌟 👇
USOIL Under Pressure! SELL!
My dear friends,
Please, find my technical outlook for USOIL below:
The price is coiling around a solid key level - 61.69
Bias - Bearish
Technical Indicators: Pivot Points Low anticipates a potential price reversal.
Super trend shows a clear sell, giving a perfect indicators' convergence.
Goal - 61.18
About Used Indicators:
The pivot point itself is simply the average of the high, low and closing prices from the previous trading day.
Disclosure: I am part of Trade Nation's Influencer program and receive a monthly fee for using their TradingView charts in my analysis.
———————————
WISH YOU ALL LUCK

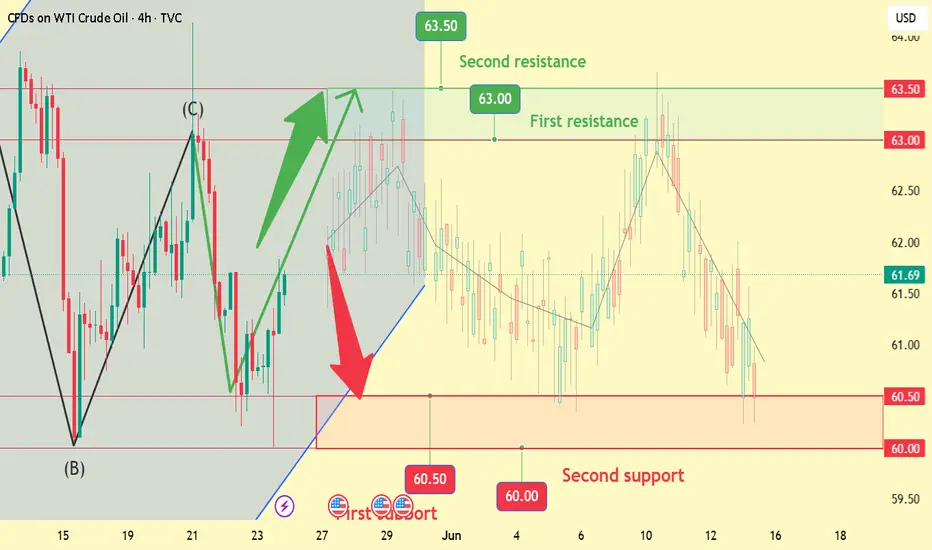
Next Week’s Outlook, I hope it will be helpful to youRecent Oil Price Trends and Outlook
The recent trend of oil prices has been volatile. On the supply side, the Organization of the Petroleum Exporting Countries and its allies (OPEC+) are discussing further production increases in July. If actual production is increased, the supply of crude oil in the market will rise, naturally putting downward pressure on prices. There has already been news that OPEC+ began gradually increasing supplies in May and June. If subsequent production increase plans continue to advance, concerns about supply surpluses will intensify.
Forecast for Next Week’s Market
Expectations of OPEC+ production increases and weak U.S. demand are likely to continue influencing the market next week. If OPEC+ confirms further production increases at its June 1 meeting, oil prices will (most likely) continue to face downward pressure next week. However, if unexpected situations arise—such as sudden geopolitical tensions affecting crude oil production and transportation—oil prices may also rise volatility. Based on current conditions, it is more likely that oil prices will maintain a (range-bound downward) pattern next week. Key resistance levels to watch are 63.0–63.5, and support levels are 60.5–60.0
USOIL Will Go Higher From Support! Buy!
Please, check our technical outlook for USOIL.
Time Frame: 9h
Current Trend: Bullish
Sentiment: Oversold (based on 7-period RSI)
Forecast: Bullish
The price is testing a key support 61.684.
Current market trend & oversold RSI makes me think that buyers will push the price. I will anticipate a bullish movement at least to 64.409 level.
P.S
Please, note that an oversold/overbought condition can last for a long time, and therefore being oversold/overbought doesn't mean a price rally will come soon, or at all.
Disclosure: I am part of Trade Nation's Influencer program and receive a monthly fee for using their TradingView charts in my analysis.
Like and subscribe and comment my ideas if you enjoy them!


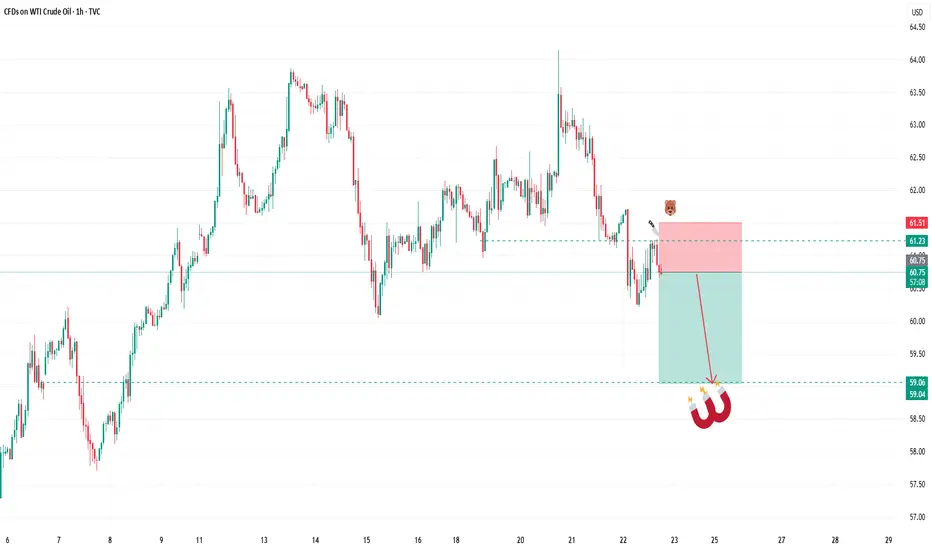
SELL USOILAs we had analysed the US DOLLAR which we expect big drop, in todays session we are monitoring USOIL for selling opportunities . Our entry is at 60.75 and stops above 61.50. Targets are 59.00 and below. Use proper risk management.
USOIL Today's Trading Strategy:Recent oil prices have been extremely volatile. On the supply side, OPEC+ has continued to increase production since June, with output hikes sustained over the past few months. This has led to a surplus in crude oil supply, exerting downward pressure on prices. Additionally, U.S. shale oil production capacity may gradually be released as prices rebound. However, production costs in U.S. shale oil regions, such as Midland, act as a floor for prices: new wells require oil prices to stay above $60 per barrel to be profitable, providing some support for prices.
On the demand side, global economic growth has been sluggish. In particular, U.S. tariff hikes have impacted global commodity flows and suppressed oil demand growth in developing countries. However, a easing of U.S.-China trade tensions could potentially bolster oil demand. Moreover, heightened tensions in the Middle East, if conflicts escalate and disrupt oil production and transportation, could cause oil prices to surge in the
USOIL Today's Trading Strategy:
USOIL BUY@60~60.5
SL:60
TP:61.5~62
WTI Oil H4 | Pullback support at 50% Fibonacci retracementWTI oil (USOIL) is falling towards a pullback support and could potentially bounce off this level to climb higher.
Buy entry is at 59.71 which is a pullback support that aligns with the 50.0% Fibonacci retracement.
Stop loss is at 57.50 which is a level that lies underneath a swing-low support.
Take profit is at 63.72 which is a multi-swing-high resistance.
High Risk Investment Warning
Trading Forex/CFDs on margin carries a high level of risk and may not be suitable for all investors. Leverage can work against you.
Stratos Markets Limited (tradu.com ):
CFDs are complex instruments and come with a high risk of losing money rapidly due to leverage. 63% of retail investor accounts lose money when trading CFDs with this provider. You should consider whether you understand how CFDs work and whether you can afford to take the high risk of losing your money.
Stratos Europe Ltd (tradu.com ):
CFDs are complex instruments and come with a high risk of losing money rapidly due to leverage. 63% of retail investor accounts lose money when trading CFDs with this provider. You should consider whether you understand how CFDs work and whether you can afford to take the high risk of losing your money.
Stratos Global LLC (tradu.com ):
Losses can exceed deposits.
Please be advised that the information presented on TradingView is provided to Tradu (‘Company’, ‘we’) by a third-party provider (‘TFA Global Pte Ltd’). Please be reminded that you are solely responsible for the trading decisions on your account. There is a very high degree of risk involved in trading. Any information and/or content is intended entirely for research, educational and informational purposes only and does not constitute investment or consultation advice or investment strategy. The information is not tailored to the investment needs of any specific person and therefore does not involve a consideration of any of the investment objectives, financial situation or needs of any viewer that may receive it. Kindly also note that past performance is not a reliable indicator of future results. Actual results may differ materially from those anticipated in forward-looking or past performance statements. We assume no liability as to the accuracy or completeness of any of the information and/or content provided herein and the Company cannot be held responsible for any omission, mistake nor for any loss or damage including without limitation to any loss of profit which may arise from reliance on any information supplied by TFA Global Pte Ltd.
The speaker(s) is neither an employee, agent nor representative of Tradu and is therefore acting independently. The opinions given are their own, constitute general market commentary, and do not constitute the opinion or advice of Tradu or any form of personal or investment advice. Tradu neither endorses nor guarantees offerings of third-party speakers, nor is Tradu responsible for the content, veracity or opinions of third-party speakers, presenters or participants.

USOIL A Fall Expected! SELL!
My dear followers,
This is my opinion on the USOIL next move:
The asset is approaching an important pivot point 61.87
Bias - Bearish
Technical Indicators: Supper Trend generates a clear short signal while Pivot Point HL is currently determining the overall Bearish trend of the market.
Goal - 61.38
About Used Indicators:
For more efficient signals, super-trend is used in combination with other indicators like Pivot Points.
Disclosure: I am part of Trade Nation's Influencer program and receive a monthly fee for using their TradingView charts in my analysis.
———————————
WISH YOU ALL LUCK

USOIL | ShortA visible bearish divergence can be observed with the double top pattern which indicates the further continuation of bearish trend.

Bullish bounce?USO/USD is falling towards the support level which is an overlap support that lines up with the 50% Fibonacci retracement and could bounce from this level to our take profit.
Entry: 60.39
Why we like it:
There is an overlap support level that lines up with the 50% Fibonacci retracement.
Stop loss: 57.93
Why we like it:
There is a pullback support level that aligns with the 161.8% Fibonacci extension.
Take profit: 64.42
Why we like it:
There is a pullback resistance level.
Enjoying your TradingView experience? Review us!
Please be advised that the information presented on TradingView is provided to Vantage (‘Vantage Global Limited’, ‘we’) by a third-party provider (‘Everest Fortune Group’). Please be reminded that you are solely responsible for the trading decisions on your account. There is a very high degree of risk involved in trading. Any information and/or content is intended entirely for research, educational and informational purposes only and does not constitute investment or consultation advice or investment strategy. The information is not tailored to the investment needs of any specific person and therefore does not involve a consideration of any of the investment objectives, financial situation or needs of any viewer that may receive it. Kindly also note that past performance is not a reliable indicator of future results. Actual results may differ materially from those anticipated in forward-looking or past performance statements. We assume no liability as to the accuracy or completeness of any of the information and/or content provided herein and the Company cannot be held responsible for any omission, mistake nor for any loss or damage including without limitation to any loss of profit which may arise from reliance on any information supplied by Everest Fortune Group.

Latest Strategic Positioning for Crude OilDuring the US trading session, crude oil prices declined for the second consecutive trading day after rebounding from intraday lows and encountering resistance. The commodity traded at $60.42 per barrel, representing a 1.87% daily loss.
Per the Commitments of Traders (COT) report released last Friday, there exists a moderate divergence in sentiment between managed funds and asset management firms regarding WTI crude oil futures. While both investor categories maintain net long positions, over the prior two weeks, managed funds reduced their net long exposure by approximately 20,000 contracts, whereas large speculators increased their net long positions by 10,000 contracts.
Technically, crude oil exhibited a "rally-and-reversal" pattern today, retreating under selling pressure near the $61.7 resistance zone before stabilizing and rebounding around $60.0. Current price action indicates a range-bound oscillation, with bullish stabilization probabilities contingent on the $60.0 support level holding firm.
In summary, crude oil remains trapped in a narrow consolidation phase, with overhead resistance levels retaining dominance. For today's trading strategy, a "rebound shorting-first" approach is recommended, complemented by tactical long positions on dips. Key resistance lies between $61.7-$62.5, while support zones are identified at $60.0-$59.0.
In the market, there are no absolutes, and neither upward nor downward trends are set in stone. Therefore, the ability to judge the balance between market gains and losses is your key to success. Let money become our loyal servant.
