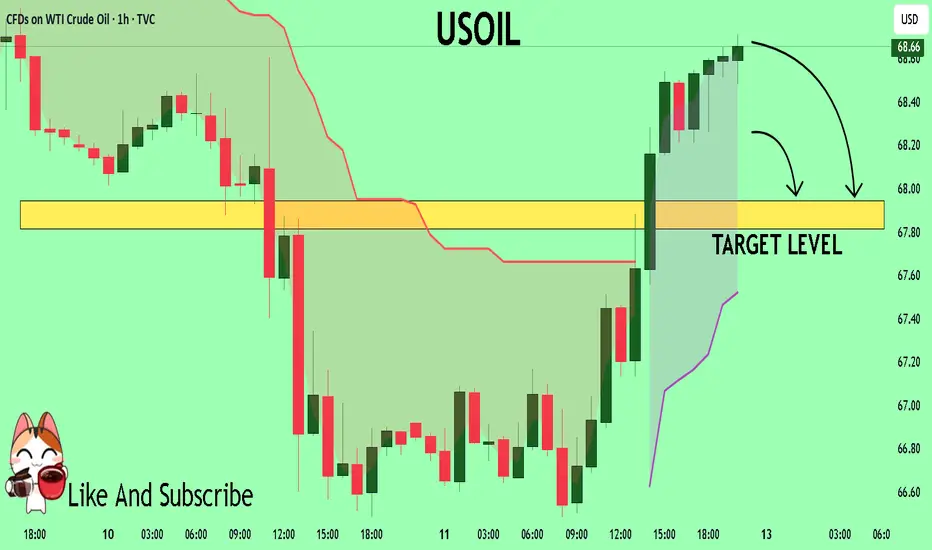
USOIL Will Collapse! SELL!
My dear subscribers,
USOIL looks like it will make a good move, and here are the details:
The market is trading on 68.66 pivot level.
Bias - Bearish
Technical Indicators: Both Super Trend & Pivot HL indicate a highly probable Bearish continuation.
Target - 67.95
About Used Indicators:
The average true range (ATR) plays an important role in 'Supertrend' as the indicator uses ATR to calculate its value. The ATR indicator signals the degree of price volatility.
Disclosure: I am part of Trade Nation's Influencer program and receive a monthly fee for using their TradingView charts in my analysis.
———————————
WISH YOU ALL LUCK
XTIUSD trade ideas
USOIL--SHORT
--unabled to move up, price will move down
--three horizantal line: starting from top, entry,TP1,TP2

USOIL-LONG--severel times attemted to break the green channel's bottom side and failed
--price seems to go higher and push the upper side of green channel
-

SELL PLAN – XTIUSD (15M)📉 SELL PLAN – XTIUSD (15M)
🗓️ Date: 23 July 2025
⏱️ Timeframe: 15-Minute
🔍 Context & Reasoning:
HTF Supply Zone (Red Zone)
Price entered the red HTF zone (noted as “4H T2,3,4”) and showed rejection.
This zone aligns with potential 4H Fair Value Gaps / Supply.
Sweep & Rejection
Liquidity sweep above previous highs followed by immediate bearish reaction.
Entry Confirmation
Bearish engulfing candle formed inside the HTF zone.
Price closed below 15M EMA (blue line) showing bearish momentum.
Dealing Range Valid
DR formed after rejection of the HTF zone.
Short-term bullish FVG created and violated.
Bearish FVG confirms continuation.
🎯 Entry Details:
Entry Price: ~66.12
Stop Loss: ~66.58 (Above HTF rejection zone)
Take Profit: ~65.12 (Near Weekly TP level)
🧠 Confluences:
Rejection from 4H Supply
Price closed below EMA
Clear swing failure / liquidity grab
DR confirmation on 15M
Multiple FVGs and breaker structure supporting the move
📌 Risk Management:
Risk-to-Reward: 1:2+
Risk per trade: Max 1%
If in drawdown: Use 0.5%

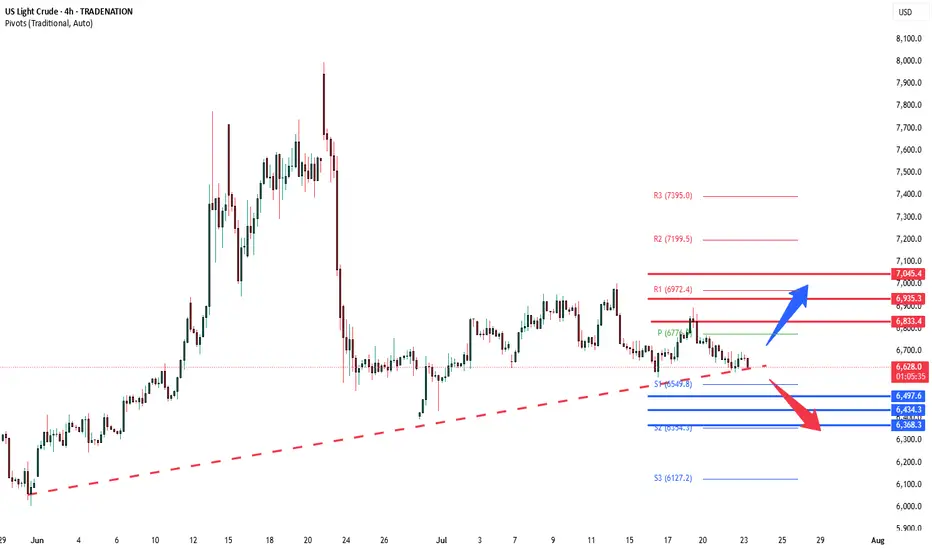
WTI crude consolidation ahead of US Inventory figuresWest Texas Intermediate (WTI) crude futures hovered near $66.30 during Wednesday’s European session, trading in a narrow range as investors awaited the latest US EIA crude inventory report. Market expectations point to a 1.4 million barrel drawdown, which would signal stronger demand and potentially support prices.
However, crude failed to rally despite confirmation of a US-Japan bilateral trade agreement, announced by President Trump via Truth Social. While the deal is seen as a positive for global trade sentiment, broader oil demand concerns persist—especially if US-EU trade negotiations stall, which could dampen growth in major consuming regions.
Conclusion:
Oil markets remain in consolidation mode, with near-term direction likely hinging on EIA inventory results. A larger-than-expected draw could offer upside momentum, but macro-level trade uncertainties continue to cap gains.
Key Support and Resistance Levels
Resistance Level 1: 6830
Resistance Level 2: 6940
Resistance Level 3: 7045
Support Level 1: 6500
Support Level 2: 6435
Support Level 3: 6370
This communication is for informational purposes only and should not be viewed as any form of recommendation as to a particular course of action or as investment advice. It is not intended as an offer or solicitation for the purchase or sale of any financial instrument or as an official confirmation of any transaction. Opinions, estimates and assumptions expressed herein are made as of the date of this communication and are subject to change without notice. This communication has been prepared based upon information, including market prices, data and other information, believed to be reliable; however, Trade Nation does not warrant its completeness or accuracy. All market prices and market data contained in or attached to this communication are indicative and subject to change without notice.
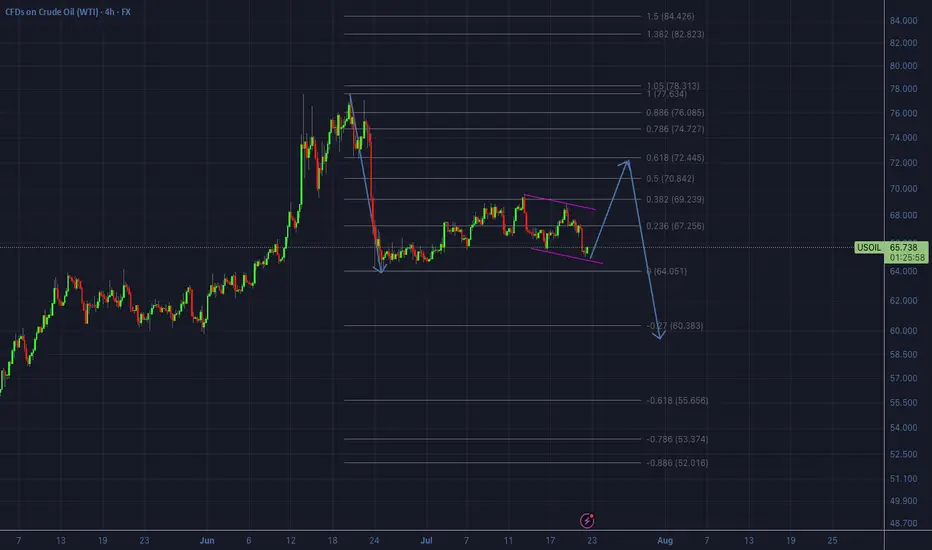
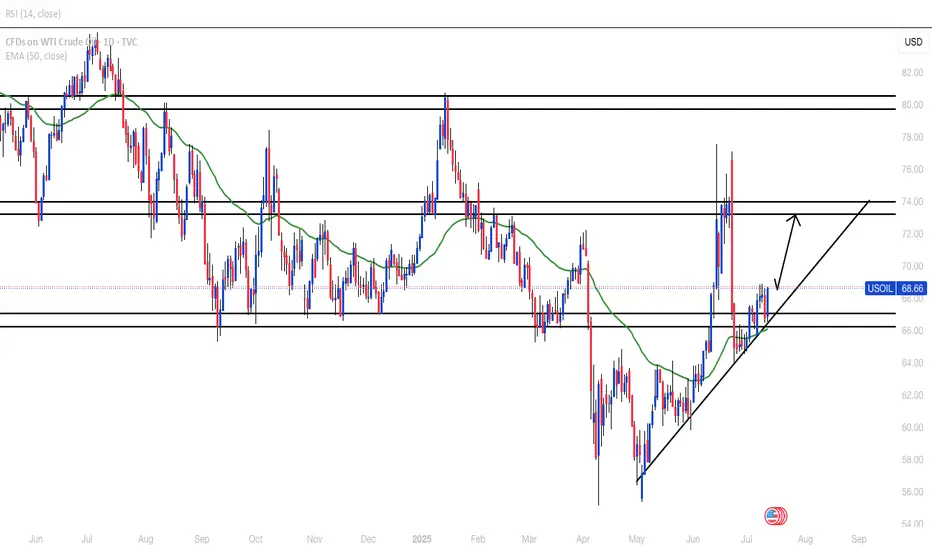
OIL - Likely development on the 4hr/daily scenarioThis looks like the likely scenario that will now develop on oil on the 4hr/daily timeframe.
In other words, we will look for an upside from now on first, back to the 0.618 re-tracement of the huge downside impulse that occurred in the last week of June.
So all buy setups we will be able to take until price hits the $72 area, then we will start looking for sells.
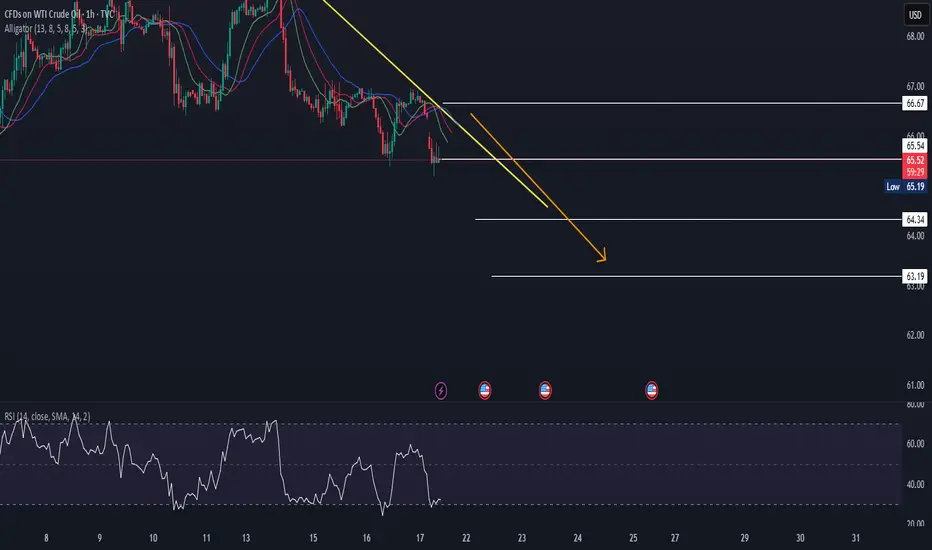
USOILUSOIL is in strongly bearish trend.
Potentially printing LH and LL.
No strong sign of reversal shown.
Alligator mouth is open which indicates trend will continue.
we sell at CMP.
Oil Bulls Watch $67.0 for Breakout ConfirmationFenzoFx—Crude Oil trades slightly above the bullish FVG at $66.5, showing sideways momentum on the 1-hour chart. The $65.5 support is backed by volume interest and could drive prices higher.
If this level holds, bulls may target a retest of the descending trendline. For confirmation, a close above the $67.0 resistance is needed.
Please note that a close below $66.5 would invalidate the bullish outlook.

WILL CRUDE HOLD BEARISH TREND DURING FED CHAIR POWELL SPEECH?!!?CRUDE OIL
Looking for a BEARISH continuation, of last week's Friday Fall.
Take Profit near 2.00 Extension level (64.715)
Stop Loss above the previous Hourly high candlestick (66.103)

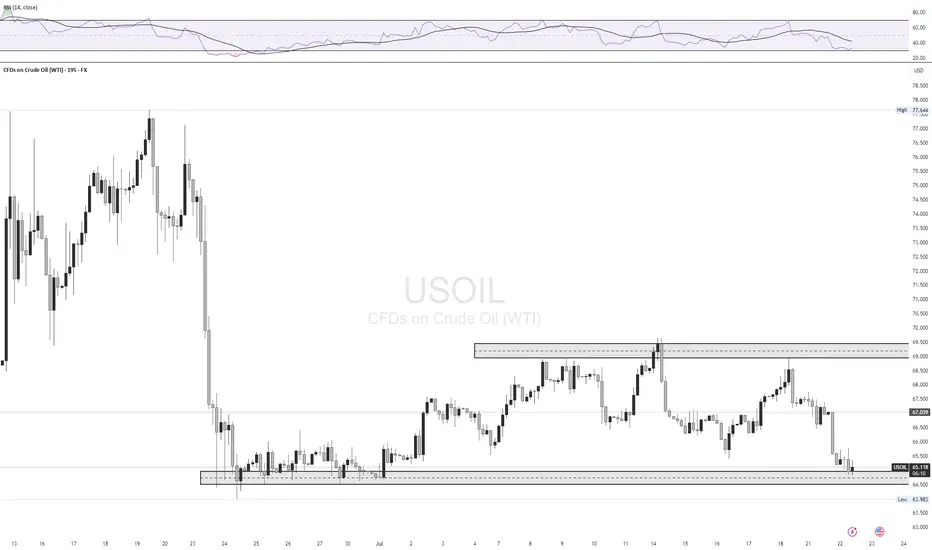
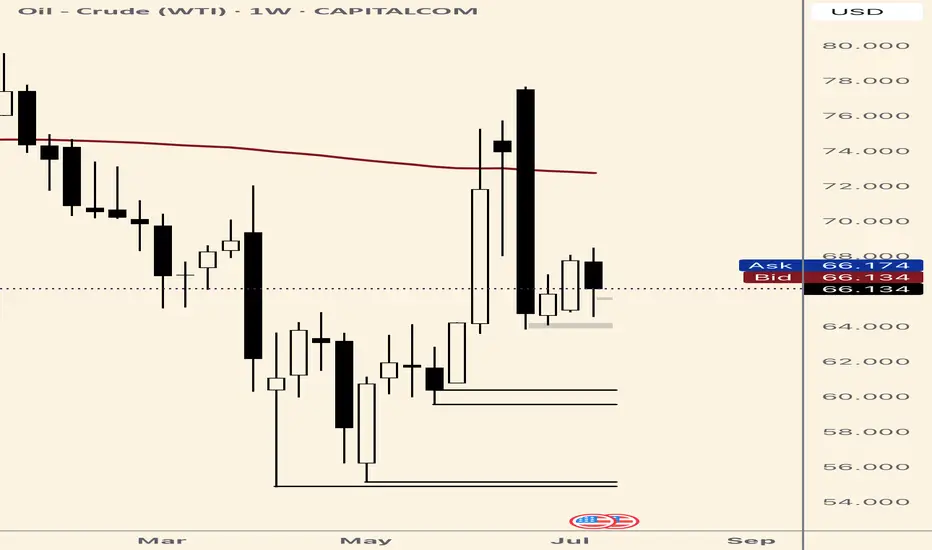
Crude Oil -DAILY- 21.07.2025Oil prices were steady after their first weekly decline this month, as attention shifted to U.S. trade negotiations and the European Union’s push to tighten restrictions on Russian energy exports. The EU is preparing new sanctions, including a lower price cap on Russian crude, limits on fuel refined from Russian oil, banking restrictions, and bans targeting an Indian refinery and Chinese firms. Despite western sanctions, Russian oil continues flowing to China and India. Meanwhile, diesel margins in Europe remain strong, signaling tight supply.
On the technical side, the price of crude oil has failed to break below the major technical support area, which consists of the 50-day simple moving average and the 50% of the weekly Fibonacci retracement level. The Stochastic oscillator has been in the neutral level since last week hinting that there is potential for the price to move to either direction in the near short term. On the other hand, the Bollinger bands have contracted rather massively showing that volatility has dried up therefore, the recent sideways movement might extend in the upcoming sessions.
Disclaimer: The opinions in this article are personal to the writer and do not reflect those of Exness

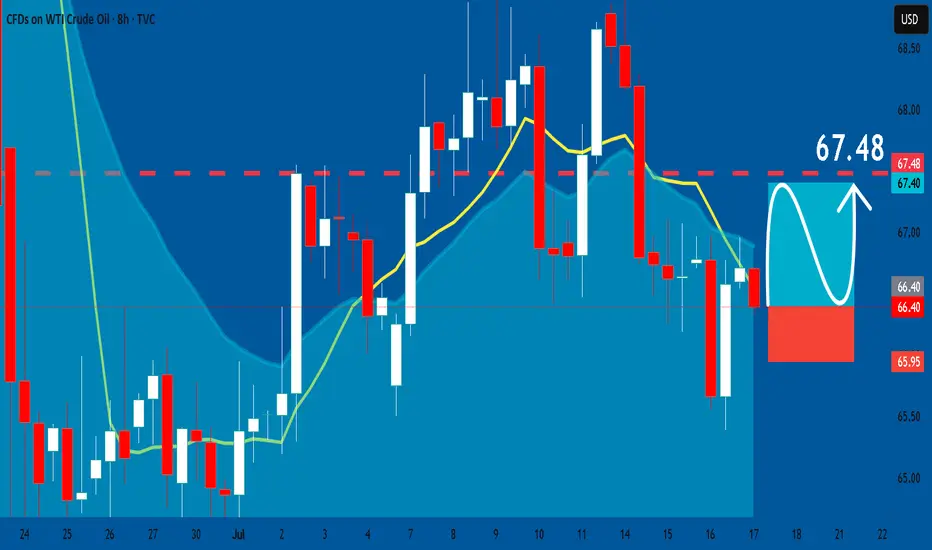
USOIL: Bullish Continuation & Long Trade
USOIL
- Classic bullish pattern
- Our team expects retracement
SUGGESTED TRADE:
Swing Trade
Buy USOIL
Entry - 66.40
Stop - 65.95
Take - 67.48
Our Risk - 1%
Start protection of your profits from lower levels
Disclosure: I am part of Trade Nation's Influencer program and receive a monthly fee for using their TradingView charts in my analysis.
❤️ Please, support our work with like & comment! ❤️
Crude fall - short termI am anticipating crude to fall these marked levels because:
1. Strong Opening Gap which usually closes after some time
2. Liquidity levels are at the same place as the Opening Gap.
3. Oil price has to fallback a bit more and consolidate a bit more to have a healthy patterns to rise until potential 90.
CRUDE OIL Bearish Flag Breakout 📉CRUDE OIL Bearish Flag Breakout!
⭕Sell!
__
#USOIL is trading in a local
Downtrend and formed a bearish
Flag pattern and now we are
Seeing a bearish breakout
So we are bearish biased
And we will be expecting
A further bearish move down
Sell!🔽
—

WTIThe final big bear bar can be a potential exhaustion of sellers. It probably gonna have a smaller second leg, then rising up.

USOILBroke below strong daily support zone for about two months but came back above and looks to have retested the zone properly. Minor H4/H1 resistance around 66.70 that needs to be broken before possibly moving higher.
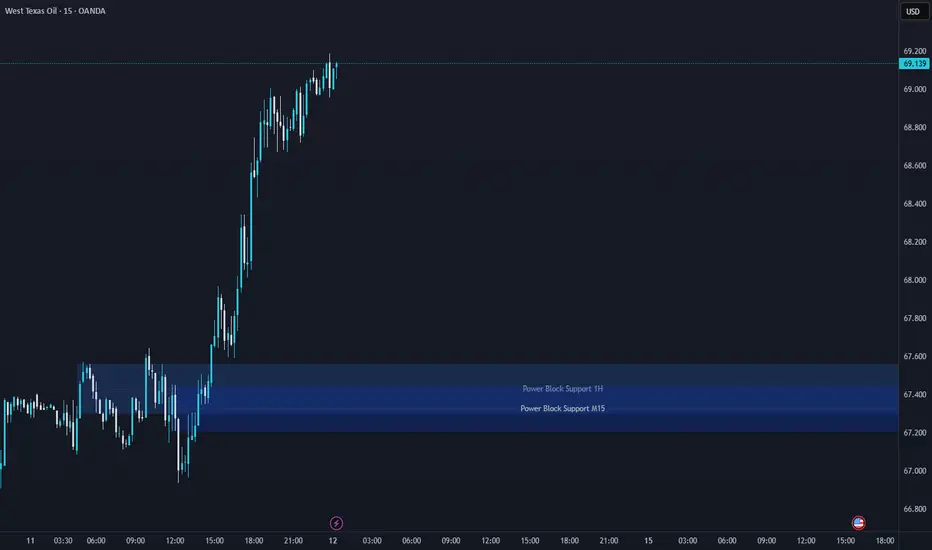
WTI Support & Resistance Levels🚀 Here are some key zones I've identified on the 15m timeframe.
These zones are based on real-time data analysis performed by a custom software I personally developed.
The tool is designed to scan the market continuously and highlight potential areas of interest based on price action behavior and volume dynamics.
Your feedback is welcome!
USOIL: Bearish Continuation & Short Trade
USOIL
- Classic bearish setup
- Our team expects bearish continuation
SUGGESTED TRADE:
Swing Trade
Short USOI
Entry Point - 68.66
Stop Loss - 69.40
Take Profit - 67.23
Our Risk - 1%
Start protection of your profits from lower levels
Disclosure: I am part of Trade Nation's Influencer program and receive a monthly fee for using their TradingView charts in my analysis.
❤️ Please, support our work with like & comment! ❤️

OIL IDEA /30 06 25So we are looking for this Short position, but first we need a better Premium position

USOIL - Bearish Double TOPHello Traders !
The USOIL failed to create a new higher high.
The price formed a double top pattern.
Currently, The neckline is broken !
So, I expect a bearish move📉
________________
TARGET: 64.970🎯

USOIL long WTI crude oil is approaching strong support around $71, with oversold technicals and stabilizing demand outlook. Geopolitical tensions in the Middle East and potential U.S.–Iran friction may limit downside. A long position targets a rebound from this key level.
Elliot...

USOIL Will Go Lower! Short!
Please, check our technical outlook for USOIL.
Time Frame: 9h
Current Trend: Bearish
Sentiment: Overbought (based on 7-period RSI)
Forecast: Bearish
The price is testing a key resistance 66.917.
Taking into consideration the current market trend & overbought RSI, chances will be high to see a bearish movement to the downside at least to 62.519 level.
P.S
Please, note that an oversold/overbought condition can last for a long time, and therefore being oversold/overbought doesn't mean a price rally will come soon, or at all.
Disclosure: I am part of Trade Nation's Influencer program and receive a monthly fee for using their TradingView charts in my analysis.
Like and subscribe and comment my ideas if you enjoy them!

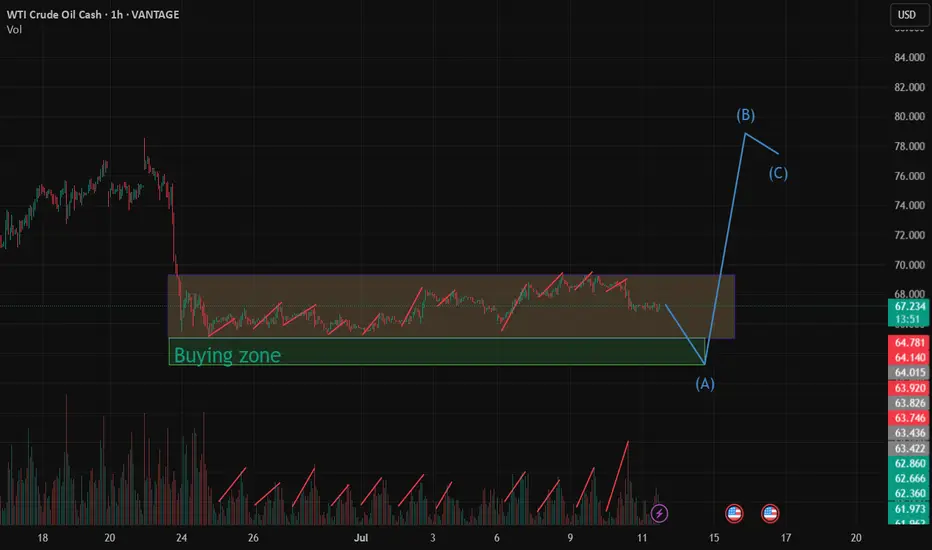
Does someone knows something that we don't?It seems to me we are getting in an accumulation phase on oil. Is there another war rally on the horizon or something else!? They can manipulate price but they can't manipulate volume that easily. Notice that every time price rises, volume rises with it and when price falls, volume decreases with it. My bet would be buying bellow the last lows, where a sea of stop loss rests, before ripping up the page.