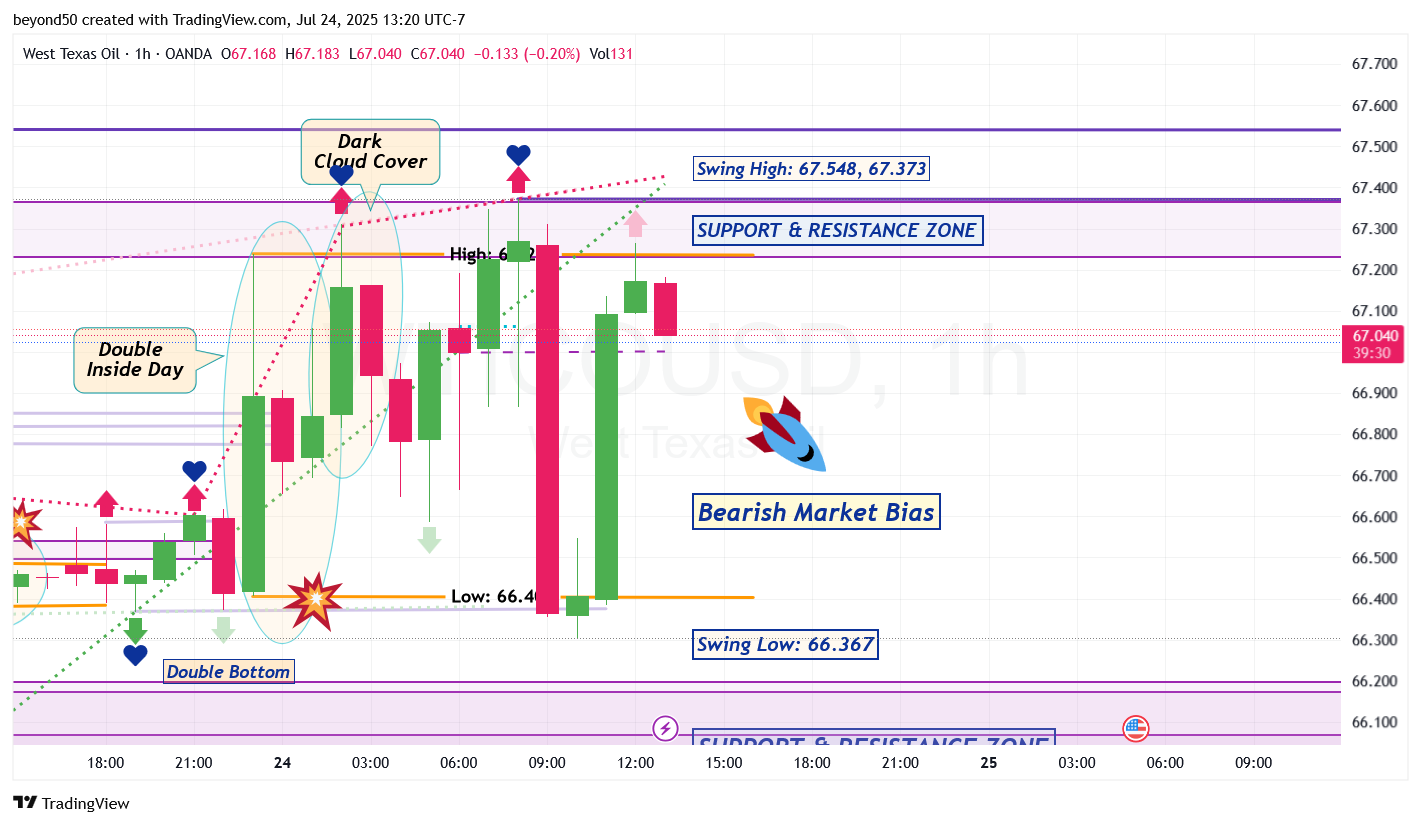
WTICOUSD Call This Crazy 2.0 We've got another fake breakout from the high of the Inside Day at 67.239, so back down again towards the Swing Low of 66.367. Let's see if it's a true breakout on that end. And will they even reach down that far?
*Side Note: The candles have still stayed below the Ascending Wedge created by the two trendlines (in red and green dotted line). Still amazing.
USOIL Youre all fighting a lost battle with oil, there are better assets trending than this piece of heap ! I closed all my positions here, oil can retire for now it’s doing absolutely nothing , don’t waste time trading this slug 🐌
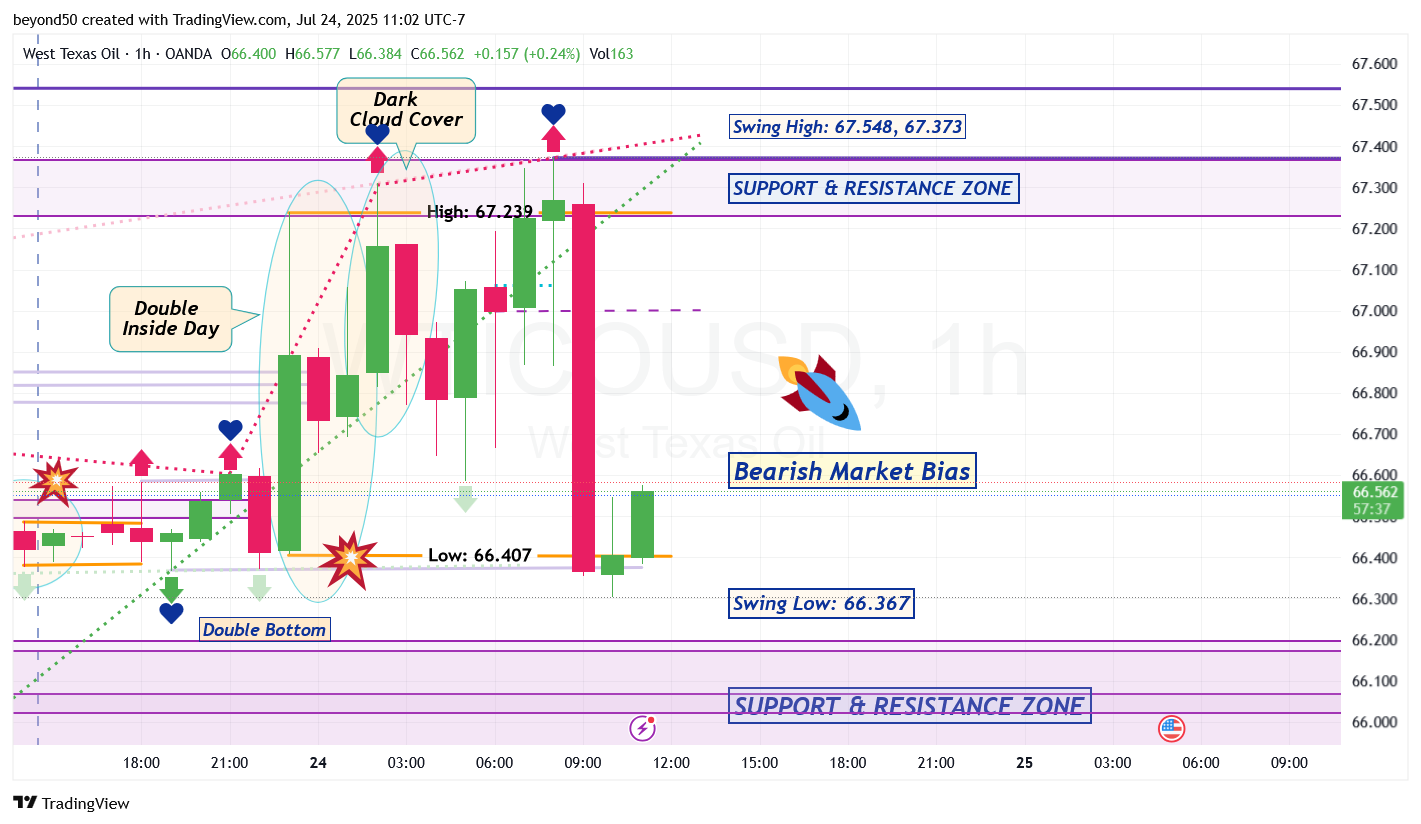
WTICOUSD Looks like a fake breakout at the low of the Inside Day at 66.407 (shown as an orange line). Let's see how far the bulls rally - potentially to 66.700 through Mean Reversion - then head back down again because the Hourly is still in Bearish (directional) Market Bias.
*Reminder: The midline of the previous very tall bearish candle, all the way up to its high, is a strong Resistance Zone, which is a real challenge for the bulls.
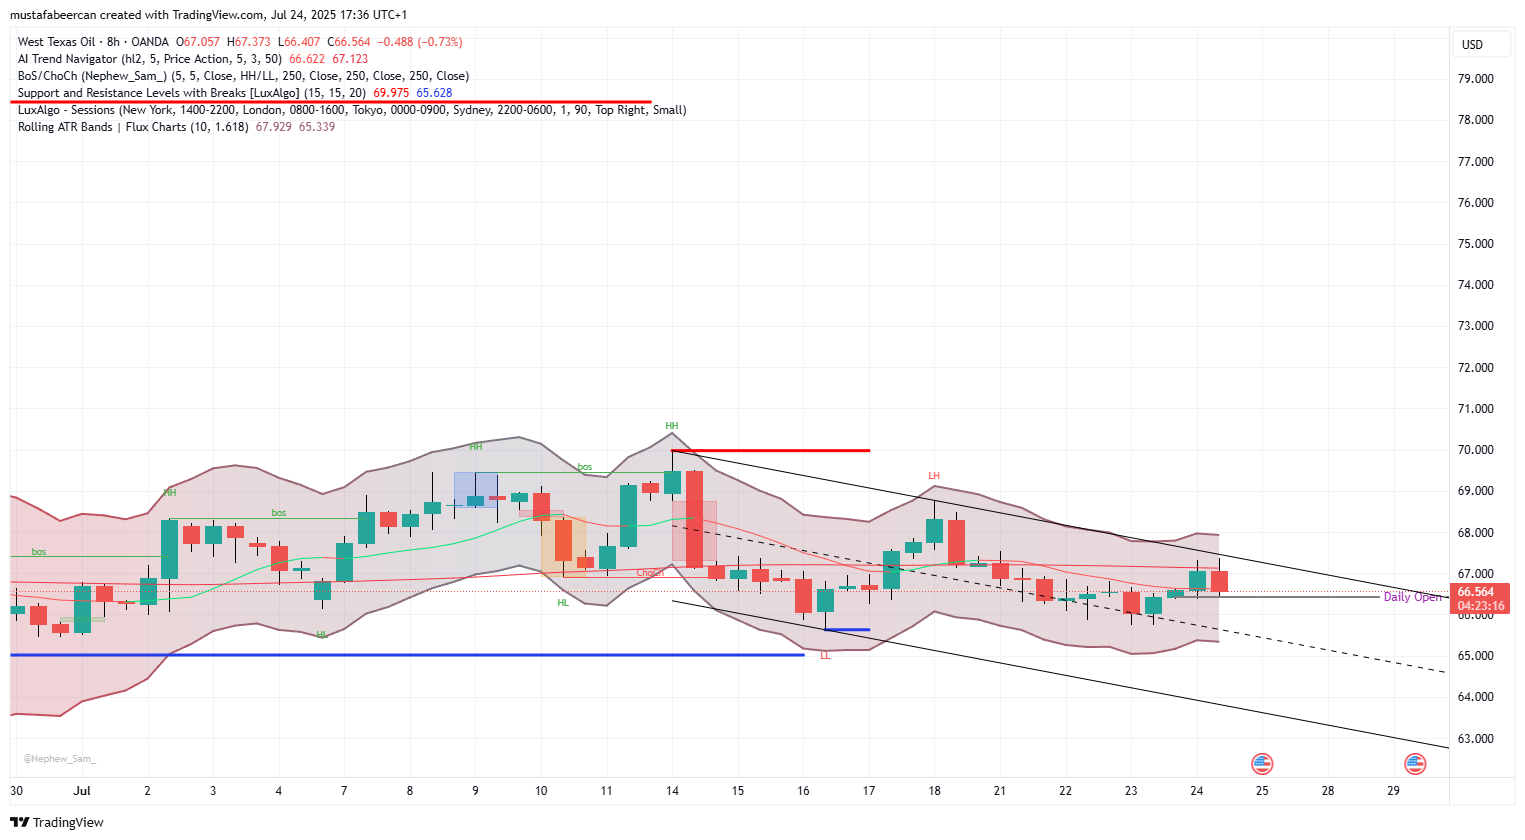
OILUSD we might not see $100 yet. I closed my buy positions. Not enough momentum to the upside at this area (tho can only confirm only after D1 candle closes). And it’s currently respecting a market structure break to the downside. We could indeed go back to the lows again and I’ll see then. Maybe a double bottom…maybe.
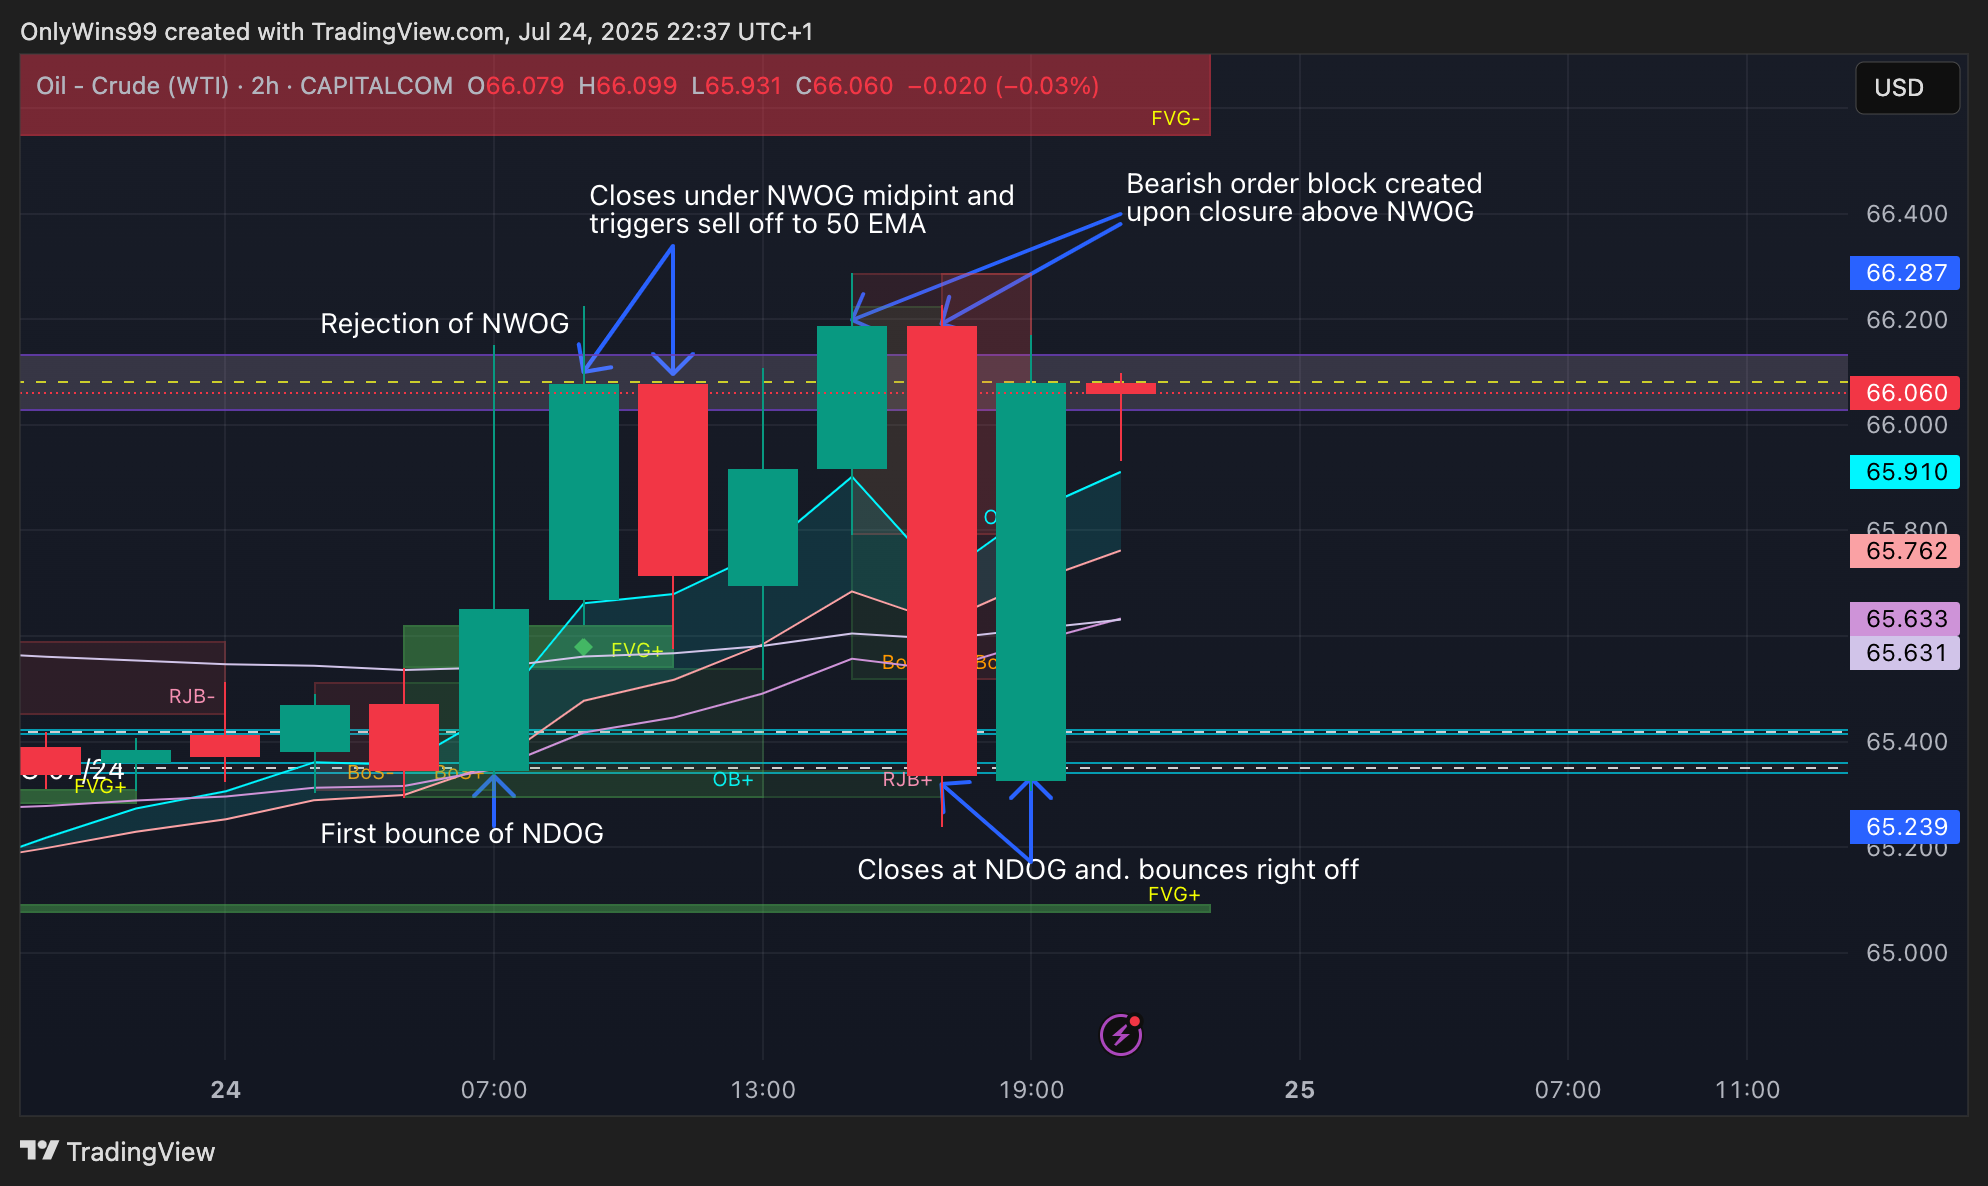
WTICOUSD we went almost to the top of this channel. The last move down was attributed by the news:
Trump administration greenlights Chevron to resume pumping oil in Venezuela - WSJ citing sources.
We have to remember the long term rhetoric is still oversupply. There is only 4 hours of trading left, 2 of which is typically slow with low volatility. I think time to cook dinner for my son, watch a film and chill. Good luck if you trade.
 USOIL
USOIL