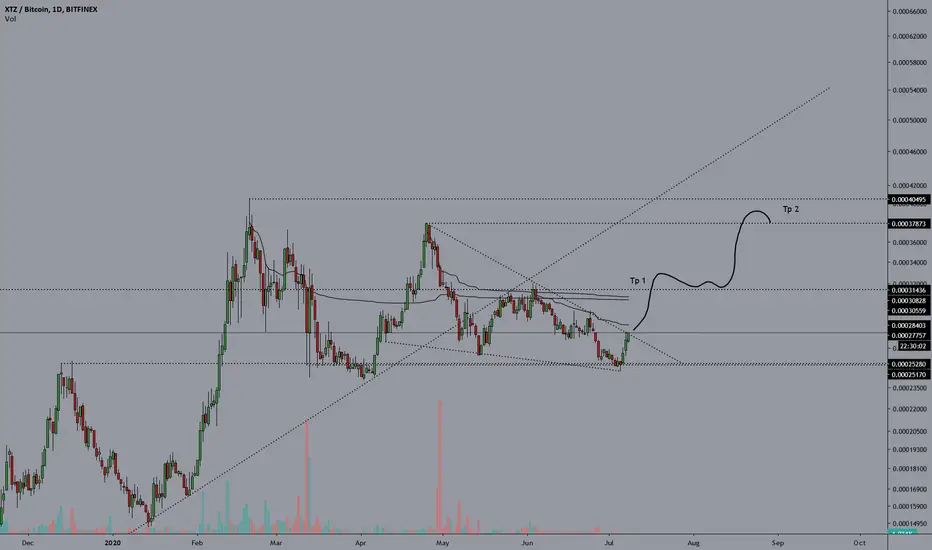
Large Scale Double Three Correction IdeaLooking very much like a classic complex correction pattern. You can either see it as double three or triple three, but I bias to simplify it as a double. The final ending could break down the triangle to form a zig zag too, which would be more short term bearish. However, I believe that does not change the outcome of the final wave up.
See below link for a double three example of USD/JPY - very similar pattern
ewminteractive.com
XTZBTC trade ideas


xtzbtc 7.12.20Mercury retrograde is very interesting when looking at Tezos. I do believe the planetary cycles do show some correlation in the charts. correlation is not causation.
There is more to this world than we can even fathom. anyway....Tezos is compressing and looking to move against Bitcoin. You guys know when Tezos decides to move it goes HAM. These moves can be violent and will completely destroy any bears in its path

Tezos Vs. BitcoinI was asked to look at the XTZ/BTC pair...
Overall, I would say this formation has a Bullish lean. There is clearly a tightening symmetrical triangle on the 3-day chart. The price action has remained above the 200-day moving average since it broke below earlier this year. Now the price has broken above the 50-day moving average, is holding above, and continues to generate momentum upwards. I would watch the 50-day moving average closely. If that average is broken, it will be time to reassess.
However, I will point out that I have seen triangle formations like this break out to the downside. You have to notice that there have been a series of higher lows as upper resistance on the symmetrical triangle*. If BTC buyers flood the market and BTC becomes majorly bullish breaking out of its long term triangle, it may be the asset you want to be in.
The RSI also looks to break above an upper line of resistance. It could break above to set up new support, or it could get rejected by the resistance. I'd keep an eye there as well.
I would like to be properly positioned in both trades, personally. If we're in a new Alt season, you definitely do not want to miss that trade. Trust me.
As always, calculate the odds, set your stops, & DYOR.
*Doesn't necessarily mean it's a bearish set-up


Tezos $XTZ - Swing Trade / long-term investmentElliott wave analysis and oscillators @1D and 3D TF indicate that Tezos $XTZ is a good investment right now!
SwingTrade XTZ-BTC:
entry: 0.00002650-0.00002685;
TP1@0.00003098;
TP2@0.00003449 with 3% TTP
TP3 >> 0.00004000
no stop loss recommended for this crypto -> accumulate it and hodl/stake it for long-term!
I´m not a financial adviser. For educational purpose only!

XTZUSD - Another good pump candidate?Could be another good pump candidate. Bounced off weekly resistance and trending upwards atm.
Keep in mind that this is high-cap alt (i.e harder to pump) and retrace is still possible, but R:R is 2:1 atm.
Hit the "LIKE" button and follow to support, thank you.
Information is just for educational purposes, never financial advice. Always do your own research.


XTZ/ BTC - a bit risky longAn instrument with short history so no real expectations here beyond movement in a channel in the foreseeble future.
Reasons to go long:
1. Broke descending trendline
2. Still within lower range of channel.
3. Daily broke MA and is above, needs to hold though.
3. Wave theory suggests completed abc correction and new impulse up.
4. Alt season began?


XTZBTC 55% potential profitXTZBTC is now approaching support level of 2415-2450 satoshis.
This is a strong support level and we can expect a bounce back from this level.
Entry: 2415-2450 satoshi
Target 1: 2895 satoshi (around 18% profit)
Target 2: 3162 satoshi (around 29% profit)
Target 3: 3769 satoshi (around 55% profit)
If support is not hold, stop loss can be set below the support zone.

#XTZ - Looks Litty and Preparing for Pump!Tezos is finishing the first ascending wave. Now there is a resistance at the 2910 sats level, there we expect to see a small correction down to the 2730 - 2790 sats zone. This zone can be considered as an entry, we will place our bids there.
If we see that the price breaks through 2910 level and takes hold above it, it would be very bullish case. Target is opened, but we will start taking profits above the 3000 sats level.

Elliot count on XTZ Hello, traders.
If we count Elliot waves in XTZ we are going to see very clear patterns of its impulsive waves and corrective waves, we believe that the XTZ corrective wave has now ended with the support test at an important support level and we may be heading towards starting another bullish movement for this asset with the waves 1 2 3 4 5.
I know the chart is polluted, but we can see clear patterns in the Elliot count, so push the like button and follow us on tradingview.

Tezos (XTZ) - rejectedTezos tried to exit the falling wedge again and got rejected.
Lets wait and see where next candle closes, if it closes below the line we will see it cointinue in this "channel".
If the next 4hr candle closes above the line we can see it run to the first target.
Although i would be carefull here as RSI is close to the oversold area and the fact that it just got rejected shows us that the bulls dont have enough strenght to break through it.

XTZ - Ready for take off....Weekly chart - XTZ has been under sell pressure for a number of weeks. It's not approaching a weekly OB where I expect buyers to come in strong. It may me before a wick into the block as it's a popular coin and we have a 4H Bullish Divergence on the 4H. You can also see on the weekly the 27EM'A is red providing support.
Enter a small position here and ladder in or set orders within the order 1st block in Blue with a stop under the lower order block in blue.
BINANCE:XTZBTC
Please comment - Like & Share.
If you like give me a follow.....
Thanks


Tezos BTC opportunitiesI have been posting several crypto set ups lately because currently there are many pumps happening across several coins. Great opportunity to increase your BTC value.
Tezos had some strong moves in the last few months and several demand zones have been created, these present decent trading opportunities


xtzbtc 7.3.20Remember when i told you that shakeouts didnt have to be huge price dumps and could be long bleed outs that bore traders out of their positions? That is exactly what is going on right now. There are ways to spot a Composite Operator not only accumulating as cheaply as possible but also selling into any rally to keep the price in check. This can go on for many months


XTZ/BTC Bullish Price ActionThis is a great pair to watch and I'm bullish on both. Smart money & institutional money will likely dive deeper into cryptocurrencies and XTZ is a good choice. Retail adoption will likely dominate Bitcoin, largely due to name recognition and ease of access. Price action is beginning to imply this level of resistance is holding against consolidation.

