Tezos Bullish Engulfing candlestick pattern.Hello Traders,
XTZ is showing us a bullish engulfing candlestick pattern after reversal at 0,5 fibonnacci level, but we still bellow the short term resistance line,
For now we must wait to see if we broke the short term resistance line, but we see this asset on a bullish momentum.
Please push like button and follow us on our social midias.
Best regards Sandro and Gustavo.
XTZBTC trade ideas

#Tezos / BTC Tezos made a fantastic spike
We still expect that the rise has not ended and will continue to rise to respectable prices, as shown in the drawing
A good buy is on the trend line
If the trend line is broken, this idea will be canceled
Please support this idea by pressing the like button
Take Care

XTZ31.47k sat low as LoD w developing throwback meme that might send price over may open for daily/ weekly close.


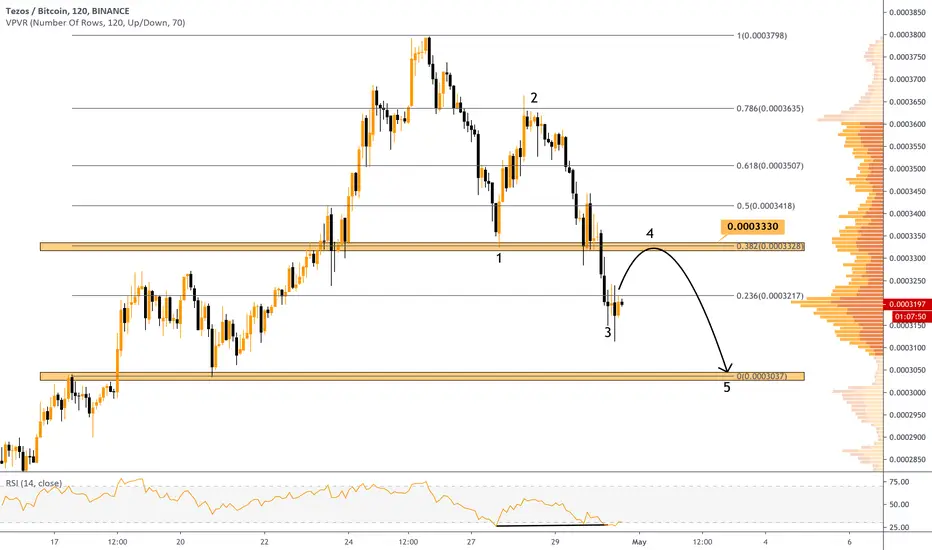
#XTZ - Better To Reduce The Size..Here we can see a small upward movement to 3300 resistance and then continuation of the decline in form of 4-5 wave.
Upward movements can be caused by the convergence, but then - dump.
Halving soon, money won’t stay in alts. If you have lots of alts - reduce sizes. sizes.

monthly closed below support,A move above resistance will make for a fantastic MAY or bitcoin dose its thing and skyrockets

XTZBTC Tezos potential Cup and Handle In the making *LongThis is a premature idea, but food for thought.
We see Tezos has made a nice broad cup formation and has retraced after making a double top which coincided with BTC's recent pump.
Ideally support will form around this current area before this pullback goes to deep, which would invalidate this idea. But as of right now, stoch RSI levels look close to resetting on the daily time frame and BTC appears to have cooled off momentarily. Would like to see a volume surge as well.
The hope is that an alt rally will soon be sparked, as the market price action has been muted by BTC's rapid rise.
Safe bet would be to layer in small buy orders in the 2800-3200 area. Or wait for a strong daily close above the neckline of the cup.
This has the potential to be an insane profit opportunity.
As always, this is not financial advice. Trade carefully.

Where to buy XTZ?Hello Traders,
XTZ was on a bullish trend before the bitcoin pump moviment, and now is showing us double top formation, so where to buy this asset?
Based on Fibonacci Retracement toll we a have a possible buying points, now we are testing the first Fibo level, and only 10% of times the price retrace to this level and start a uptrend moviment, the best place to buy is on 0.5 fibonacci retracement level.
But we have a possibillity to test the important support level one more time.
Please like this post and leave your comment.
You are welcome to follow us on our social networks.

XTZ - BTC -- Profitable Pair to tradeIn my opinion a portfolio with both of them longed will profit in the long run.
So its always a win-win when trading this pair. This is how I think XTZ behaves while its XTZUSD pair goes to make all time high soon.

XTZ/BTC ForecastThis is my bullish forecast for TEZOS. Cup and handle formation ongoing in my opinion.


Trend line again - xtz to follow btc?Maybe xtz will follow btc like a mosqitoe?:) If it bounce at trendline we’ll have a higher low, wich is bullish. If break of previous low, i might concider sell into btc.

XTZ bullish chart
XTZ seem like will be pulling back a little to test 2900-2850 support. But in general look bullish. One of most interesting charts among big cap alts, together with BNB. Therefore this pullback should be considered as a chance to buy more.
The following SR zones are good for buy/sell targets.
Support: 2900 - 2850 - 2770 - 2656 - 2570
Resistance: 3070 - 3200 - 3380 - 3540

In times of chaos, could life really be so simple?2.6x xtz against btc in ~30 days. Based on fib level and slow grind down to previous high completing.

Sold my XTZ back into BTC until 21EMA/50SMA DX occurs again.A couple of days up to 2 weeks max of downtrend expected to have commenced.
Probable target is perhaps at the thick orange 200 SMA around 78.6% Fib.
However if XTZ drops below the 200 SMA and gets rejected, then it suggests a more drawn out bearish phase.


When I might sell XTZBTC? (6hrly Chart)When the red 21 EMA crosses below the green 50 SMA.
Will also monitor the PRISM Oscillators Sets at the higher timeframe (i.e. 1D)

XTZ - 25% - 35% Trade - 6R#XTZ - just closed a nice trade on XTZ & this is what i'm looking for to open a new one.....
Flip this blue to support or retrace back to lower blue support
2 setups... Use risk management.
image]https://www.tradingview.com/x/7S63alqS/
BINANCE:XTZBTC
Plz leave a comment / like & follow...

Tezos, The Self-Evolving Governance ModelCRYPTO RECOMMENDATION: Tezos (XTZ)
Tezos, The Self-Evolving Governance Model
Dear Friends,
Over the years, we have seen numerous blockchain platforms aiming to launch self-sufficient smart contracts and DApps.
Some of the good examples are Ethereum, NEO, and Qtum. And each of them took different routes to implement their ideas and goals.
However, there is one problem that plagues them along with similar blockchains – governance.
And if you have paid attention, one of the main themes of 2020 has been about governable blockchains.
Tezos is a new cryptocurrency with two core features: a self governance system and the ability to form start contracts using its own unique programming language, MICHELSON
Why governable?
Well, because blockchains like Ethereum, NEO or Qtum aren’t self-governed and hence have much reliability on few human players for the same.
But there is one blockchain platform that is doing it in a totally different way. So much so, it looks like they have solved the problem.
Meet Tezos:
Tezos is an open-source decentralized blockchain platform for smart contracts and decentralized applications with a formalized governance model.
Here, the governance model is not ad-hoc or unplanned. Rather, it is a self-evolving one.
That’s why Tezos dubs itself as self-amending blockchain which can evolve as per the needs of the industry without getting fragmented time and again with hard forks.
The Tezos blockchain has also implemented a native cryptocurrency called Tezos (XTZ) which acts like the fuel for the blockchain, just like Ether in Ethereum. (More on this later)
How Does Tezos Work?
The Tezos blockchain is developed in a modular style with a generic and self-amending crypto-ledger. And this is achieved by an agonistic native-middleware called as ‘Network Shell’ (More on this later).
And the blockchain protocol can be broken down into these three layers, namely:
I. Network Protocol
II. Transaction Protocol
III. Consensus Protocol
The network protocol is the gossip protocol which is responsible for peer listening and broadcasting between nodes.
The transaction protocol is responsible for the transactional layer and the accounting model a blockchain implements for its transactions, like UTXOs for Bitcoin.
The consensus layer, as its name suggests, is for reaching agreement on the state of transactions that have occurred or will occur.
Here, transaction and consensus protocols combined are sometimes referred to as blockchain protocols. And the network shell is responsible for communication between the network protocol and the blockchain protocols.
This is possible because the network shell is agonistic to blocks, transactions, and protocols
And even these protocols can be amended by the network shell upon consensus from the community. Hence it works by maintaining the best chain known to the client. This is called self-amending blockchain or on-chain governance.
Tezos Features:
I. Self-Amendment
The self-amendment feature helps in the upgrading of blockchain without undergoing a hard fork. And hard forks are generally not good for the community as it destroys the network effects for which the community has worked so far for.
II. On-Chain Governance
On-chain governance is nothing but simply voting on the platform over a proposed protocol amendment. But with a combination of on-chain governance and self-amendment event, the voting process can be amended as per the needs of the time. And this voting will be done by the stakeholders of the platform. (will talk more about stakeholders later)
III. Smarter Contracts & Formal Verification
Tezos uses Michelson, which is a functional programming language for smart contracts and DApps. Having such a language is very useful as it helps in formal verification. Formal verification simply means, mathematically proving that a certain piece of code will behave as expected and as coded. But this doesn’t mean it is full proof or no bugs will be there in the code after formal verification. Instead, it acts as a caution to prevent costly bugs as we have seen during the DAO Ethereum attack.
Proof Of Stake
Tezos is a delegated proof of stake system that requires one to stake a certain number of Tezos token to participate in the consensus over the blockchain. The process of staking Tezos tokens (XTZ) is called baking in Tezos’ ecosystem through which nodes or participants can earn more XTZ and simultaneously secure the blockchain.
Tezos Team
The Tezos team is comprised of an amazing couple and also its co-founders who have withered the hard test of time in launching Tezos amongst so many hurdles that we will discuss in the end.
Tezos ICO: Total Tezos Supply
Initially, there were 10 billion tokens available for the sale but this was not the final supply. Instead, the total token supply was decided based on the number of tokens sold in the ICO in mid-2017.
And it was one of the biggest ICOs to be concluded in the history of cryptocurrencies at that time because it had raised $232 million.
Currently, as per CoinMarketCap, the total circulating supply of Tezos is 708,369,475 XTZ and the current price of each unit is $2.75 which values it at approximately $1,961,170,604 (at the time of drafting this post)
Tezos’ Future And Roadmap
I believe Tezos’ future will exciting but before discussing the future, let us take a look at the history.
Well, after Tezos’ successful ICO there was a rift between the founders and Tezos foundation’s president. Plus, there were class action lawsuits filed and SEC was too involved declaring Tezos as security.
But all those issues have been dealt with by the Tezos’ team bravely but this has led to a delay of almost 8-10 months in the project’s development. Here is full story of Tezos’ saga as told by its founder.
As much as I commend the founders and the dev team on the launch of their beta, it was disappointing to not be able to find a properly laid out roadmap of a quarter billion dollar project.
Also, when you are competing with other blockchain platforms and smart contract platforms like Ethereum and NEO, you need to have a plan.
Plus, your website should have proper documentation like Lisk or Ethereum has to make it easier for developers to adopt you.
On these fronts, Tezos is clearing lagging behind but if we give them benefit of doubt for some time as they have just recovered then I think these things should be in place with the launch of mainnet launch. Otherwise, it is going to be very difficult for Tezos to survive.
Lastly, their smart contract language (Michelson) is pretty unknown to the world which will also take a decent learning curve for the developers.
CALL TO ACTION: I suggest scaling in to a position which is always the best approach to reduce exposure in the markets.
Long term expectations are $10 to $13 by the end of 2021 and it’s very possible to see $36 in three to seven years time!
Will be happy to hear about your constructive feedback in the comments section below.
Stay ahead of the masses,
Seth Maniscalco
Founder, Crypto Wealth Coach
Owner, Modern Wealth Management
Founder, Trading Resource Artifical Intelligence Network (T.R.A.I.N.)

