XTZ strategy.Hello Traders,
Today I am gonna be showing a two buying options strategy for XTZ, one of them is if we break above this short term resistance line, or on the test of this important support Level. We still see the price on bullish trend so we not will go short until the price is above this important support level.
On the chart we mark important informations as entry points, and our objective is the last uptrend short term moviment projection.
Please support this publication with your like. You are welcome to follow us on the Tradingview.
Best regard Sandro and Gustavo.
XTZBTC trade ideas


Tezos possible next push upjust sketching graph out, looking like tezos might have another push up soon. RSI oversold, macD looking like might flip, .618 almost touched


XTZBTC - SOS TA Fridays 28/3/20I will enter this trade if price breaks out of this descending triangle with strong bullish candles (bullish engulfing, bull hammer) or if it breaks out and has a small retrace for confirmation.
My first profit target is at 38.2%, then at 23.6% (resistance at both these levels).
This may take a day or 2 to present a good entry, then 5-6 days to hit my first target.


Triangle is going to close:XTZ/ Read about XTZ , UVU and FLL. And type what do You think about my price action?
Please read about my recommendation in new crypto market #UVU
BUY : www.hotbit.io
CHECK : coinmarketcap.com
SITE : ccuniverse.org
XTZ : is forming big triangle at 1h candles and I see that it should back at the top level also MACD indicator shows me same - Whats important at last days I am more confident about bulls than bear at BTC so whole market could speed up.
What profits You will get if You decide to spend* *3k USD at* *UVU* ?
1) You will clean the orders book at Hotbit (main exchange)
2) You will get 1.8m UVU which will be huge value and Your investition after it could be worth 18,000 USD dollars !!!!
I am suggesting to invest in altcoin like : UVU which is new coin but with great perspective. Why UVU ? Because their unique vision based on crypto atm and recharge stations for electric cars . This european project got first successes behind them like listing on big Hotbit Exchange - You can trade there without K-Y-C so registration is easy and fast - brilliant model for less experienced users.
Look into it:
www.hotbit.io
Moreover the price is still cheap it means BIG space to grow . Team predicted that price for 1 UVU should be a round 0.2 USD in March and now its just 0.0028 USD !
Also the cirrculation supply isnt big so it also work for future profit because many coins could be in Yours hand for less payment .
Think serious about investition like this !
Also You will help to grow whole market because their mission to assimilate devices like Crypto Atm to local society .
coinpaprika.com
Check the chart :
Please read about my recommendation in new crypto market #FLL
BUY : feelliketimetraveler.com
CHECK : feelliketimetraveler.com
SITE : feelliketimetraveler.com
FLL its completley new project which want be such an model agency / advertise agency using blockchain to achieve the targets. How ?
By simple scheme:
Selling FLL —>> Organising Model Session —->> Bringing Followers to Instagram —>> Selling Product Placement at Next Sessions —->> 85% Profits will back to Investors by buying back tokens by Team at Exchange !!!!
I think that attractive sessions and models will bring thousands of fans and followers and it will be big success !! So if You are searching new project or place to invest - Try FLL!!
Be first and buy FLL at private panel : feelliketimetraveler.com - or contact with team by e-mail : support@feelliketimetraveler.com
Best Regards

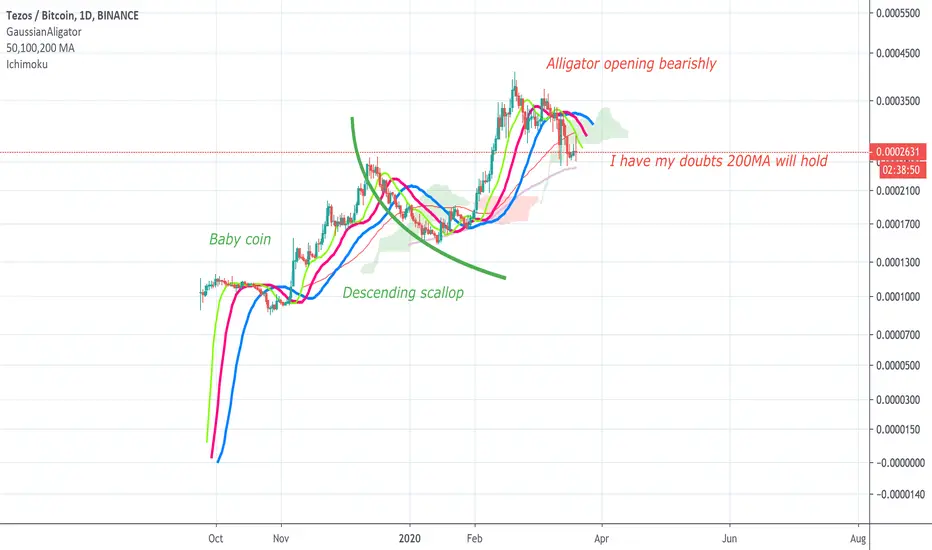
Tezos Bearish alligatorTezos has seen a great bull run. However it has reached the point where the downside potential is A LOT greater than the upside potential. Support for this theory includes the bearish opening of the Gaussian alligator indicator, preceded by a double top and a bearish divergence. The previous Bearish opening held bullish potential due to the formation of the descending scallop, a bullish reversal pattern. By 'baby coin' I mean the coin is very young and most alt coins do not show this chart structure in their early days, its just strange. A personal bias may come into play, I do hate this coin.. xD
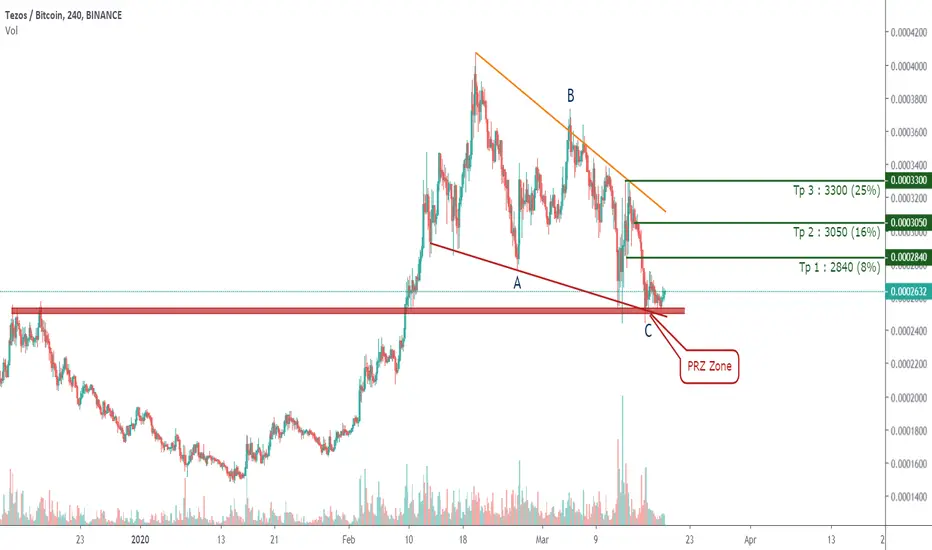
XTZ End Of ABC Correction ,On a PRZ ZoneXTZ / BTC
Exchange : BINANCE
▶️ Buy : 2630
👇 Targets :
✅ Tp 1 : 2840 (8%)
✅ Tp 2 : 3050 (16%)
✅ Tp 3 : 3300 (26%)
🔴 Stop loss zone : 2400 ~ 2380
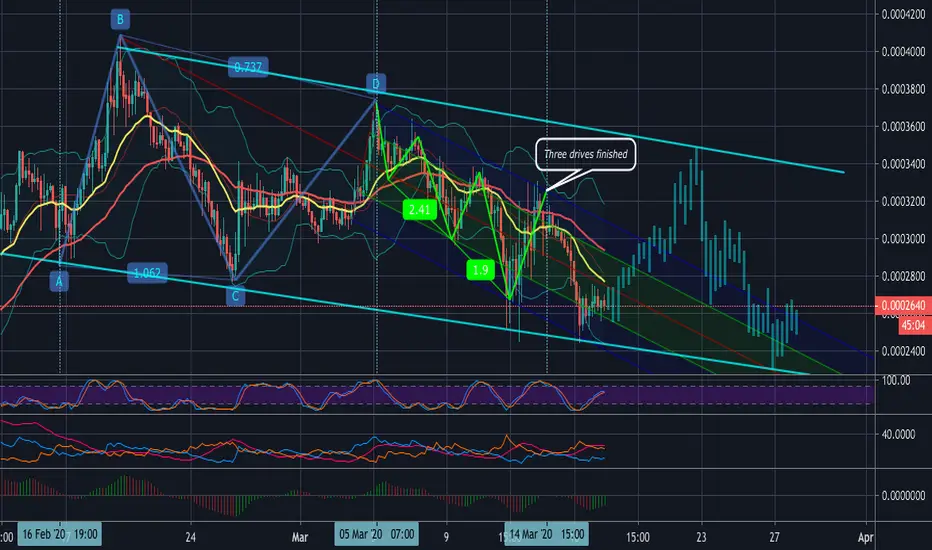
XTZBTC | Do you have a fork? Yes, a Pitchfork!Analyses of the large timeframe scales reveals a formation of ABCD basis at XTZBTC position. Pattern started on 16th of February and finished on 5th of March which is displayed at the chart.
This is a very important and interesting moment because subsequent price action went in a traditional three drives pattern. Thus a descending channel with strong support and resistance levels was formed
The support trend line helped Tezos to survive Bitcoin market crash but further the complete pattern was accurately finished on 14th of March. As always three drives forms a Pitchfork which in this case is based on continuation ABCD pattern
Price action takes place right at the bottom of it and according to consolidation|distribution pattern finished accumulation and is ready for a growth right to the upward edge of the Pitchfork channel
There is no fundamental basis for Tezos to break Pitchfork thus our final target will be the upper edge of the pattern, further we expect a decrease
Automatic premium signals is shared in the Telegram premium channel and applied through API
Tezos Cup & Handle formationA weekly close above the RED line is a confirmation (Big VOLUME required).


XTZ/BTC TA Update (Another leg down?)XTZ/BTC
XTZ broke horizontal support at 2900 sats and now facing to resting the upward trend-line support which is located in the 0.618 fib levels.
Most traders are looking for a bounce play once the price reaches that zone of support.
But today, Technical Analysis is becoming too risky if the world market is in fear regarding the virus affecting all sectors.
Be cautious, trade with proper stop loss and apply risk management all the time.


50 percent principlextz showing its impressive strength. this baby will be aspiring for king for years to come

XTZBTC in Strong UpTrend!!!
I include Tezos in my watchlist mainly because of the strong Uptrend that has been accompanying it for a few months. Over the last period Tezos has made a profit of more than 400%, so I will not hesitate for a while and once the corrective structure is completed I will buy XTZ. As for its Buy Zone, it is between 2750sats and 2550sats. I also have an alternative Re-buy zone in the graph but it doesn't have to be filled because Tezos is extremely bullish. After testing the Key and Bullish zones, the XTZ will only grow up to the Take Profit zone.

Xtzbtc - BullishXtz looks to be in a triangle here, will look to split take profits, final one is a moon shot that could possibly change but will judgeas market structure unfolds.

XTZ/BTC (Binance)After an impulse waves here we can see a triangle pattern (correction) and target have shown in the chart. Stop is losing 'c'.
