Tezos crystal ball short term double top 3624Has the party stopped? possibly short term we see a pullback to major moving averages on larger time frames. 1.07 is a possibility to swipe huge orders of liquidity and smash out longs. It could be very aggressive. Long term this thing is going higher. Be patient. Take profits all the way. If you dont know how to trade just dca in dca out
im not using leverage AT ALL
XTZUSDT trade ideas

Solana Rocket Ship PSHHH 22924Is Solana a WAY better play rn over XTZ? THe chart says so!!!
This could be Sol fomo rn fam! you only live once. Place your bets accordingly. I have been spread out in about 12 diff assets. All have done incredible.

$xtzusdt round 2hello All,
im here for another trade idea for $xtz. as you know we successfully closed our first trade. now it is time for round 2. im expecting some pull back( due to bull market this pullback may not be to much, I hope it will :)
If it reaches my entry price I will buy by closing my eye :)
entry and exit prices on the chart

$xtzusdt looks bullishxtz ready to bounce 30%.
if is not break $0.97 levels, it will reach easily $1.3

500% ROI from #Tezos Tezos has reached its lowest point on the annual time frame, hitting $1. This presents an opportunity for the cryptocurrency to rebound to highs exceeding $5, offering investors a potential ROI of 500% or more.
Amid an oversold market and signs of exhaustion, Tezos, a proof-of-stake cryptocurrency renowned for its robust blockchain, has garnered significant interest from investors at NIXXWORLD.
The projected 500% ROI merely marks the initial phase of this potential investment opportunity.

TEZOS ATTENTION!Three white soldiers forming on the weekly. Though imo we rip the face off this market and shoot straight to 1.5, 2.5, 10. Sky is the limit. Year of true decentrilization. Doesnt have to fight the SEC already paid its dues in blood. Tezos is the next Solana but is actually quite superior in every possible way and I really like Solana.

XTZ/USDT Could XTZ back to the supply area or downward is coming💎XTZ has indeed garnered significant attention in the market. It has faced rejection three times at the supply area, and the support trendline has proven to be resilient in preventing further downward movement.
💎 Currently, XTZ is still making efforts to move upward and attempt to break out of the supply area. If this attempt proves successful, it probability could trigger a bullish momentum, potentially leading the price to reach our target area.
💎 However, if XTZ fails in its ascent and breaks below the support trendline, this could indicate a bearish turn in the market. Such a scenario might lead to a downward movement, with the potential for the price to return to the demand zone around 0.766.
💎 When the demand area is reached, it becomes crucial for the price to bounce and resume its upward movement. The bearish scenario is confirmed if XTZ breaks below the demand area, which could result in the price continuing its descent toward the strong support area or establishing a new bottom.

XTZ/USDT | Tezos | 1W 👀As for future movements, it can be said that not all hope is lost in terms of medium-term growth. The current decline can also be seen as a retest of the local resistance area, so the uptrend may continue after the rebound.
- Not financial advice, trade with caution.
✅ Stay updated on market news and developments that may influence the price of Tezos. Positive or negative news can significantly impact the cryptocurrency's value.
✅ Exercise patience and discipline when executing your trading plan. Avoid making impulsive decisions driven by emotions, and adhere to your strategy even during periods of market volatility.
✅ Remember that trading always involves risk, and there are no guarantees of profit. Conduct thorough research, analyze market conditions, and be prepared for various scenarios. Trade only with funds you can afford to lose and avoid excessive risk-taking.
#Crypto #Tezos #Investing #XTZ

Tezos (XTZUSDT) Emerges as a Cold Crypto Wallet ContenderThe world of Cold Crypto Wallets is abuzz with excitement, and the spotlight is now on Tezos (XTZUSDT). Following the footsteps of SafePal's promising potential, Tezos takes center stage with a super bullish price action that demands attention.
Zooming into the specifics, let's delve into XTZ's long-term chart, where a fascinating transformation unfolds. The supply zone undergoes a metamorphosis, seamlessly transitioning into a demand area near the psychological milestone of $1. Tezos price pays its respects to this demand area in recent weeks, all while gracefully maneuvering within the confines of an ascending channel.
Over the next month or two, anticipation builds as XTZUSDT sets its sights on the $1.33 supply area—a pivotal destination aligned with the 161.8% Fibonacci retracement level. Therefore, we can expect a potential 40% price surge, a significant feat considering the sluggish altcoin market we've witnessed in recent months.

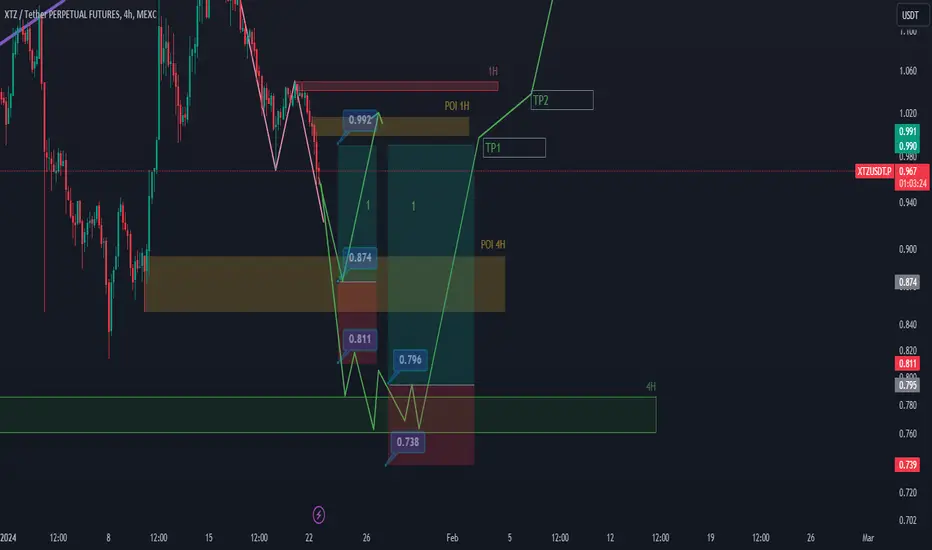
XTZUSDT.Preaching 4H Order block initiate the first long position and pending order could be placed.
if price go down to lower level near to 4H order block, according to weak upmovement in 4H time frame, i expect some fluctuation befor going up. and in oder to masive down movement in 4H time frame, pushing price to the up side s more possible
entry price, SL and TP is clear on the chart and i hope helps you makeing profit
It would be my pleasure to hear your thoughts on the analysis.
XTZUSDT.PXTZUSDT.P is in bearish trend.
Bearish divergence also shown in RSI.
Potentially printing LH and LL.
we wait and watch for the breakout of last LL.

TEZOS FORMING A POSSIBLE CUP AND HANDLEIn this chart of BINANCE:XTZUSDT , the coin is forming a possible cup and handle formation,
a bullish pattern in trading. In this idea, I will provide some keys and strategies in trading at this stage. So, stay tuned for the updeates on the idea threads below.
Happy trading and may all of us more profitable this 2024!

Does Anyone Really Care about Crypto ETFs? (PoW vs PoS)The crypto markets for CRYPTOCAP:BTC after this week's Bitcoin ETF announcement hasn't looked all that great, despite its anticipation over the last several years.
This week many of the proof-of-stake (PoS) projects that offer staking rewards (interest) have vastly outperformed its competition - is the the future to come, or does proof-of-work still have some hope?

XTZ Embrace the Power of Crypto: Invest Smart and Build Wealth **Tezos (XTZ) Fundamental Analysis**
Tezos is a blockchain network that aims to provide a more flexible and adaptable platform for developing decentralized applications (dApps) and smart contracts. It utilizes a unique consensus mechanism called Liquid Proof of Stake (LPoS), which allows for on-chain governance and seamless protocol upgrades without the need for hard forks. This makes Tezos a more dynamic and responsive platform compared to other blockchains.
**Key Features of Tezos:**
* **Self-amending protocol:** Tezos can upgrade its own code without the need for forks, ensuring long-term sustainability and adaptability to evolving needs.
* **Formal verification:** Tezos smart contracts can be mathematically verified for correctness and security, reducing the risk of vulnerabilities.
* **Decentralized governance:** Tezos holders can participate in on-chain voting to shape the future of the network.
**Recent News and Developments**
* **Tezos Ecosystem Growth:** The Tezos ecosystem has continued to grow in recent years, with several notable projects being developed on the platform. This includes DeFi applications like Plenty and Dexter, NFT platforms like Objkt and Kalamint, and staking services like Temple and Everstake.
* **Institutional Adoption:** Tezos has gained traction among institutional investors, with major companies like Fidelity Investments and Grayscale offering Tezos-based investment products. This indicates growing confidence in the platform's potential.
* **Protocol Upgrades:** Tezos has undergone several successful protocol upgrades, demonstrating the effectiveness of its on-chain governance mechanism. The latest upgrade, Babylon, introduced new features like increased transaction throughput and improved smart contract capabilities.
**Disclaimer**
Please note that cryptocurrency investments are inherently risky and volatile. The future price performance of Tezos (XTZ) is uncertain and could be subject to significant fluctuations. Conduct thorough research before making any investment decisions.

XTZ is bullishBullish structure, I am playing spot here...
Manage your riska nad use stoploss always.

idia for XTZCoin: $XTZ/USDT
Side: Short
Entry: 0.946 - 0.886
Targets
0.878 - 0.864 - 0.84 - 0.82 - 0.80
0.78 - 0.76 - 0.72 - 0.67 - 0.61
Stop loss: 0.983

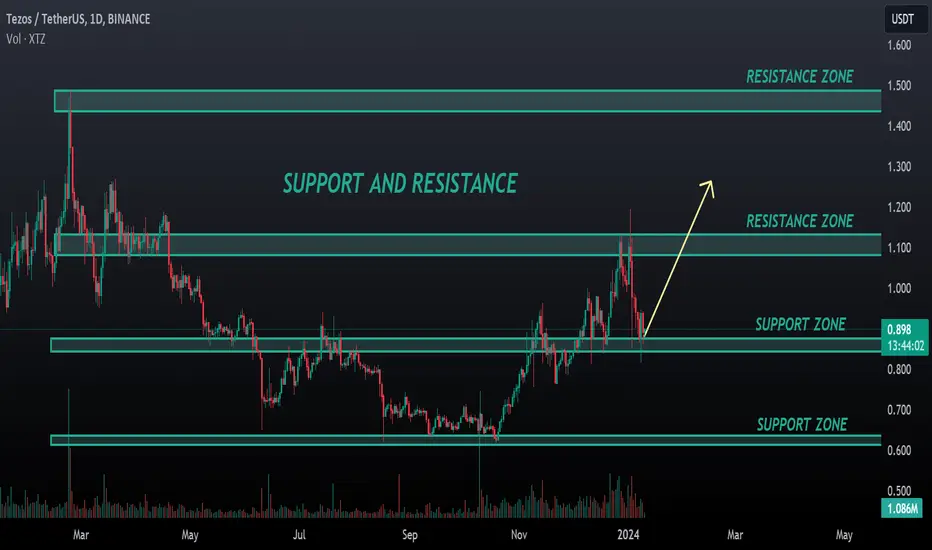
XTZ ANALYSIS🔮 #XTZ Analysis - Support and Resistance 🚀🚀
💲💲 #XTZ is trading above its supply zone and we have seen rejection from its resistance zone before. But if #XTZ closes above the supply zone and sustain the higher price, it will indicate a good bullish move 📈
🔖 Current Price: $0.899
⏳️ Target Price: $1.130
⁉️ What to do?
- We have marked crucial levels in the chart . We can trade according to the chart and make some profits. 🚀💸
🏷Remember, the crypto market is dynamic in nature and changes rapidly, so always use stop loss and take proper knowledge before investments.
#XTZ #Cryptocurrency #Support #Resistance #DYOR
🚨 Trade Alert: XTZ/USDT (3-5x)🚨 New Trade Alert 🚨
✅ XTZ/USDT (3-5x)
📉 SHORT Entry Zone: 0.946 - 0.886
⛔️ SL: 0.983
🔒 Breakeven Move: When it moves close to TP2
🎯 Take Profit:
Short Term: 0.878 - 0.864 - 0.84 - 0.82 - 0.80
Mid Term: 0.78 - 0.76 - 0.72 - 0.67 - 0.61
📝 Ensure you set entry orders to balance the trade's entry and aim to secure 30% of profits within the first two targets. Once profits are gained, adjust the stop orders to match the entry points or break-even levels.
⚠️ Disclaimer: Historical earnings cannot assure future outcomes. Is there a potential for risk? Certainly. The entire financial market is susceptible to uncertainties; any underlying factor or abrupt shift in market sentiment could overturn the current market trends and lead to losses. Refrain from undertaking undue risks that might jeopardize your financial stability. You are under no obligation to engage in this trade; kindly avoid the trade if you disagree with the trade analysis.
GIS TRADING®

XTZUSDT In Bearish ContinuationXTZUSDT is currently exhibiting a bearish trend, evident through the formation of Lower Lows (LLs) and Lower Highs (LHs) on its price chart. This downward movement is further emphasized by the creation of a bearish flag pattern, recognized as a continuation pattern indicating a potential extension of the prevailing downtrend. Additionally, this bearish sentiment is confirmed by the AB=CD harmonic pattern, showcasing a structure where the CD leg, currently forming, may signify a potential reversal zone at point D.
Given this market scenario, utilizing the Fibonacci retracement tool presents an opportunity for a strategic entry into the trade. To mitigate potential risks, the previous Higher Low (HL) is set as a stop-loss level, acting as a safeguard in case of adverse price movements. Furthermore, the trade strategy involves setting two distinct profit targets (TP1 and TP2) based on a 1:1 and 1:2 risk-reward ratio, respectively.

XTZ Inverse HEAD and SHOULDERS Tezos inverse H&S formation on the daily
This will be a easy 2-3x at least Points of taking profit are the green lines
STOPLOSS: 0,85 cents

upthis one is also as same as others for today.... i have illustrate all the info on the chart .... this is not a trading advice and its only my opinion .....

#XTZ/USDT#XTZ
The price has been moving in a descending triangle since May 2023
The downtrend was breached
Moving average exceeded 100
Current price 1.062
First goal 1.312
Second goal 1.498
Third goal 1.762

#XTZ/USDT#XTZ
The price has been moving in a descending triangle since May 2023
The downtrend was breached
Moving average exceeded 100
Current price 1.062
First goal 1.312
Second goal 1.498
Third goal 1.762
