Xvgusdt buy opportunityXVGUSDT is showing a strong move within a rising channel following a well-defined rounding bottom reversal. The focus is on the neckline of the rounding bottom, where wave 5 of the channel is expected to complete before a possible correction. This correction could evolve into either a cup and handle or an inverse head and shoulders (iH&S) pattern, time will reveal the structure. Watch the highlighted demand zone for potential accumulation opportunities.
XVGUSDT trade ideas

Xvgusdt buy opportunity you don't want to miss!!!!Xvgusdt is currently trading within a potential ascending setup following a 5-leg drop, signaling a potential upward breakout.
We have identified a clear setup for potential accumulation and recommend establishing a stop loss level to manage risk in the event of a reversal.
Your engagement is valuable, so if you find this setup helpful, please consider liking the post and sharing your comments.
Thank you for your support.

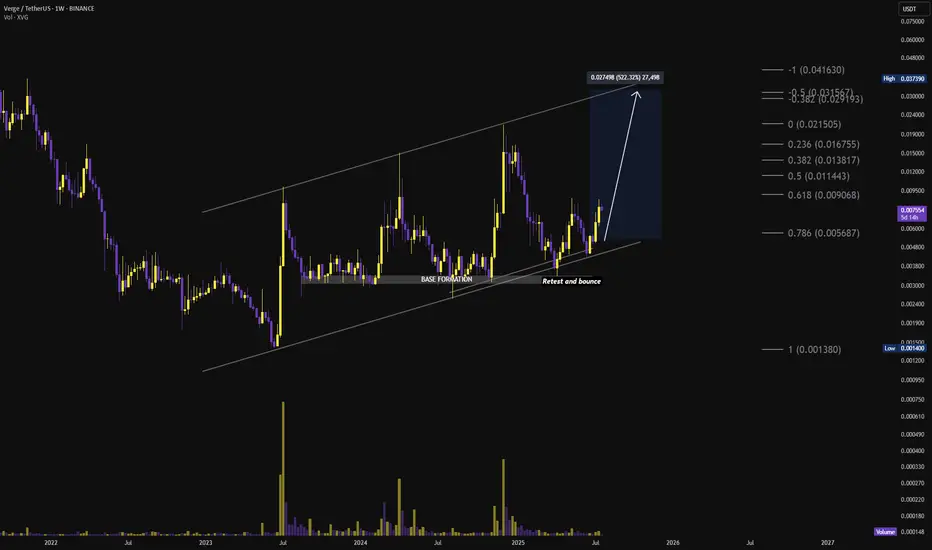
$XVG HTF Ascending Channel Continuation
Two-year Ascending channel📊
🎯 Targets:
🟢 Short-term: $0.0114 and $0.0138
🟢 Mid-term: $0.0215
🟢 Long-term: $0.03 and $0.04 (channel top measured move)
❌ Invalidation: Breakdown below $0.0050 (channel support + retest zone) 🔴
$XVG C&H long setupChart looks like a clear cup & handle. Looking for a breakout to the upside to reach top of the ascending channel...
XVGUSDT Forming Potential BreakoutXVGUSDT is shaping up with an interesting technical setup that could catch the eye of both short-term traders and long-term crypto investors. The chart currently suggests that Verge (XVG) is forming a potential breakout pattern after a period of consolidation within a descending channel. This pattern often signals that sellers are losing momentum, paving the way for an upward price reversal if a breakout above resistance occurs. With strong volume backing this move, XVGUSDT could deliver a solid gain in the 90% to 100%+ range if the bullish scenario plays out.
Verge has long held a spot among privacy-focused cryptocurrencies, known for its focus on anonymity and secure transactions. As crypto investors continue to diversify into projects with strong use cases, Verge’s established community and real-world applications add credibility to its potential upside. This renewed buying interest reflects growing optimism about Verge’s future, especially as it continues to improve its network and form new partnerships.
Traders should pay close attention to price action near the top trendline of this descending channel. A clear breakout with sustained volume could attract even more buyers, sparking a rally towards key resistance levels. Historically, Verge has seen sharp moves following similar technical setups, making this an appealing chart for swing traders aiming to capture high-percentage gains.
Keep XVGUSDT on your watchlist as we look for confirmation of this breakout in the days ahead. A decisive close above resistance could be the catalyst for the next major uptrend in this privacy coin’s journey.
✅ Show your support by hitting the like button and
✅ Leaving a comment below! (What is You opinion about this Coin)
Your feedback and engagement keep me inspired to share more insightful market analysis with you!

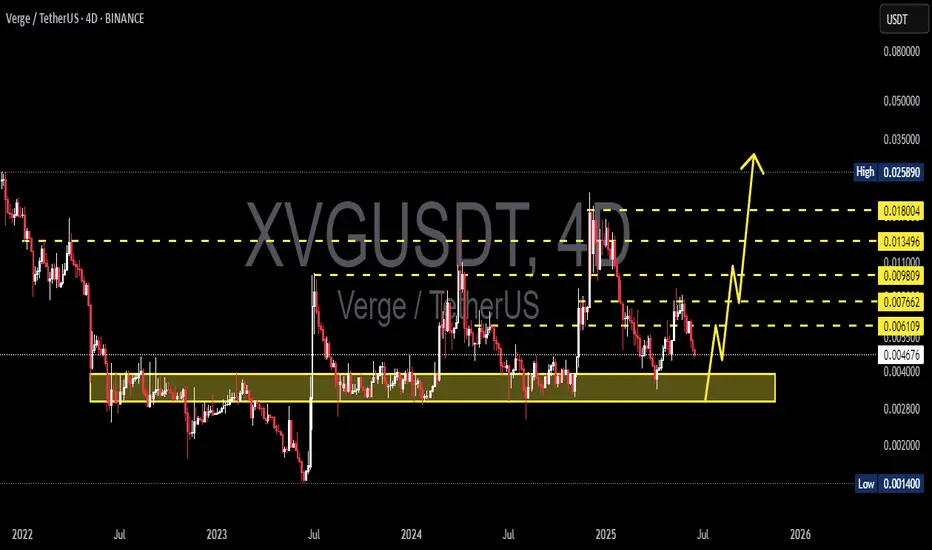
XVGUSDT 4D AnalysisXVG ~ 4D Analysis
#XVG Buy back on retest of this support block with short term target of at least 20%+ from this support.
XVG - Privacy is Important!Hello TradingView Family / Fellow Traders. This is Richard, also known as theSignalyst.
📈XVG has been overall bullish trading within the rising channel marked in blue and it is currently retesting the lower bound of the channel.
Moreover, the red zone is a strong structure.
🏹 Thus, the highlighted blue circle is a strong area to look for buy setups as it is the intersection of structure and lower blue trendline acting as a non-horizontal support.
📚 As per my trading style:
As #XVG approaches the blue circle zone, I will be looking for bullish reversal setups (like a double bottom pattern, trendline break , and so on...)
📚 Always follow your trading plan regarding entry, risk management, and trade management.
Good luck!
All Strategies Are Good; If Managed Properly!
~Rich

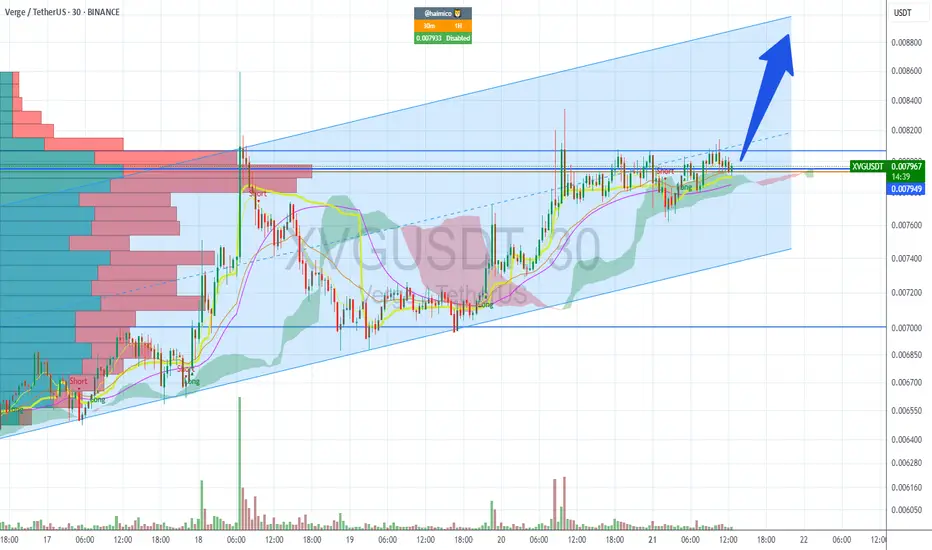
XVG/USDTKey Level Zone: 0.0072000 - 0.0073600
HMT v8.1 detected. The setup looks promising, supported by a previous upward/downward trend with increasing volume and momentum, presenting an excellent reward-to-risk opportunity.
HMT (High Momentum Trending):
HMT is based on trend, momentum, volume, and market structure across multiple timeframes. It highlights setups with strong potential for upward movement and higher rewards.
Whenever I spot a signal for my own trading, I’ll share it. Please note that conducting a comprehensive analysis on a single timeframe chart can be quite challenging and sometimes confusing. I appreciate your understanding of the effort involved.
Important Note :
Role of Key Levels:
- These zones are critical for analyzing price trends. If the key level zone holds, the price may continue trending in the expected direction. However, momentum may increase or decrease based on subsequent patterns.
- Breakouts: If the key level zone breaks, it signals a stop-out. For reversal traders, this presents an opportunity to consider switching direction, as the price often retests these zones, which may act as strong support-turned-resistance (or vice versa).
My Trading Rules
Risk Management
- Maximum risk per trade: 2.5%.
- Leverage: 5x.
Exit Strategy
Profit-Taking:
- Sell at least 70% on the 3rd wave up (LTF Wave 5).
- Typically, sell 50% during a high-volume spike.
- Adjust stop-loss to breakeven once the trade achieves a 1.5:1 reward-to-risk ratio.
- If the market shows signs of losing momentum or divergence, ill will exit at breakeven.
The market is highly dynamic and constantly changing. HMT signals and target profit (TP) levels are based on the current price and movement, but market conditions can shift instantly, so it is crucial to remain adaptable and follow the market's movement.
If you find this signal/analysis meaningful, kindly like and share it.
Thank you for your support~
Sharing this with love!
HMT v2.0:
- Major update to the Momentum indicator
- Reduced false signals from inaccurate momentum detection
- New screener with improved accuracy and fewer signals
HMT v3.0:
- Added liquidity factor to enhance trend continuation
- Improved potential for momentum-based plays
- Increased winning probability by reducing entries during peaks
HMT v3.1:
- Enhanced entry confirmation for improved reward-to-risk ratios
HMT v4.0:
- Incorporated buying and selling pressure in lower timeframes to enhance the probability of trending moves while optimizing entry timing and scaling
HMT v4.1:
- Enhanced take-profit (TP) target by incorporating market structure analysis
HMT v5 :
Date: 23/01/2025
- Refined wave analysis for trending conditions
- Incorporated lower timeframe (LTF) momentum to strengthen trend reliability
- Re-aligned and re-balanced entry conditions for improved accuracy
HMT v6 :
Date : 15/02/2025
- Integrated strong accumulation activity into in-depth wave analysis
HMT v7 :
Date : 20/03/2025
- Refined wave analysis along with accumulation and market sentiment
HMT v8 :
Date : 16/04/2025
- Fully restructured strategy logic
HMT v8.1 :
Date : 18/04/2025
- Refined Take Profit (TP) logic to be more conservative for improved win consistency

XVGUSDT Forming Bullish PennantXVGUSDT is currently showcasing a bullish pennant formation—a continuation pattern that typically signals the resumption of a strong uptrend. This pattern forms after a sharp upward move, followed by a period of consolidation, which is now evident in XVG’s price action. With the pennant nearing its breakout point and volume starting to pick up, the probability of an upward breakout is increasing significantly.
This setup often draws the attention of traders and investors, especially when paired with rising volume and solid project fundamentals. The consolidation within the pennant suggests accumulation, while the narrowing structure indicates that a volatility expansion may be imminent. If price breaks above the pennant resistance with confirmation from volume, XVG could realistically achieve a 40% to 50% move in the short to medium term.
Market sentiment around XVG is improving, as it's regaining attention due to increasing on-chain activity and renewed interest from long-term holders. The bullish pennant, when forming in a broader market recovery or bullish environment, can act as a strong springboard for price. Traders looking for technical breakouts are already watching this pair for a potential entry setup.
With investor confidence growing and XVG forming a powerful bullish pattern, this crypto pair holds strong upside potential. Keep a close eye on the breakout level, as a decisive move above it could mark the beginning of a significant rally.
✅ Show your support by hitting the like button and
✅ Leaving a comment below! (What is You opinion about this Coin)
Your feedback and engagement keep me inspired to share more insightful market analysis with you!
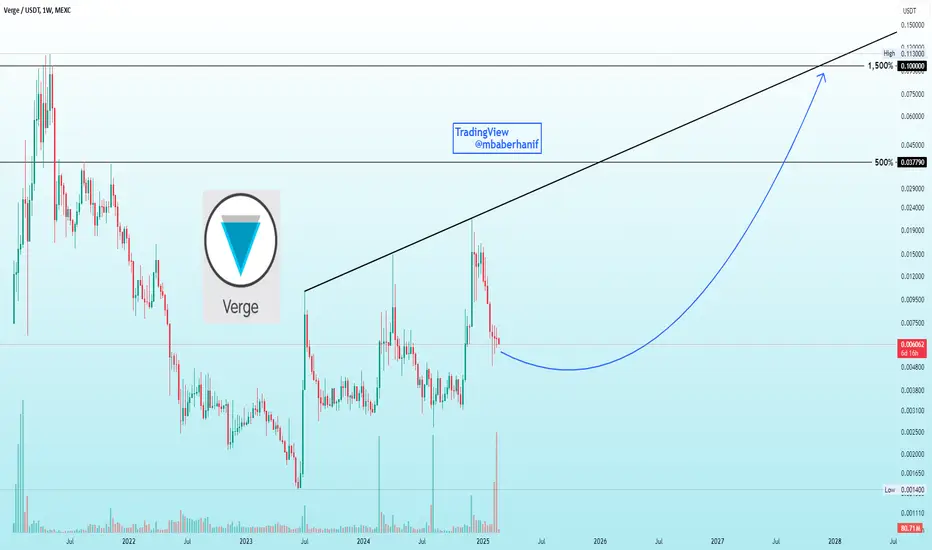
XVG | Will this coin skyrocket 500% to 1,500%?Hey everyone! If you missed OM Coin, which saw more then 36,500% increase in value over the course of a year – trading at $0.025 in December 2023 and recently reaching a high of around $9.17- this is an example of such huge gains. Some people thought it was impossible in 2023, but it already happened in 2025. With altcoin season ahead, I’m considering a potential 1,500% gain in XVG Coin, which seems possible since its previous high was $0.113 in May 2021. Such gains could be achievable in 2025.
This is not a financial advice, just my thoughts. I recommend doing your own research before making any investment decisions. Feel Free to share your ideas in the comments below. Thanks!
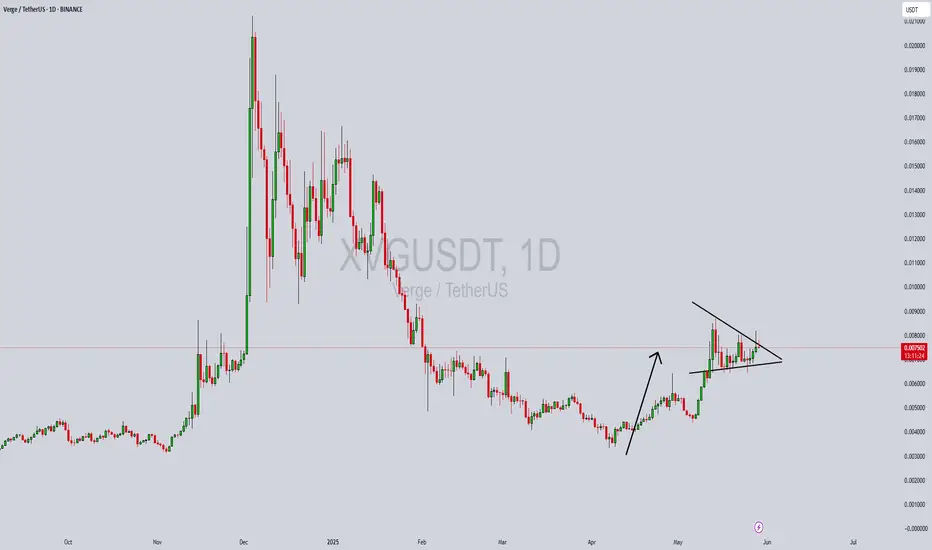
XVG/USDT breakout alert
XVG/USDT breakout alert
XVG has successfully broken out of the symmetrical triangle pattern, indicating a potential bullish continuation. Symmetrical triangles often signal consolidation before a breakout, and in this case, the breakout is to the upside, which is typically a bullish sign.
As long as XVG holds above the breakout level and gains volume support, further upward movement can be expected. However, if the price falls back into the triangle range, it may turn out to be a fakeout, so caution is advised.
Key levels to watch:
* Breakout confirmation zone
* Previous resistance now acting as support
* Volume surge to confirm strength
Stay alert and watch the price action closely.

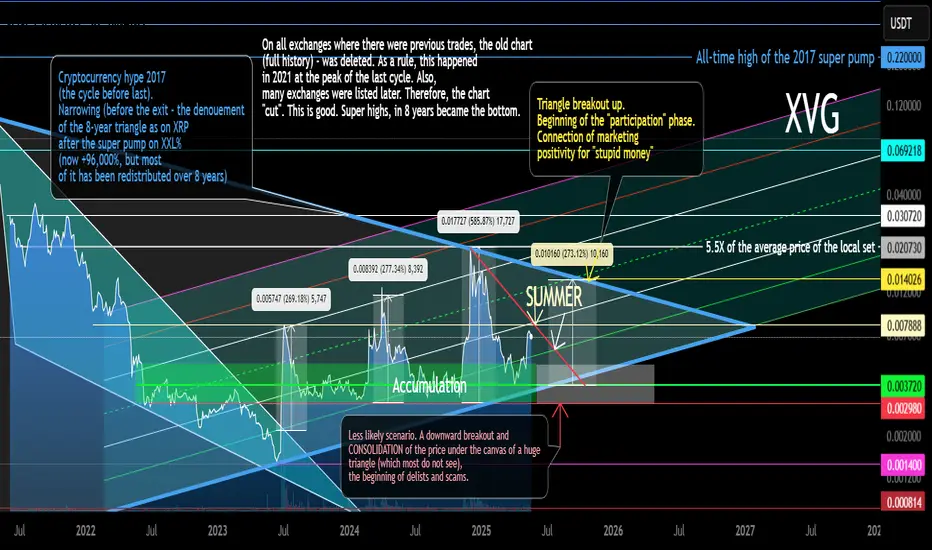
XVG Secondary Trend (Part) Triangle Resolution 8 years 05 2025Logarithm. Time frame 3 days. Linear instead of candlestick specifically for clarity. This is the longest chart history on tradingview that could be found. It does not display everything as is. Where this cryptocurrency was previously traded, the exchanges deleted the entire trading history. Listing on new exchanges does not display the whole picture. I described and showed everything on the chart. More in the channel, screenshots and comparison with XRP, here the site does not provide an opportunity to make such a comparison, as there are simply no charts of such history.
Verge (XVG) like XRP identical chart of the main trend, and the same 8-year triangle after the pumping of 2017. The only difference is that XRP came out of its triangle half a year ago, in alt season #2 of this cycle, and this cryptocurrency is still in the canvas of its triangle. But the price is gradually being driven into a corner. In alt season #3, most likely, the denouement of this story lasting 8 years will occur. More up than down (at the beginning).
Verge (XVG), like XRP, is an asset of the super pump of 2017 and the price retention is -96-98% from the super pump by hundreds of thousands of percent (I am not mistaken exactly so), which forms a huge triangle on XXX (8 years). This is all inherent in the assets of the hype of 2017: XVG XRP NEM XLM ZEC XMR DASH LTC and so on ... Some of them, over the past 2 years, have become on the path of hype (XRP XLM), and some on the path of scam (I do not want to make anti-advertisement).
Most likely, everything will repeat on XVG, as on XRP, but only at the right time, in the final alt season of this cycle. "XVG captains" do not have as much money and a powerful state behind them as XRP, to go against the market and the general trend, therefore, they need the market hype to distribute "a little higher". And so with most of these altcoins. Do not forget to get rid of them on the pump. Remember, the more down-to-earth goals, the more likely you are to earn over the long term. Observe risk and money management.
Remember, there is a big alt season ahead, provided that you are an adequate person and your goals are appropriate.
XVG/USDTKey Level Zone: 0.006390 - 0.006580
HMT v8.1 detected. The setup looks promising, supported by a previous upward/downward trend with increasing volume and momentum, presenting an excellent reward-to-risk opportunity.
HMT (High Momentum Trending):
HMT is based on trend, momentum, volume, and market structure across multiple timeframes. It highlights setups with strong potential for upward movement and higher rewards.
Whenever I spot a signal for my own trading, I’ll share it. Please note that conducting a comprehensive analysis on a single timeframe chart can be quite challenging and sometimes confusing. I appreciate your understanding of the effort involved.
Important Note :
Role of Key Levels:
- These zones are critical for analyzing price trends. If the key level zone holds, the price may continue trending in the expected direction. However, momentum may increase or decrease based on subsequent patterns.
- Breakouts: If the key level zone breaks, it signals a stop-out. For reversal traders, this presents an opportunity to consider switching direction, as the price often retests these zones, which may act as strong support-turned-resistance (or vice versa).
My Trading Rules
Risk Management
- Maximum risk per trade: 2.5%.
- Leverage: 5x.
Exit Strategy
Profit-Taking:
- Sell at least 70% on the 3rd wave up (LTF Wave 5).
- Typically, sell 50% during a high-volume spike.
- Adjust stop-loss to breakeven once the trade achieves a 1.5:1 reward-to-risk ratio.
- If the market shows signs of losing momentum or divergence, ill will exit at breakeven.
The market is highly dynamic and constantly changing. HMT signals and target profit (TP) levels are based on the current price and movement, but market conditions can shift instantly, so it is crucial to remain adaptable and follow the market's movement.
If you find this signal/analysis meaningful, kindly like and share it.
Thank you for your support~
Sharing this with love!
HMT v2.0:
- Major update to the Momentum indicator
- Reduced false signals from inaccurate momentum detection
- New screener with improved accuracy and fewer signals
HMT v3.0:
- Added liquidity factor to enhance trend continuation
- Improved potential for momentum-based plays
- Increased winning probability by reducing entries during peaks
HMT v3.1:
- Enhanced entry confirmation for improved reward-to-risk ratios
HMT v4.0:
- Incorporated buying and selling pressure in lower timeframes to enhance the probability of trending moves while optimizing entry timing and scaling
HMT v4.1:
- Enhanced take-profit (TP) target by incorporating market structure analysis
HMT v5 :
Date: 23/01/2025
- Refined wave analysis for trending conditions
- Incorporated lower timeframe (LTF) momentum to strengthen trend reliability
- Re-aligned and re-balanced entry conditions for improved accuracy
HMT v6 :
Date : 15/02/2025
- Integrated strong accumulation activity into in-depth wave analysis
HMT v7 :
Date : 20/03/2025
- Refined wave analysis along with accumulation and market sentiment
HMT v8 :
Date : 16/04/2025
- Fully restructured strategy logic
HMT v8.1 :
Date : 18/04/2025
- Refined Take Profit (TP) logic to be more conservative for improved win consistency

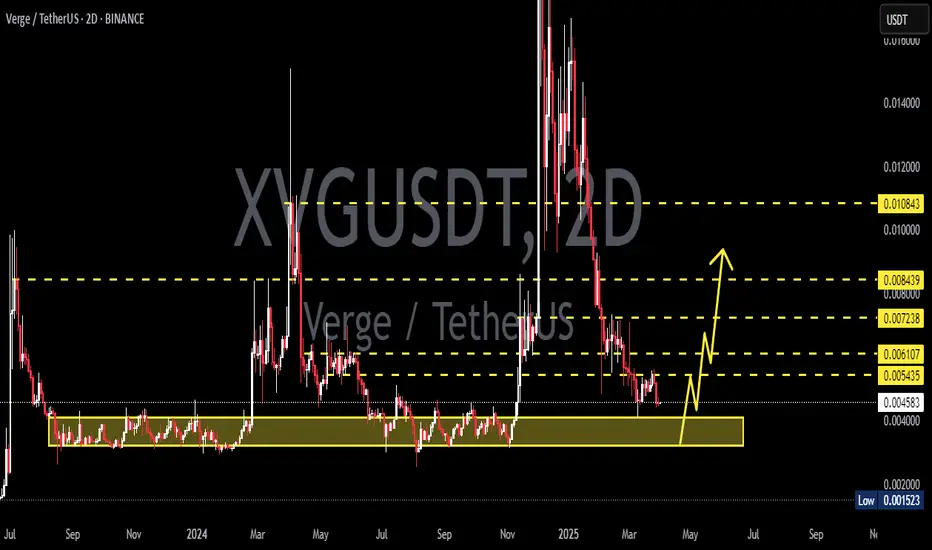
#XVG — Third catch from the same zone! 5-2025XVG is hovering near i t $0.0049. A hold above this could lead to potential targets at $0.008 and $0.012. Our last two trades in XVG delivered around +250% / 350% profits, so it's worth keeping a close watch. The main support to monitor is $0.0029.
2-2024
9-2024
When we recommend adding a coin to your watchlist, it's typically due to forming a pattern, nearing a historical bottom, or approaching a strong support level. It may also show increased trading volume, reversal candles, or be in an accumulation stage. While we haven't observed a bullish reaction yet, we advise monitoring it until an optimal entry point emerges.
PS:
We avoid trading coins associated with gambling, prostitution, human trafficking, etc.
Note:
This is not financial advice but an analysis of coin movements. Conduct your own research and practice risk management before making any investment decisions. Remember, the cryptocurrency market carries significant volatility and risks.
Best wishes to all,
we ask Allah reconcile and repay.

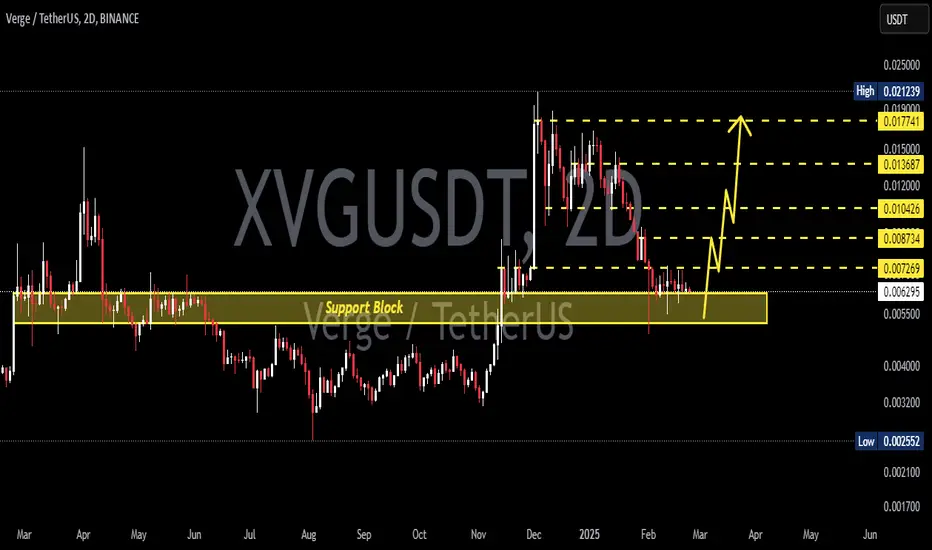
XVGUSDT 2DXVG ~ 2D Analysis
#XVG Buy gradually from here with a short -term target of at least 15%+. This is the previous accumulation area.
XVGUSDT 2DXVG ~ 2D Analysis
#XVG Support blocks that you might be able to consider to start buying back from here. with a minimum target of 15%+
Verge: Highest Volume EverOn the 19th of February XVGUSDT produced the highest volume ever on the daily timeframe.
See chart below:
This occurrence can signal the start of a new market phase.
Good afternoon my fellow trader....
Here we can see a consolidation channel that is more than two years long. Each time this channel is violated it happens on the upper boundary, resistance, support remains unchallenged as Verge has been producing long-term higher lows.
These are bullish signals. Now we have a very strong weekly volume bar after a mild corrective phase. We are looking at the start of a new bullish market phase.
This is just a friendly reminder. Verge (XVGUSDT) is about to blow-up.
Thank you for reading.
Namaste.

XVG - on the "VERGE" of breaking out!Hello TradingView Family / Fellow Traders. This is Richard, also known as theSignalyst.
📈 XVG has been in a correction phase trading within the falling blue channels.
🏹As XVG approaches the lower bound of the channels, which lines up perfectly with the demand zone marked in red, it would be an attractive zone (at least for me) to look for longs.
🏹On the other hand, for the bulls to take over long-term, a break above the last major high marked in blue around $0.015 is needed.
For now, we wait! ⏱️
📚 Always follow your trading plan regarding entry, risk management, and trade management.
Good luck!
All Strategies Are Good; If Managed Properly!
~Rich

Xvg : verge : is on the verge of breaking higherXvg has formed a nice channel to the downside.
I think she will pump hard.
Time for her to get back at 10 cents .
Soon all time highs , it is the year of OGs.
She will follow xrp.

#XVG/USDT Analysis 📈 #XVG/USDT Analysis 📈
SGX:XVG is holding strong at the 4H bullish Order Block and showing potential for a long entry.
📌 Resistance: PWH $0.014538

XVG/USDTKey Level Zone: 0.013030 - 0.013460
HMT v4.1 detected. The setup looks promising, supported by a previous upward/downward trend with increasing volume and momentum, presenting an excellent reward-to-risk opportunity.
HMT (High Momentum Trending):
HMT is based on trend, momentum, volume, and market structure across multiple timeframes. It highlights setups with strong potential for upward movement and higher rewards.
Whenever I spot a signal for my own trading, I’ll share it. Please note that conducting a comprehensive analysis on a single timeframe chart can be quite challenging and sometimes confusing. I appreciate your understanding of the effort involved.
Important Note :
Role of Key Levels:
- These zones are critical for analyzing price trends. If the key level zone holds, the price may continue trending in the expected direction. However, momentum may increase or decrease based on subsequent patterns.
- Breakouts: If the key level zone breaks, it signals a stop-out. For reversal traders, this presents an opportunity to consider switching direction, as the price often retests these zones, which may act as strong support-turned-resistance (or vice versa).
My Trading Rules
Risk Management
- Maximum risk per trade: 2.5%.
- Leverage: 5x.
Exit Strategy
Profit-Taking:
- Sell at least 70% on the 3rd wave up (LTF Wave 5).
- Typically, sell 50% during a high-volume spike.
- Adjust stop-loss to breakeven once the trade achieves a 1.5:1 reward-to-risk ratio.
- If the market shows signs of losing momentum or divergence, ill will exit at breakeven.
The market is highly dynamic and constantly changing. HMT signals and target profit (TP) levels are based on the current price and movement, but market conditions can shift instantly, so it is crucial to remain adaptable and follow the market's movement.
If you find this signal/analysis meaningful, kindly like and share it.
Thank you for your support~
Sharing this with love!
HMT v2.0:
- Major update to the Momentum indicator
- Reduced false signals from inaccurate momentum detection
- New screener with improved accuracy and fewer signals
HMT v3.0:
- Added liquidity factor to enhance trend continuation
- Improved potential for momentum-based plays
- Increased winning probability by reducing entries during peaks
HMT v3.1:
- Enhanced entry confirmation for improved reward-to-risk ratios
HMT v4.0:
- Incorporated buying and selling pressure in lower timeframes to enhance the probability of trending moves while optimizing entry timing and scaling
HMT v4.1:
- Enhanced take-profit (TP) target by incorporating market structure analysis

Prepare to BUY Spot XVGUSDT (D1 Cycle)
🌟 XVGUSDT is entering a new D1 cycle – A great opportunity for short-to-mid-term gains! 🌟
🌍 Market Overview:
XVGUSDT is showing strong bullish potential on the D1 timeframe. This creates a strategic entry to capitalize on the upward movement once the bottom is confirmed.
📊 Trade Plan:
📌 Entry Point:
Around $0.0088 or near that level after forming a clear bottom on D1.
With Indicator: Use your trusted setup to confirm the entry for optimal precision.
🎯 Target:
100% gain from the bottom – Targeting a significant profit based on the market's performance.
⏳ Hold Time:
2–3 weeks – Perfectly aligned with the projected D1 cycle.
💡 Note:
Combine the suggested price point with your indicator setup to ensure precise entry. Stay flexible and adjust your strategy as the market evolves.
🔥 XVGUSDT is gearing up – Don’t miss this short-to-mid-term trading opportunity! 🔥

*XVG* IS AWESOMEhello friends
This token has been modified after hitting a higher ceiling.
Now we can buy step by step with capital and risk management and move to the goals we specified.
*Trade safely with us*
