formed a bearish head and shouldersXVS has formed a bearish head and shoulders pattern and has already broken below the blue neckline. This breakdown suggests a potential move down to the green line level.
📈 Technical Overview:
Pattern: Bearish Head and Shoulders
Neckline: Blue level, already broken.
🎯 Target: Green line level upon confirmation of the breakdown.
XVSUSDT trade ideas

XVSUSDT | Sales Are Slowing, Resistance Zones AheadXVSUSDT is struggling to find sustained buying pressure. Over the past 24 hours, trading volume sits around 1.9 million USDT, yet the market buy ratio is –66.83 percent, showing sellers are dominating and buyers have largely stepped back
🔴 Resistance Levels to Respect
The red boxes on the chart mark strong resistance zones. Every prior test of these areas has triggered a sell‑off, and in the absence of fresh buying momentum, they’re likely to hold again.
🛠 How to Trade This Setup
Short at Resistance
• Wait for price to rally into a red box.
• Confirm with a clear lower‑time‑frame breakdown (e.g. on a 5‑ or 15‑minute chart) plus a negative CDV divergence or rising sell volume.
• Enter shorts only when these conditions align.
Stay Flexible
• I won’t force shorts if XVSUSDT breaks above a red box without giving a valid downward break on the low timeframe.
• If it clears resistance with strong volume and retests the former red box as support, I’ll shift bias and consider longs.
🎯 Key Takeaway
Buyers are taking a breather, and without new demand, resistance levels become even tougher to crack. By trading with confirmation and respecting these red‑box zones, you align yourself with the prevailing market flow rather than chasing fading momentum.
📌I keep my charts clean and simple because I believe clarity leads to better decisions.
📌My approach is built on years of experience and a solid track record. I don’t claim to know it all but I’m confident in my ability to spot high-probability setups.
📌If you would like to learn how to use the heatmap, cumulative volume delta and volume footprint techniques that I use below to determine very accurate demand regions, you can send me a private message. I help anyone who wants it completely free of charge.
🔑I have a long list of my proven technique below:
🎯 ZENUSDT.P: Patience & Profitability | %230 Reaction from the Sniper Entry
🐶 DOGEUSDT.P: Next Move
🎨 RENDERUSDT.P: Opportunity of the Month
💎 ETHUSDT.P: Where to Retrace
🟢 BNBUSDT.P: Potential Surge
📊 BTC Dominance: Reaction Zone
🌊 WAVESUSDT.P: Demand Zone Potential
🟣 UNIUSDT.P: Long-Term Trade
🔵 XRPUSDT.P: Entry Zones
🔗 LINKUSDT.P: Follow The River
📈 BTCUSDT.P: Two Key Demand Zones
🟩 POLUSDT: Bullish Momentum
🌟 PENDLEUSDT.P: Where Opportunity Meets Precision
🔥 BTCUSDT.P: Liquidation of Highly Leveraged Longs
🌊 SOLUSDT.P: SOL's Dip - Your Opportunity
🐸 1000PEPEUSDT.P: Prime Bounce Zone Unlocked
🚀 ETHUSDT.P: Set to Explode - Don't Miss This Game Changer
🤖 IQUSDT: Smart Plan
⚡️ PONDUSDT: A Trade Not Taken Is Better Than a Losing One
💼 STMXUSDT: 2 Buying Areas
🐢 TURBOUSDT: Buy Zones and Buyer Presence
🌍 ICPUSDT.P: Massive Upside Potential | Check the Trade Update For Seeing Results
🟠 IDEXUSDT: Spot Buy Area | %26 Profit if You Trade with MSB
📌 USUALUSDT: Buyers Are Active + %70 Profit in Total
🌟 FORTHUSDT: Sniper Entry +%26 Reaction
🐳 QKCUSDT: Sniper Entry +%57 Reaction
📊 BTC.D: Retest of Key Area Highly Likely
📊 XNOUSDT %80 Reaction with a Simple Blue Box!
📊 BELUSDT Amazing %120 Reaction!
I stopped adding to the list because it's kinda tiring to add 5-10 charts in every move but you can check my profile and see that it goes on..

TradeCityPro | XVS: Tracking Its Trajectory in the DeFi Space👋 Welcome to TradeCity Pro!
In this analysis, I want to review the XVS coin, which you requested in the comments. This project is one of the DeFi projects with a market cap of $72 million, ranking 346th on CoinMarketCap.
📅 Weekly Timeframe
In the weekly timeframe, as you can observe, the price started a downtrend after reaching a peak in 2021, and this trend is still ongoing.
✨ Currently, there is a consolidation box from 3.34 to 17.61, and the price has been fluctuating between these two areas for almost three years.
✔️ In the previous weekly candle, the support at 5.45 was broken, and now the price is moving towards the support at 3.34. This support is very crucial, and its breach could trigger another sharp drop.
🔽 There is also a descending trend line that the price has touched twice, and after being rejected by this trend, a significant amount of selling volume entered the market and induced a momentum that led to the breach of the 3.34 support.
📈 For XVS to turn bullish, the only trigger we have for now is the break of the trend line and the activation of its trigger. The trend line trigger is currently at 9.09. However, if the price creates a new structure, we might confirm a bullish turn sooner.
🛒 For buying in spot, the first trigger is the break of 9.09, which is considered a risky trigger in this timeframe. The main trigger is after 17.61.
⚡️ However, as I have mentioned in recent Bitcoin analyses, altcoin triggers and even the Total2 in spot don't currently hold much significance. For buying altcoins in spot, we should wait until Bitcoin dominance turns bearish.
📅 Daily Timeframe
Let's move to the daily timeframe to observe the details of the price movement more closely.
🧩 In this timeframe, we have a curved trend line that the price has hit several times and fallen.
⭐ Currently, after breaking 4.95, we can apply a Fibonacci Extension to find potential support areas. The price has reached the 0.618 level and has tested it. This area might be able to prevent further price falls. Otherwise, the next supports will be at the 0.786 and 1 Fibonacci levels, with the 1 area overlapping with the 3.34 support.
💥 The RSI oscillator is close to oversell and if this oscillator break the 30 level,it will support the bearish movement.
🔼 For buying or a long position, a suitable trigger is the 6.25 area, which is both a significant support and the last peak formed after breaking the 4.95 floor. The main trigger for the start of the primary bullish trend will be at 11.79.
📝 Final Thoughts
This analysis reflects our opinions and is not financial advice.
Share your thoughts in the comments, and don’t forget to share this analysis with your friends! ❤️

XVSUSDT – The Market is Talking… Are You Listening?Most traders lose because they react emotionally. Not us. We plan, we execute, we win. This is the difference between gambling and trading. If you're still guessing, you're already behind.
📌 Key Insights:
🔴 Red Box = Major Resistance Zone – This is where the market makers decide who wins and who loses. Do you want to be on the right side or the losing side?
📉 LTF Confirmations Are Everything – Without CDV alignment, volume profile support, and clear structural breaks, you are blind in the market. This is why 95% fail, and why we don’t.
🎯 Discipline Wins. Always. – No FOMO, no random entries. If resistance holds, we short with precision. If it breaks with volume and a clean retest, we go long.
💡 This is why you NEED to follow me. Most traders guess and hope—I show you the roadmap before it even happens. If you’re serious about winning, stop trading alone. Follow. Watch. Execute. Success leaves clues. I’m giving them to you.
✅I keep my charts clean and simple because I believe clarity leads to better decisions.
✅My approach is built on years of experience and a solid track record. I don’t claim to know it all but I’m confident in my ability to spot high-probability setups.
✅If you would like to learn how to use the heatmap, cumulative volume delta and volume footprint techniques that I use below to determine very accurate demand regions, you can send me a private message. I help anyone who wants it completely free of charge.
🔑I have a long list of my proven technique below:
🎯 ZENUSDT.P: Patience & Profitability | %230 Reaction from the Sniper Entry
🐶 DOGEUSDT.P: Next Move
🎨 RENDERUSDT.P: Opportunity of the Month
💎 ETHUSDT.P: Where to Retrace
🟢 BNBUSDT.P: Potential Surge
📊 BTC Dominance: Reaction Zone
🌊 WAVESUSDT.P: Demand Zone Potential
🟣 UNIUSDT.P: Long-Term Trade
🔵 XRPUSDT.P: Entry Zones
🔗 LINKUSDT.P: Follow The River
📈 BTCUSDT.P: Two Key Demand Zones
🟩 POLUSDT: Bullish Momentum
🌟 PENDLEUSDT.P: Where Opportunity Meets Precision
🔥 BTCUSDT.P: Liquidation of Highly Leveraged Longs
🌊 SOLUSDT.P: SOL's Dip - Your Opportunity
🐸 1000PEPEUSDT.P: Prime Bounce Zone Unlocked
🚀 ETHUSDT.P: Set to Explode - Don't Miss This Game Changer
🤖 IQUSDT: Smart Plan
⚡️ PONDUSDT: A Trade Not Taken Is Better Than a Losing One
💼 STMXUSDT: 2 Buying Areas
🐢 TURBOUSDT: Buy Zones and Buyer Presence
🌍 ICPUSDT.P: Massive Upside Potential | Check the Trade Update For Seeing Results
🟠 IDEXUSDT: Spot Buy Area | %26 Profit if You Trade with MSB
📌 USUALUSDT: Buyers Are Active + %70 Profit in Total
🌟 FORTHUSDT: Sniper Entry +%26 Reaction
🐳 QKCUSDT: Sniper Entry +%57 Reaction
📊 BTC.D: Retest of Key Area Highly Likely
📊 XNOUSDT %80 Reaction with a Simple Blue Box!
📊 BELUSDT Amazing %120 Reaction!
I stopped adding to the list because it's kinda tiring to add 5-10 charts in every move but you can check my profile and see that it goes on..

FireHoseReel " XVSUSDTWelcome to FireHoseReel ! ❤️
Today we're gonna dive into the XVS coin and break down what the project is all about. Stick with us
This coin has shot up 40% after breaking its upward channel, and then it had a solid climb but pulled back 50% because of profit-taking and heavy selling. It created a key demand zone, and a lot of market makers, retail traders, and exchanges have been buying in the $4.70 to $5.30 range. The next targets for this coin could be $11.50 and $12, and we could see a price increase of up to 90% !
XVSUSDT is the trading pair for the Venus token (XVS) against Tether (USDT). Venus is a decentralized finance (DeFi) protocol built on the Binance Smart Chain (BSC) that allows users to borrow and lend cryptocurrencies.
With Venus, users can supply assets to the platform to earn interest or take out loans using their crypto as collateral. The XVS token serves as the governance token for the Venus protocol, allowing holders to participate in decision-making processes related to the platform’s development and operations.
Hope you guys found these analyses useful! Wishing you all the best 🔥 Don't forget about money management and risk management. Love you all, friends ❤️

#XVS/USDT#XVS
The price is moving within a descending channel on the 1-hour frame, adhering well to it, and is heading for a strong breakout and retest.
We are experiencing a rebound from the lower boundary of the descending channel, which is support at 5.60.
We are experiencing a downtrend on the RSI indicator that is about to be broken and retested, supporting the upward trend.
We are looking for stability above the 100 Moving Average.
Entry price: 5.70
First target: 5.86
Second target: 6.03
Third target: 6.32

#XVS/USDT#XVS
The price is moving in a descending channel on the 1-hour frame and is expected to continue upwards
We have a trend to stabilize above the moving average 100 again
We have a descending trend on the RSI indicator that supports the rise by breaking it upwards
We have a support area at the lower limit of the channel at a price of 7.00
Entry price 7.31
First target 7.75
Second target 8.09
Third target 8.51

Long Entry Signal for XVS/USDT - Trading System Confirmation
Long entry signal for XVS/USDT confirmed by the trading system
Based on our custom trading system rules, we had an initial long entry signal for XVS/USDT on February 12th, and the price has remained steady since then. Given that the system's conditions for a long position are still met, we can consider entering a long position today:
MLR Crosses SMA: The Moving Regression Line (MLR) in blue has crossed above the Simple Moving Average (SMA) in pink, indicating a shift towards a bullish trend, which was confirmed on February 12th.
MLR Crosses BB Center Line: The MLR has also crossed over the Bollinger Bands Center Line in orange, further confirming the bullish momentum at the time of the initial signal.
PSAR Flips: The Parabolic SAR (PSAR), shown by black dots, has flipped to bull, signaling a bullish trend as it follows the MLR, which has continued to be the case.
Price Above 200-period MA: The current price is above the 200-period Moving Average in red, confirming a long-term bullish trend that persists.
Entry Strategy:
Action: Enter a long position on XVS/USDT today, given the sustained conditions from the initial signal.
Risk Management:
Trailing Stop: Set your trailing stop at the current PSAR level, which will adjust dynamically with price movements to protect your position.
Standard Exit Strategy:
Exit: Continue to monitor for when the MLR crosses back below the SMA. This crossover will signal a potential end to the bullish trend and an opportunity to exit the position.
This signal presents a potential trading opportunity according to our system's parameters, especially since the initial conditions have remained favorable. Remember, always consider additional analysis and risk management practices before making trading decisions.
That is it
Disclaimer: This idea is for educational purposes only and should not be considered financial advice. Always do your own research or consult with a financial advisor before trading.

Good moment for Buy XVSGood moment for Buy XVS. The big flat channel and we are tested the middle line. Good risk reward ration with small top. The goal to take up level and check on the broke. Will see...

Univers Of Signals| XVS : Navigating Market Dynamics👋 Welcome to Univers Of Signals .
In this analysis, I want to review the XVS coin for you, as requested in the comments. So, I decided to analyze this coin in weekly, daily, and four-hour timeframes.
🔍 The Venus project is one of the DeFi projects active in Lend and Borrow, boasting a TVL of $1.88 billion, ranking it among the top platforms on the Binance network. It's one of the most reputable projects on this network. The project's coin, named XVS, offers additional capabilities on this platform through staking and holding.
📅 Weekly Timeframe
In the weekly timeframe, we see a very large range box starting from a floor of 3.34 and a ceiling at 17.61. XVS is considered a heavy coin due to a lot of staking and a significant number of whales and holders. This means it experiences fewer fluctuations because it has a large amount of money invested in it. Despite Bitcoin and other coins that are near or even above their previous ATHs, this coin is still in its consolidation box.
✨ Another very important support is at 5.45, which is crucial and the price has hit it several times. The market volume started to decrease after reaching the resistance at 17.61 but has increased again in recent weeks. This shows that whales are moving back towards this coin, increasing both the inflow and outflow of money, and consequently, the 24-hour volume has also increased.
🚀 If the price can stabilize above 17.61, we can expect the start of an upward trend and the price could move towards higher targets. The targets for this coin are at 38.73 and 141 dollars. Given the market cap of 137 million dollars, if the project becomes one of the successful crypto projects and attracts more holders and whales, the targets I mentioned will be attainable and not far-fetched.
⚡️ Another important note in the chart is that the 5.45 support, as I mentioned, is crucial, and if it breaks and the RSI also drops below 38.36, the situation for this coin will be very grim. We can expect the price to even break below the floor of 3.34 and move towards newer lows.
📅 Daily Timeframe
As you can see in the daily timeframe, after breaking 7.99, the price moved down to 4.98, but we observed a V pattern in the price that caused it to move back above 7.99. Given the large volume of buying seen in the candles, it seems a significant upward momentum has entered the market, and I believe if the price can continue upwards and break the 11.85 area, we can expect the next bullish leg and even the appropriate momentum to break the 1.49 to finally start the upward trend of this coin in higher cycles.
🔽 On the other hand, if the price forms a lower ceiling relative to 11.85 and moves back towards 4.98, if this area breaks, the next support will be at 3.33. In the RSI, for a bullish position and to confirm the upward trend, breaking the 70 area can give us a suitable confirmation, but for a downward momentum, I currently don’t have a specific trigger and we need to wait for the site and market structure to form to see what trigger it gives us for the entry of downward momentum.
⏳ 4-Hour Timeframe
Let's go to the 4-hour timeframe to specify the futures triggers. As you can see, we can observe the last bullish leg of the price in this timeframe with more details.
📊 After being supported at 4.87 and moving upwards, the price reached 9.10. As you see above, a divergence in the RSI has occurred. Despite the price hitting two identical peaks at 9.10, the RSI has made a lower peak, which could indicate a divergence. The divergence trigger, which was the 50 area, was activated in yesterday’s candle, and we can expect to see the effect of this divergence in the market.
💥 However, keep in mind that in bullish trends with very high momentum, the presence of divergence is due to the mathematical calculations of the RSI and is completely natural. So until the price falls below the 7.69 area, we will not see the effect of the divergence on the price, and the divergence we see will simply be due to the formula and mathematical calculations of the RSI.
🧩 If the 7.69 area breaks, the price might make deeper corrections down to the 0.382 and 0.618 Fibonacci levels, which correspond to areas of 7 dollars and 6.12 dollars respectively. For a long position, our task is very clear and has a good trigger. If the 9.10 area breaks, we can open a long position towards the 11.85 target.
📝 Final Thoughts
This analysis reflects our opinions and is not financial advice.
Share your thoughts in the comments, and don’t forget to share this analysis with your friends! ❤️ .

TradeCityPro | XVS : Navigating Market Dynamics👋 Welcome to TradeCityPro!
In this analysis, I want to review the XVS coin for you, as requested in the comments. So, I decided to analyze this coin in weekly, daily, and four-hour timeframes.
🔍 The Venus project is one of the DeFi projects active in Lend and Borrow, boasting a TVL of $1.88 billion, ranking it among the top platforms on the Binance network. It's one of the most reputable projects on this network. The project's coin, named XVS, offers additional capabilities on this platform through staking and holding.
📅 Weekly Timeframe
In the weekly timeframe, we see a very large range box starting from a floor of 3.34 and a ceiling at 17.61. XVS is considered a heavy coin due to a lot of staking and a significant number of whales and holders. This means it experiences fewer fluctuations because it has a large amount of money invested in it. Despite Bitcoin and other coins that are near or even above their previous ATHs, this coin is still in its consolidation box.
✨ Another very important support is at 5.45, which is crucial and the price has hit it several times. The market volume started to decrease after reaching the resistance at 17.61 but has increased again in recent weeks. This shows that whales are moving back towards this coin, increasing both the inflow and outflow of money, and consequently, the 24-hour volume has also increased.
🚀 If the price can stabilize above 17.61, we can expect the start of an upward trend and the price could move towards higher targets. The targets for this coin are at 38.73 and 141 dollars. Given the market cap of 137 million dollars, if the project becomes one of the successful crypto projects and attracts more holders and whales, the targets I mentioned will be attainable and not far-fetched.
⚡️ Another important note in the chart is that the 5.45 support, as I mentioned, is crucial, and if it breaks and the RSI also drops below 38.36, the situation for this coin will be very grim. We can expect the price to even break below the floor of 3.34 and move towards newer lows.
📅 Daily Timeframe
As you can see in the daily timeframe, after breaking 7.99, the price moved down to 4.98, but we observed a V pattern in the price that caused it to move back above 7.99. Given the large volume of buying seen in the candles, it seems a significant upward momentum has entered the market, and I believe if the price can continue upwards and break the 11.85 area, we can expect the next bullish leg and even the appropriate momentum to break the 1.49 to finally start the upward trend of this coin in higher cycles.
🔽 On the other hand, if the price forms a lower ceiling relative to 11.85 and moves back towards 4.98, if this area breaks, the next support will be at 3.33. In the RSI, for a bullish position and to confirm the upward trend, breaking the 70 area can give us a suitable confirmation, but for a downward momentum, I currently don’t have a specific trigger and we need to wait for the site and market structure to form to see what trigger it gives us for the entry of downward momentum.
⏳ 4-Hour Timeframe
Let's go to the 4-hour timeframe to specify the futures triggers. As you can see, we can observe the last bullish leg of the price in this timeframe with more details.
📊 After being supported at 4.87 and moving upwards, the price reached 9.10. As you see above, a divergence in the RSI has occurred. Despite the price hitting two identical peaks at 9.10, the RSI has made a lower peak, which could indicate a divergence. The divergence trigger, which was the 50 area, was activated in yesterday’s candle, and we can expect to see the effect of this divergence in the market.
💥 However, keep in mind that in bullish trends with very high momentum, the presence of divergence is due to the mathematical calculations of the RSI and is completely natural. So until the price falls below the 7.69 area, we will not see the effect of the divergence on the price, and the divergence we see will simply be due to the formula and mathematical calculations of the RSI.
🧩 If the 7.69 area breaks, the price might make deeper corrections down to the 0.382 and 0.618 Fibonacci levels, which correspond to areas of 7 dollars and 6.12 dollars respectively. For a long position, our task is very clear and has a good trigger. If the 9.10 area breaks, we can open a long position towards the 11.85 target.
📝 Final Thoughts
This analysis reflects our opinions and is not financial advice.
Share your thoughts in the comments, and don’t forget to share this analysis with your friends! ❤️


XVS/USDTKey Level Zone: 5.600 - 5.680
HMT v5 detected. The setup looks promising, supported by a previous upward/downward trend with increasing volume and momentum, presenting an excellent reward-to-risk opportunity.
HMT (High Momentum Trending):
HMT is based on trend, momentum, volume, and market structure across multiple timeframes. It highlights setups with strong potential for upward movement and higher rewards.
Whenever I spot a signal for my own trading, I’ll share it. Please note that conducting a comprehensive analysis on a single timeframe chart can be quite challenging and sometimes confusing. I appreciate your understanding of the effort involved.
Important Note :
Role of Key Levels:
- These zones are critical for analyzing price trends. If the key level zone holds, the price may continue trending in the expected direction. However, momentum may increase or decrease based on subsequent patterns.
- Breakouts: If the key level zone breaks, it signals a stop-out. For reversal traders, this presents an opportunity to consider switching direction, as the price often retests these zones, which may act as strong support-turned-resistance (or vice versa).
My Trading Rules
Risk Management
- Maximum risk per trade: 2.5%.
- Leverage: 5x.
Exit Strategy
Profit-Taking:
- Sell at least 70% on the 3rd wave up (LTF Wave 5).
- Typically, sell 50% during a high-volume spike.
- Adjust stop-loss to breakeven once the trade achieves a 1.5:1 reward-to-risk ratio.
- If the market shows signs of losing momentum or divergence, ill will exit at breakeven.
The market is highly dynamic and constantly changing. HMT signals and target profit (TP) levels are based on the current price and movement, but market conditions can shift instantly, so it is crucial to remain adaptable and follow the market's movement.
If you find this signal/analysis meaningful, kindly like and share it.
Thank you for your support~
Sharing this with love!
HMT v2.0:
- Major update to the Momentum indicator
- Reduced false signals from inaccurate momentum detection
- New screener with improved accuracy and fewer signals
HMT v3.0:
- Added liquidity factor to enhance trend continuation
- Improved potential for momentum-based plays
- Increased winning probability by reducing entries during peaks
HMT v3.1:
- Enhanced entry confirmation for improved reward-to-risk ratios
HMT v4.0:
- Incorporated buying and selling pressure in lower timeframes to enhance the probability of trending moves while optimizing entry timing and scaling
HMT v4.1:
- Enhanced take-profit (TP) target by incorporating market structure analysis
HMT v5 :
Date: 23/01/2025
- Refined wave analysis for trending conditions
- Incorporated lower timeframe (LTF) momentum to strengthen trend reliability
- Re-aligned and re-balanced entry conditions for improved accuracy


TradeCityPro | XVSUSDT Possibility of a Long-Term Move Starting 👋 Welcome to TradeCityPro Channel!
Let’s analyze XVS, one of my favorite coins in the crypto and DeFi space, which operates in the LEND & Borrow sector on the BNB network, as we may work with it more extensively in the future.
🌐 Overview Bitcoin
Before analyzing today's altcoin, let’s start by reviewing Bitcoin on the 1-hour timeframe
Yesterday, I mentioned opening a long position with Bitcoin’s break of 97343 and even suggested using a stop-buy order. Today, following the news announcement, this resistance was broken aggressively, showing strong whale activity.
With this breakout, Bitcoin dominance has begun to drop, so it would have been more logical to place stop-buy orders on altcoins. If you haven’t done so yet, don’t worry! You can wait for the next confirmation by Bitcoin breaking 99485 to take action on your altcoins.
📊 Weekly Timeframe
In the weekly timeframe, XVS remains in a large range and has been moving slowly.
Recently, after faking a breakout above the range, it did not return to its bottom. In 2024, we haven’t revisited the 3.51 support level. Instead, we formed a higher low at 5.33, suggesting a potential shift.
For re-entry, you could consider buying above 12.94. Personally, I entered at the 5.33 breakout in late 2023 and will not make any new purchases at the moment. My stop-loss remains below 3.51.
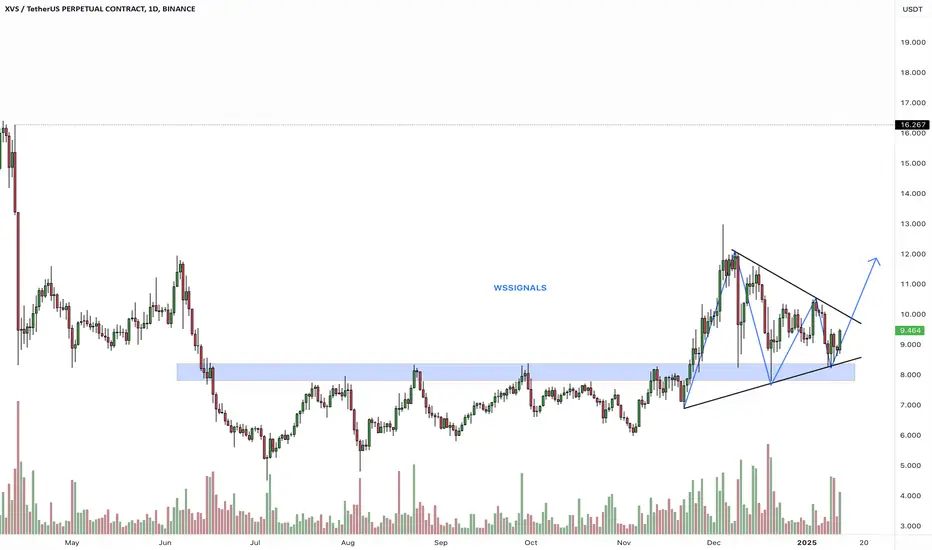
📈 Daily Timeframe
On the daily timeframe, after breaking 8.21 and exiting the daily range, XVS moved toward the 11.83 resistance, where it faced heavy rejection.
After that, lower highs were formed, leading to a descending triangle pattern with equal lows.
If the descending trendline breaks, we might see the uptrend resume with confirmation from momentum and volume. Otherwise, a break below the triangle’s base at 8.21 could lead to a correction toward 6.09, though this is less likely.
Risky Entry: You could buy now with the current daily candle, but ensure your stop-loss is below 6.09 , Safe Entry: Wait for a confirmed breakout above 11.83, aiming for a target of 17.58.
⏱ 4-Hour Timeframe
Finally, in the 4-hour timeframe, after briefly wicking to the 7.73 support, XVS has bounced back into its range and is nearing the 9.47 resistance.
📈 Long Position Trigger
wait for 9.47 to break with clear momentum and volume or wait for the formation of higher highs and higher lows.
📉 Short Position Trigger
monitor for signs of rejection. If 9.47 turns into a fake-out, a short position below 8.52 could be considered.
📝 Final Thoughts
Stay calm, trade wisely, and let's capture the market's best opportunities!
This analysis reflects our opinions and is not financial advice.
Share your thoughts in the comments, and don’t forget to share this analysis with your friends! ❤️

XVS forming Bullish Pennant on 1D timeframe! Keep your eye on this one. In the case of a breakout, this could easily reach $16
#XVS/USDT breaks the diagonal trendline on the 4H TF! 💡 Wait for a successful retest to confirm a long entry.
Key Levels:
🔼 Resistance: PMH $12.895
🔽 Support: PWL $8.852

XVSUSDT | High PotentialThe blue boxes on the XVS chart represent strong demand zones, especially when analyzed on higher time frames (HTF).
While price may dip lower within these zones, they offer potential for quick reactions and short-term opportunities, making them ideal for scalping or intraday trades. For HTF traders, deeper entries can be targeted at lower levels for more substantial long positions.
Balancing between immediate reactions and a long-term perspective allows flexibility in capturing both short-term gains and larger moves within the broader trend.
Spot buys will be a safer choice here.
I keep my charts clean and simple because I believe clarity leads to better decisions.
My approach is built on years of experience and a solid track record. I don’t claim to know it all, but I’m confident in my ability to spot high-probability setups.
My Previous Analysis
🐶 DOGEUSDT.P: Next Move
🎨 RENDERUSDT.P: Opportunity of the Month
💎 ETHUSDT.P: Where to Retrace
🟢 BNBUSDT.P: Potential Surge
📊 BTC Dominance: Reaction Zone
🌊 WAVESUSDT.P: Demand Zone Potential
🟣 UNIUSDT.P: Long-Term Trade
🔵 XRPUSDT.P: Entry Zones
🔗 LINKUSDT.P: Follow The River
📈 BTCUSDT.P: Two Key Demand Zones
🟩 POLUSDT: Bullish Momentum
🌟 PENDLEUSDT: Where Opportunity Meets Precision
🔥 BTCUSDT.P: Liquidation of Highly Leveraged Longs
🌊 SOLUSDT.P: SOL's Dip - Your Opportunity
🐸 1000PEPEUSDT.P: Prime Bounce Zone Unlocked
🚀 ETHUSDT.P: Set to Explode - Don't Miss This Game Changer
🤖 IQUSDT: Smart Plan
⚡️ PONDUSDT: A Trade Not Taken Is Better Than a Losing One
💼 STMXUSDT: 2 Buying Areas


XVSUSDT: Eyeing a Breakout with Strong VolumeXVSUSDT is showing positive volume momentum and increasing buyer strength. The current price action is approaching a critical resistance level, and a breakout could pave the way for a significant move.
Key Levels to Watch:
Resistance Break: A confirmed break above the resistance may signal the start of a bullish trend.
Stop Level: My stop-loss is set at $11.1, ensuring risk management in case of a pullback.
Why XVS Stands Out:
The combination of rising volume and buyer power suggests strong accumulation, making XVS a promising candidate for a potential breakout.
Let’s see how this unfolds—patience and discipline remain key!
I keep my charts clean and simple because I believe clarity leads to better decisions.
My approach is built on years of experience and a solid track record. I don’t claim to know it all, but I’m confident in my ability to spot high-probability setups.
My Previous Analysis
🐶 DOGEUSDT.P: Next Move
🎨 RENDERUSDT.P: Opportunity of the Month
💎 ETHUSDT.P: Where to Retrace
🟢 BNBUSDT.P: Potential Surge
📊 BTC Dominance: Reaction Zone
🌊 WAVESUSDT.P: Demand Zone Potential
🟣 UNIUSDT.P: Long-Term Trade
🔵 XRPUSDT.P: Entry Zones
🔗 LINKUSDT.P: Follow The River
📈 BTCUSDT.P: Two Key Demand Zones
🟩 POLUSDT: Bullish Momentum
🌟 PENDLEUSDT: Where Opportunity Meets Precision
🔥 BTCUSDT.P: Liquidation of Highly Leveraged Longs
🌊 SOLUSDT.P: SOL's Dip - Your Opportunity
🐸 1000PEPEUSDT.P: Prime Bounce Zone Unlocked
🚀 ETHUSDT.P: Set to Explode - Don't Miss This Game Changer
🤖 IQUSDT: Smart Plan

#XVS/USDT#XVS
The price is moving in a downtrend on a 4-hour frame
After bouncing from a major support area in green at the $9 level
We have a tendency to stabilize above the Moving Average 100
We have a downtrend on the RSI that is about to break higher
Entry price is 9.30
First goal 10.43
Second goal 11.94
Third goal 13.38

Venus (XVS)XVS (Venus) Coin is one of the prominent projects in the field of decentralized finance (DeFi) that has significant growth potential due to its low market cap. This analysis highlights the following points:
📊 Comprehensive Analysis of XVS
🔍 Overview of the Analysis:
Formation of PRZ (Potential Reversal Zone):
A key area consisting of the weekly resistance and ascending channel ceiling, which could determine the continuation of the price trend. Breaking this zone is crucial for further upward movement.
🕰 Technical Analysis:
Current Status (Short-term):
In the daily timeframe, the price is currently testing the daily resistance (yellow zone). It is highly likely that this resistance will break, leading the price to the PRZ area.
Significance of PRZ:
The PRZ, formed by the weekly resistance and ascending channel ceiling, acts as a critical decision point. Breaking this zone could trigger a powerful and sharp upward movement.
🎯 Price Targets:
First Target: The green resistance area, aligned with the 1.618 Fibonacci level.
Second Target: The all-time high, coinciding with the 2.618 Fibonacci level.
📌 Key Takeaways:
Breaking the daily resistance (yellow area) in the short term is likely to guide the price toward the PRZ.
Breaking the PRZ (weekly resistance and the ascending channel ceiling) is essential for sustaining the upward trend.

Crack the code of XVS with XABCD!XVS Coin (Venus Coin) Chart Characteristics
Volatility:
XVS, like many other altcoins, exhibits high volatility, especially during periods of increased market activity or when Venus protocol-related updates are released.
Sharp price spikes and dips are common, making it an ideal candidate for pattern-based trading.
Trend Behavior:
XVS often moves in trends driven by broader market sentiment, such as Bitcoin price movements, or specific news related to DeFi and the Venus ecosystem.
It tends to form strong rallies during bullish cycles but can also experience steep corrections.
Volume Patterns:
Trading volumes can be irregular, often spiking during significant announcements or broader market rallies.
High volume during breakout points or pattern completions can confirm price movements.
Support and Resistance:
XVS charts often show well-defined support and resistance levels, which align with Fibonacci retracement or extension levels.
These levels play a crucial role in identifying potential XABCD patterns.
XABCD Pattern Characteristics
The XABCD pattern is a harmonic trading pattern used to identify potential reversal zones. It includes various specific patterns, such as Gartley, Bat, Butterfly, and Crab, each with unique Fibonacci ratios. Here’s a breakdown:
Structure:
The XABCD pattern consists of five points (X, A, B, C, D) that form four legs (XA, AB, BC, CD). These legs follow Fibonacci ratios to define the pattern.
Each variation (e.g., Gartley or Butterfly) has distinct Fibonacci retracements and extensions.
Key Elements:
XA: The initial move in price, which sets the foundation for the pattern.
AB: A retracement of the XA leg, typically around 38.2% to 61.8% of XA.
BC: A secondary retracement, often 38.2% to 88.6% of AB.
CD: The final leg, extending beyond BC, with specific Fibonacci targets depending on the pattern.
Types of Patterns:
Gartley: Features a deep retracement (61.8%) of the XA leg and a completion point at D near 78.6%.
Bat: Similar to the Gartley but with a shallower AB retracement and D completing at 88.6%.
Butterfly: Extends beyond XA, with the D point reaching a 127.2% or 161.8% extension.
Crab: Features an extreme extension of the XA leg, with the D point reaching a 161.8% or beyond.
Confirmation:
A valid XABCD pattern should align with Fibonacci levels. Traders often wait for price action or other indicators (like RSI divergence) to confirm the reversal.
Applying XABCD Patterns to XVS Coin
When trading XVS using XABCD patterns:
Look for clear impulsive and corrective waves that align with the pattern's structure.
Use Fibonacci tools to verify retracements and extensions.
Confirm potential reversal zones (PRZ) near the D point with additional signals like volume spikes or momentum divergence.
Monitor support/resistance zones for added confluence with pattern completion.
This approach allows you to predict potential reversals or continuations in XVS price, offering well-defined risk-reward opportunities.
I keep my charts clean and simple because I believe clarity leads to better decisions. Trading doesn’t have to be overly complicated, and I enjoy sharing setups that have worked well for me.
My approach is built on years of experience and a solid track record. I don’t claim to know it all, but I’m confident in my ability to spot high-probability setups. It’s all about learning and growing together as traders, and I’m here to share what I see.
The markets can confirm what the charts whisper if we’re paying attention. I hope these levels help you as much as they’ve helped me in the past. Let’s see how this plays out!
My Previous Hits
🐶 DOGEUSDT.P: Next Move
🎨 RENDERUSDT.P: Opportunity of the Month
💎 ETHUSDT.P: Where to Retrace
🟢 BNBUSDT.P: Potential Surge
📊 BTC Dominance: Reaction Zone
🌊 WAVESUSDT.P: Demand Zone Potential
🟣 UNIUSDT.P: Long-Term Trade
🔵 XRPUSDT.P: Entry Zones
🔗 LINKUSDT.P: Follow The River
📈 BTCUSDT.P: Two Key Demand Zones
🟩 POLUSDT: Bullish Momentum
