Crack the code of XVS with XABCD!XVS Coin (Venus Coin) Chart Characteristics
Volatility:
XVS, like many other altcoins, exhibits high volatility, especially during periods of increased market activity or when Venus protocol-related updates are released.
Sharp price spikes and dips are common, making it an ideal candidate for pattern-based trading.
Trend Behavior:
XVS often moves in trends driven by broader market sentiment, such as Bitcoin price movements, or specific news related to DeFi and the Venus ecosystem.
It tends to form strong rallies during bullish cycles but can also experience steep corrections.
Volume Patterns:
Trading volumes can be irregular, often spiking during significant announcements or broader market rallies.
High volume during breakout points or pattern completions can confirm price movements.
Support and Resistance:
XVS charts often show well-defined support and resistance levels, which align with Fibonacci retracement or extension levels.
These levels play a crucial role in identifying potential XABCD patterns.
XABCD Pattern Characteristics
The XABCD pattern is a harmonic trading pattern used to identify potential reversal zones. It includes various specific patterns, such as Gartley, Bat, Butterfly, and Crab, each with unique Fibonacci ratios. Here’s a breakdown:
Structure:
The XABCD pattern consists of five points (X, A, B, C, D) that form four legs (XA, AB, BC, CD). These legs follow Fibonacci ratios to define the pattern.
Each variation (e.g., Gartley or Butterfly) has distinct Fibonacci retracements and extensions.
Key Elements:
XA: The initial move in price, which sets the foundation for the pattern.
AB: A retracement of the XA leg, typically around 38.2% to 61.8% of XA.
BC: A secondary retracement, often 38.2% to 88.6% of AB.
CD: The final leg, extending beyond BC, with specific Fibonacci targets depending on the pattern.
Types of Patterns:
Gartley: Features a deep retracement (61.8%) of the XA leg and a completion point at D near 78.6%.
Bat: Similar to the Gartley but with a shallower AB retracement and D completing at 88.6%.
Butterfly: Extends beyond XA, with the D point reaching a 127.2% or 161.8% extension.
Crab: Features an extreme extension of the XA leg, with the D point reaching a 161.8% or beyond.
Confirmation:
A valid XABCD pattern should align with Fibonacci levels. Traders often wait for price action or other indicators (like RSI divergence) to confirm the reversal.
Applying XABCD Patterns to XVS Coin
When trading XVS using XABCD patterns:
Look for clear impulsive and corrective waves that align with the pattern's structure.
Use Fibonacci tools to verify retracements and extensions.
Confirm potential reversal zones (PRZ) near the D point with additional signals like volume spikes or momentum divergence.
Monitor support/resistance zones for added confluence with pattern completion.
This approach allows you to predict potential reversals or continuations in XVS price, offering well-defined risk-reward opportunities.
I keep my charts clean and simple because I believe clarity leads to better decisions. Trading doesn’t have to be overly complicated, and I enjoy sharing setups that have worked well for me.
My approach is built on years of experience and a solid track record. I don’t claim to know it all, but I’m confident in my ability to spot high-probability setups. It’s all about learning and growing together as traders, and I’m here to share what I see.
The markets can confirm what the charts whisper if we’re paying attention. I hope these levels help you as much as they’ve helped me in the past. Let’s see how this plays out!
My Previous Hits
🐶 DOGEUSDT.P: Next Move
🎨 RENDERUSDT.P: Opportunity of the Month
💎 ETHUSDT.P: Where to Retrace
🟢 BNBUSDT.P: Potential Surge
📊 BTC Dominance: Reaction Zone
🌊 WAVESUSDT.P: Demand Zone Potential
🟣 UNIUSDT.P: Long-Term Trade
🔵 XRPUSDT.P: Entry Zones
🔗 LINKUSDT.P: Follow The River
📈 BTCUSDT.P: Two Key Demand Zones
🟩 POLUSDT: Bullish Momentum
XVSUSDT trade ideas


Venus? Moon? Who Cares?XVS, also known as Venus, has experienced a sudden price surge and an increase in volume. As a result, I have identified two potential demand zones.
These zones are based on the assumption that they could act as strong support levels, where buying interest might re-emerge due to the current momentum and the underlying market structure.
If the price retraces to these zones, they could provide an opportunity for a rebound, as they represent areas where buyers might step in again to drive the price higher.
I don't overcomplicate things and add a ton of dirty crap to my charts, but you can check out the success of my analysis below.
I approach trading with confidence backed by experience and past success in identifying high-probability setups.
While I don’t claim to be the best, my track record speaks for itself, and I strive to let my analysis and results do the talking. Watch these levels closely—markets can confirm what charts already whisper. Let’s see how this plays out together.
My Previous Ideas
DOGEUSDT.P | 4 Reward for 1 Risk much more if you hold it.
RENDERUSDT.P | HTF Accuracy
ETHUSDT.P | Accurate Buyer Zone Identification | High Risk Reward if you hold it.
BNBUSDT.P | Accurate Buyer Zone Identification | High Risk Reward if you hold it.
Bitcoin Dominance | Great Characteristic Detection and Accurate Analysis

XVS USDT Spot trade 300% potentialXVS/USDT shows potential for a 300% gain in the spot market if it can break through key resistance levels on higher timeframes, backed by bullish volume and market sentiment. Positive developments in the Venus Protocol ecosystem or broader DeFi adoption could act as catalysts for such significant upside movement.

A clear bearish flag on XVSUSDTXVS has been creating a bearish flag pattern since its last run downwards, this flag pattern is a correction movement, which could be a sign for another downward price run.
Comment what you think …

TradeCityPro | XVS & Bitcoin : Key Levels and Insights👋Welcome to TradeCityPro!
In this analysis, I want to review XVS for you. This token is the native token of the Venus project, which operates on the BSC network and specializes in the DeFi sector. It boasts the highest TVL on this network. This platform allows users to collateralize their assets and borrow funds proportionate to their collateral. Currently, the platform's TVL stands at $1.8 billion, and XVS ranks 361 on CoinMarketCap.
👑 Before analyzing XVS, it's better to take a look at Bitcoin to better understand the market conditions. The Bitcoin analysis is done on the 4-hour timeframe.
⏳ 4-Hour Timeframe: Correction Phase in Bitcoin
On the 4-hour timeframe, after breaking the $72,771 resistance (the previous ATH), we witnessed a very sharp, high-momentum move up to $99,022. Currently, Bitcoin has entered a correction phase. The first significant support in this timeframe is $92,004, which overlaps with the 0.236 Fibonacci level. The price has already reached this level. At the same time, the SMA99 has also aligned with the candles in this area, turning this level into a very strong PRZ.
✨ The RSI oscillator has triggered divergence, exiting the lower Bollinger Band several times, which has eliminated the bullish momentum. However, the most important thing in a bullish market is that when the RSI approaches the 30 level, it often represents a good buying opportunity. Using the Bollinger Band indicator, we can better determine trend reversals and RSI triggers. However, all of these require price confirmation, which can be achieved through Dow Theory rules or short-term resistance breakouts.
📊 On the other hand, the volume of corrective candles is increasing, which is not a good sign for the correction's end and makes the bearish scenario more likely.
🔑 If the $92,004 support breaks, the next key support is $86,841, which aligns with the 0.382 Fibonacci level and is likely to serve as a major support during this correction. For now, I won't discuss other supports; if $86,841 is broken, I'll determine the rest later.
✅ XVS Analysis: Weekly and Daily Timeframes
📅 Weekly Timeframe: Long-Term Box
On this timeframe, the price previously formed a long-term box between $3.17 and $9.19. After breaking this range, a new box was formed between $5.29 and $17.43, where the price currently trades in the lower half of the box and is struggling with resistance at $9.19.
🔼 The previous weekly candle was very strong and powerful but couldn't break the $9.19 level. The current candle is also rejecting from this level. For spot buying, breaking this resistance or $17.43 is suitable. The potential targets are $40.22 and $140.26, with $140.26 being the ATH for this coin.
📉 In case of a drop, the first support is at $5.29, and on the RSI, there is a significant support level at 39.32, which can prevent a price decline. If this support is broken, the next level is $3.17, the all-time low for this coin.
📅 Daily Timeframe: Strong Resistance Zone
On the daily timeframe, the $9.19 resistance can be drawn as a range between $8.18 and $8.91, which is very important. Currently, the price is rejecting from $8.91 and has dropped to $8.18.
🔍 The main and significant support on this chart is the ascending trendline, which previously experienced a false breakout. If the price stabilizes below $8.18, the next corrective target will be reaching this trendline.
💣 If the trendline breaks, the next support is $5.98, which is a strong resistance since the market previously reversed from this level after a false trendline breakout and reached the $8.91 high.
🧩 If the RSI stabilizes above 66.27, the price can start pumping because it has already hit this level twice and been rejected. If the RSI breaks below 50, bearish momentum will enter the market, and the bearish scenario will strengthen.
📝 Final Thoughts
This analysis reflects our opinions and is not financial advice.
Share your thoughts in the comments, and don’t forget to share this analysis with your friends! ❤️

Trade Signal Alert: XVSUSDT PairDirection: Sell
Enter Price: 7.6
Take Profit: 7.38666667
Stop Loss: 7.80666667
We are issuing a SELL signal for the XVSUSDT currency pair based on the EASY Quantum Ai trading strategy.
Rationale Behind the Prediction:
1. Technical Indicators: Our analysis indicates bearish trends in key technical indicators such as the Relative Strength Index (RSI) and Moving Averages (MA). The RSI is signaling overbought conditions, suggesting a potential price correction.
2. Market Sentiment: There's prevailing market sentiment leaning towards a bearish outlook for XVSUSDT. Recent news events affecting the broader crypto market are likely to exert downward pressure on the pair.
3. Trend Analysis: Historical price patterns for XVSUSDT show that similar setups have resulted in downward movements. The pair is currently testing a resistance level, which historically tends to trigger declines.
4. Volume Analysis: A decrease in buying volume has been observed, indicating weakening bullish momentum and supporting the case for a price drop.
This recommendation is generated using advanced algorithms and machine learning techniques within the EASY Quantum Ai framework. As always, ensure you manage your risks effectively.

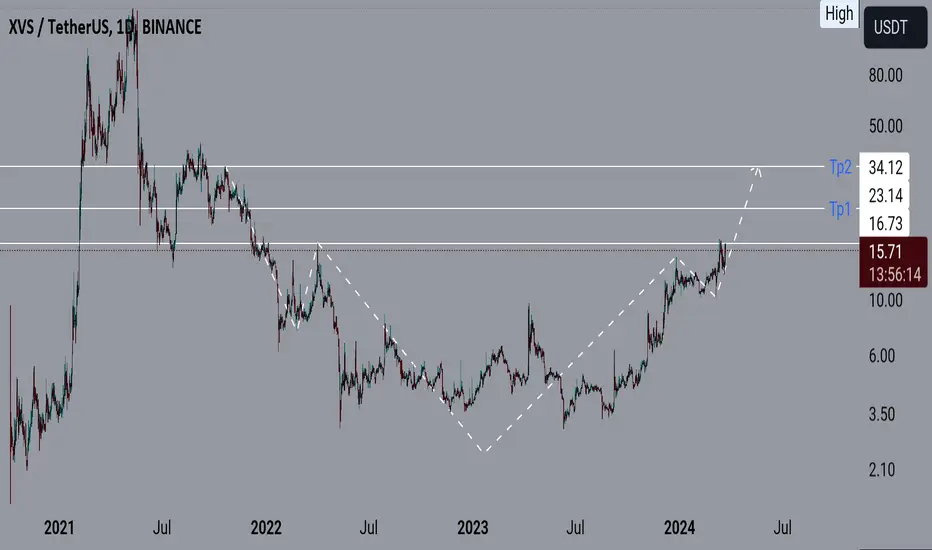
Venus Keeps Growing (Long-Term Growth Potential Revealed 28-45X)Venus has been growing, long-term, since October 2020, when it started trading on Binance. Always, the dynamic has been one of higher lows. We have short-term higher lows, mid-term higher lows and long-term higher lows.
Within the accumulation phase, we have a perfect long-term double-bottom. In May 2022 Venus (XVSUSDT) bottomed at 3.01. In June 2023, Venus (XVSUSDT) bottomed at the exact same level, 3.01. The bottom is in. The second low launched the 2023 recovery wave and the start of the uptrend. The first part of 2024 was mostly a correction and now, after a mid-term higher low we are seeing the resumption of the bullish move.
Venus just broke a small local resistance and is ready to grow. We do not focus on the short-term though but the long-term and potential is quite big for this pair. The long-term growth dynamic is pretty obvious and thus we can expect a new All-Time High in 2025. We are looking at 2,800% to 4,500% in 8-12 months. Can happen a bit sooner but most likely within this time range.
Additional details can be found on the chart. There is also a trade-idea for the Bitcoin pair (XVSBTC). Find it in the 'Related publications' below this post.
Namaste.

XVS buying opportunity XVS is currently trending within an upward channel, reflecting a consistent bullish pattern. The price has now reached the lower boundary of this channel, presenting a compelling buying opportunity. Historically, these lower boundary touches have often led to significant upward moves, making this an opportune moment to consider entering a position.

XVS ANALYSIS (12H)From where we put the red arrow on the chart, it looks like the XVS correction has started.
XVS is approaching a flip range
We are looking for sell/short positions in the red range.
We have specified short-term targets on the chart.
Closing a daily candle above the invalidation level will violate the analysis.
For risk management, please don't forget stop loss and capital management
When we reach the first target, save some profit and then change the stop to entry
Comment if you have any questions
Thank You

XVSXVSUSDT Technical analysis update
XVS price break out from trend line, and a breakout has been confirmed. We can expect a strong bullish move from the current level.
Buy zone : Below $6.85
Stop loss : $5.50
Target Level: $11.70
Venus has potential for 70% upside.
For premium service please contact.

XVSUSDT - 1DMy long term view for this currency, waiting for this type of market movements is not out of mind, please have capital management because digital currencies are very volatile, buy in steps to hold, your average dollar purchase with steps Entering the market is highly optimized. And the risk-to-reward ratio gives you a good chance to survive in the market and be successful.

XVS sell/short setupThe structure of large time frames is bearish. So we are looking for sell/short positions in the main supply ranges.
We are looking for sell/short positions on the supply range.
We specified the targets on the chart.
Closing a daily candle above the invalidation level will violate the analysis
Note that the financial market is risky, so:
Do not enter a position without setting a stop and capital management and confirmation and trigger.
When we reach the first TP, save some profit and try to move the stop continuously in the direction of your profit.
If you have any comments please post them, comments will help us improve our performance
Thanks

XVS Venus no new ATH this cycle?Looking at the chart I'm thinking we could see a .618 to .702 retracement with possibly up to .786
As the wave count develops I'll adjust the chart and idea but as it stands with the wave 1 and 2 assumed complete the trend based fib gives us 1.618 target for now

XVS USDT LONG POTENTIAL 27XHi everyone
this is not a financial, investment, trading, or other types of advice or recommendations
this is my idea
and its my art and way of seeing market today
trade with your plan

XVSUSDTXVSUSDT is in reversal zone big bullish divergence shown in RSI.
Potentiall sign of reversal here.
we wait for further confirmation if it will break the last LH then we will execute our plan here,

#XVS/USDT breaks the Diagonal Trendline in 4-Hour TF!#XVS/USDT breaks the Diagonal Trendline in 4-Hour TF!
Wait for a successful retest to open a long position. The local support level is PWH $9.665, and the local resistance level is PDH $10.13.

XVS/USDT I BUY SETUP✔︎📈 BINANCE:XVSUSDT SIGNAL
✔︎ENTRY : 16.16
🏓TARGETS :
✔︎T1 : 17.66
✔︎T2 : 19.76
✘STOP : 15.32
🚦Stop Trigger:
• If you make capital management: Stop is activated when one candle opening and closing
below the stop level of the same time frame of the signal.
• If you don't make capital management: Stop is direct without waiting for the candle to close.
💡Risk management :
• Enter the trade with 10% to 20% of your capital to reduce risk and save cash to enter other opportunities.
• Sell (25% to 50%) on (T1) and don't move your stop-loss.
• Sell 50% on (T2) and move your stop loss to the entry point.
• You are safe now, and the next 25% is up to you.
💡Reason for this trade:
This trade gives my trading system a sign of strength:
• My trading system is based on liquidity and reversal zones.
• When the liquidity is swept from one side under certain conditions, we will wait for the price on the other side.
The liquidity will attract the price like a magnet.
• the first side that has been swept:
1- failure swing point
2- reclaim volume profile after failure swing point
• Opposite side targets:
1- previous monthly high
2- monthly open
3- liquidity void
💡Entry setup
1- successful auction (AMT)
reclaim volume profile VAH
⚠️WARNING:
• I'm not a financial advisor.
• Do your own research (DYOR).

Long Trade Position XVSUSDTYou are allowed to start a trade when at least one candle closes above the entry point within fifteen minutes. Raise your analytical skills with the targets that I will give you and test your patience and strategy to reach price targets in the demo panel with virtual money. These exercises make you experience profit and loss with targets and stops, virtually in the real market and improve your analysis and personal strategy. Know your fear and greed and gradually control them so that your business is profitable and less harmful. I wish you happiness and wealth

#XVS/USDT#XVS
The price has been moving in a symmetrical triangle since December 2023
The price adheres to the boundaries of that triangle beautifully
The price is expected to break the triangle upward
Current price 12.11
First goal 13.02
For the second goal 13.74
Third goal 14.77

XVS is bullish Buy XVS as spot in "DCA"
Hello everyone
I see a big head and shoulders pattern, it has already broken its resistance, after a little correction it will continue ✈️
$XVS broke out of range a day ago been chilling under vwap from ath
reclaim vwap or $17.14ish to go to $29 then $38.6ish
got some out of boredom so shall log off now to avoid messing up stuff
