XVSUSDT AnalysisHello friends.
Please support my work by clicking the LIKE button(If you liked).Thank you!
Everything on the chart.
open pos: market
target: 32 - 36 - 40
after first target reached move ur stop to breakeven
stop: ~23 (depending of ur risk). ALWAYS follow ur RM .
risk/reward 1 to 3
Good luck everyone!
Follow me on TRADINGView, if you don't want to miss my next analysis or signals.
It's not financial advice.
Dont Forget, always make your own research before to trade my ideas!
Will be very appreciate for ur donat/coins :)
Open to your questions or suggestions(Looking for investors!).
XVSUSDT trade ideas

XVS , Has Broken MA50 and Fan speed Fibo after retesting pumpXVS , Has Broken MA50 and Fan speed Fibo after retesting and Supporting By uptrend Support line is gonna to pump

xvsusdtbulish
by 28.65
1 T.....91.52
2 T....154.12
3 T....421🚀🚀🚀🚀🚀🚀🚀🚀
stoploos in ..19.38
just holding to be rich


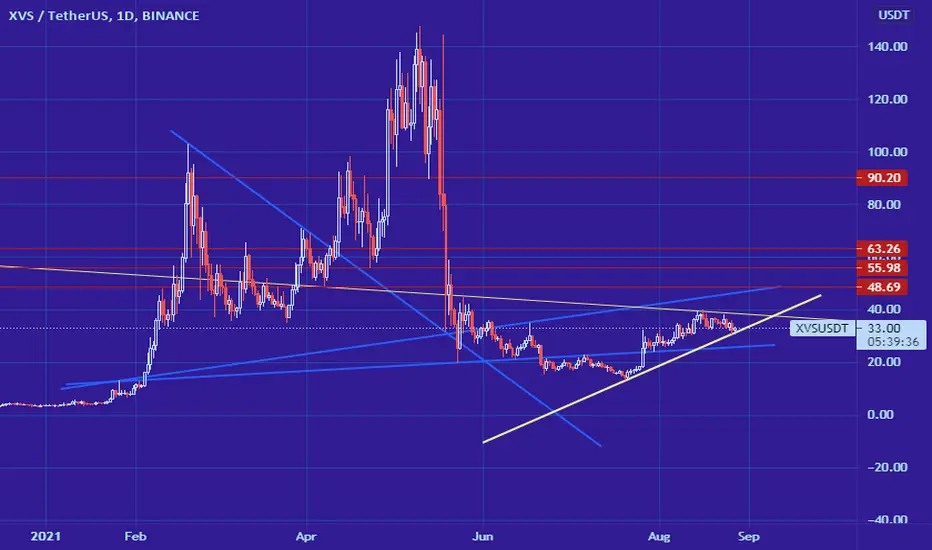
XVSUSDTHi everyone,
This is my description:
Blue Lines: Resistance (Target for sell)
Orange Lines: Support (Step for buy)
Pink Rectangles: PRZ
Thanks for your attention.

#XVS/USDT. #XVS/USDT. LONG AND MID TERM
I expect a good pump from that support
My analys for who wanted it here it is
(Not financial advice)

🆓Venus (XVS) Oct-9 #XVS $XVSXVS is heading to 34$ and 42$ zones this October. But if it loses this 27$ zone, we will consider buying it back at 23$ zone
📈RED PLAN
♻️Condition : If 1-Day closes ABOVE 27$ zone
🔴Buy : 27
🔴Sell : 34 - 42
📉BLUE PLAN
♻️Condition : If 1-Day closes BELOW 27$ zone
🔵Sell : 27
🔵Buy : 23
❓Details
🚫Stoploss for Long : 10%
🚫Stoploss for Short : 5%
📈Red Arrow : Main Direction as RED PLAN
📉Blue Arrow : Back-Up Direction as BLUE PLAN
🟩Green zone : Support zone as BUY section
🟥Red zone : Resistance zone as SELL section
🅰️A : The Close price of 1-day candlestick is Above the zone
🅱️B : The Close price of 1-day candlestick is Below the zone

Trading CombinationGood combination of indicators! Very usefull to trade bearish or bullish by making a combination of a three indicators. It available for free acount. No need to pay money.

XVS VENUS WHALES BUYING Whales buying XVS, check volume, still an amazing price compare the top, if we see the top 145$ now 27$
5x at least from the all time high

XVS about to make some big moves. Alot of news will be coming out in october for XVS, Vaults will be one of them. DYOR but XVS has more in the coming months than most other coins, XVS has a history of making big moves and fast. consolidation phase is over and this has worked out perfectly with BTC doing its early october thing.
Enjoy.


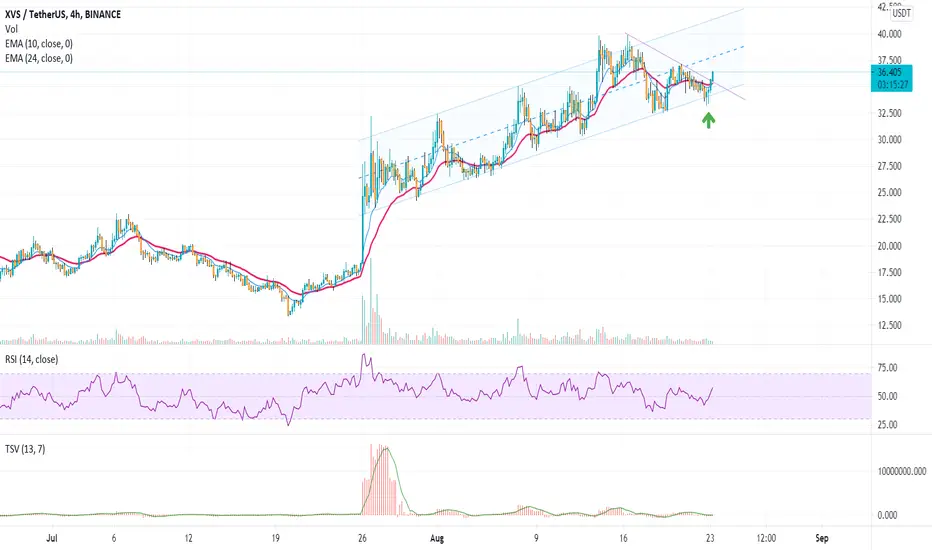
Venus (XVS) vs Tether (USDT) | Trading Tips & More!Ok... The last one is Venus (XVSUSDT).
Notice I always draw a green arrow here on the chart.
This arrow represents the potential bullish scenario but there is a catch.
This is not to say that XVSUSDT will move right away up, but this can happen.
This means that above the current price levels the potential remains up but I am never predicting time.
Meaning, we can see this same pair consolidate sideways for weeks before moving up.
It remains above the EMAs (EMA10/50/100, etc) and then jump.
If at any time prices go below support (light blue square on the chart) prices can drop...
The catch is that it can go sideways for months before the breakout shows up.
Now, the potential is leading towards the bulls (green).
This is what I try to show with these charts.
Venus is bullish above "support".
As long as it remains above these level, at any time, it can break up.
I can also work on predicting the time but this is harder, the throw of a dice, too many variables... Nope.
We keep it simple.
We trade we patience.
WE BUY AND WE HOLD.
If we go below support we close at a loss.
If we break up, we enjoy, collect the profits and rejoice.
Always being extremely grateful.
Thanks a lot for your support.
Namaste.

xvsusdt froctal proboia nakoplenuaxvsusdt froctal proboia nakoplenua. vozmojen proriv granici nakopleniz i povtorenia uskoreniya

XVS breakout!The price has broke out of the formation and is now testing the most important level (35.5)
I believe it's a strong entry because:
1) This level proved to act as strong support/resistance in the past
2) It goes along with the upper trendline of the formation
3) The price is above 200EMA on daily chart
5) MFI 1h shows big divergence
4) Price can spike very quick from here as there's not much volume above
If btc doesn't go mad, this should be a very good trade.
Entry: 35.50 - 34.50 (or as long as it holds upper trendline)
SL: 32.40 (bottom of ATR(14), below 200ema 4h and below previous daily candle)
TP1: 41.60
TP2: 47.11
TP3: 58.16
TP4: 91.10
TP5: 125.3
TP6: 143.60
TP7: OPEN++


XVSThe reality is that in this DEFI we will have to be very patient, however, there is a lot of exposed liquidity, investing a little and programming the collection horizon in a few weeks would be the ideal.

VENUS look OKay.ishXVS looks better than other coins
We see this pennants that can be a fake one
Can run a little sooner than others now

XVS bouncing on uptrend supportXVS respecting it's uptrend channel. Either average up your position or entry whenever there's a market correction. So far so good.

xvs may break its resistance this time and pump hardxvs going near its resistance and may break this time and pump very hard


XVS Long - Target $260 Bull Run 2021SUMMARY: Long, struggling to get out of the accumulation zone but next target is $42
Note, looks like pullback is coming first.
-- Technical --
Ascending triangle - bullish sign.
Above the EMAs 50/100/200 and working towards the 200 ma.
Yet to pump like many other see AVAX (below link).
Please HIT the --->>> "LIKE" and "FOLLOW" button. <<<----
*Not financial advice and is for educational purposes only. Always DYOR.
