XYOusdt Trading opportunityXYOUSDT has achieved a magnificent breakout from its downtrend, showcasing a potential inverse head and shoulder formation. The price is currently forming the right shoulder of this pattern, with a broad accumulation zone that can accommodate most of the right shoulder formation. Targets are clearly delineated on the chart, ranging from immediate to final levels. For this setup, I recommend a 25% stop loss and suggest trading on spot to allow for proper room for dollar-cost averaging (DCA) if feasible.
XYOUSDT trade ideas

XYO DAILY TIMEFRAME UPDATE (ON DEMAND) ❤️ THIS POST AND I WILL SHARE NEXT 10X GEM COIN
XYO is a DePIN ecosystem of consumer software, developer tools, a decentralized network, and digital assets. XYO facilitates and incentivizes the aggregation, validation, and use of decentralized data
ANY THOUGHTS ON $XYO ?

XYO at a Key Accumulation Zone: Poised for the Next Leg Up?XYO has retraced to a critical support zone between $0.012 and $0.014, a level that has proven to be a key structural point in previous cycles. This pullback comes amid broader market consolidation, aligning with Bitcoin’s retest of a historically significant support level—an event that many view as a prime re-entry opportunity in a bullish macro environment.
Technically, XYO remains in an uptrend, with price action currently testing the 200-day EMA, a crucial dynamic support. The RSI around 42 suggests the market is cooling off after recent volatility, positioning XYO for a potential rebound should buying momentum return. A successful defense of this range could trigger the next leg up, with $0.0184 as the key breakout level. If this resistance is cleared with volume, a move toward $0.0227 and beyond becomes increasingly probable.
The overall market structure suggests accumulation rather than a breakdown, reinforcing a bullish bias as long as support holds. A deeper correction remains a possibility if Bitcoin faces unexpected volatility, but given the strong technical confluence at current levels, downside risk appears limited.
For investors eyeing mid-term opportunities, this zone represents a compelling accumulation area, provided confirmation signals emerge in the coming sessions. As XYO continues to develop within the DePIN ecosystem, its fundamental and technical outlook remains strong, positioning it well for the next market expansion phase.

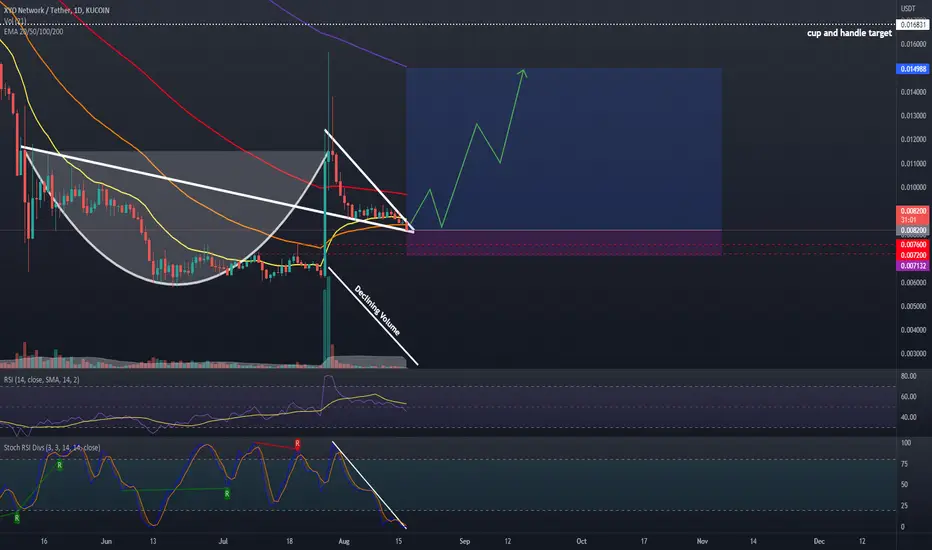
This chart provides a XYO NetworkThis chart provides a XYO Network (XYO/USDT) weekly analysis, showing a significant breakout setup. Here’s the detailed breakdown:
Key Observations
Cup and Handle Formation:
A classic cup and handle pattern has formed, which is a strong bullish continuation signal.
The breakout above the handle’s resistance level confirms upward momentum.
Key Levels:
Support Zone: Around $0.008982, now acting as a base after the breakout.
Targets:
T1: $0.012771 – The first significant resistance zone.
T2: $0.016118 – Mid-term target aligned with historical levels.
T3: $0.018827 – Long-term target with potential for extended gains.

search it and set your setupXYO/usdt daily tmf for searching you can look to XTZ/usdt chart i think they have same setup
im waiting for price on 0.0036 for long position.
its not a signal for buy or sell orders please sewarch yourself and have the best
wish you guys all the best .

XYOUSDT NOW YOU CAN BUY AGAIN1-Apply your own risk management.
2-Daily and Weekly Targets
3-Hunt the profits at any level you see convenient for you.
4-Raise Your SL any time the price moves up or down to protect your profits
5-Use 6% Spot
6-Long it With 5% LEV3


Bull Pennant/Falling WedgeCup and handle, falling wedge. Oversold on almost all time frames (15min, 1hr, 2hr, 4hr, daily). Holding 0.786 retracement. Declining volume, SRSI under resistance, seems to have broken the resistance. 1-week SRSI is curving down so it may wreck this trade, keep that in mind.
Falling Wedge/ Bull FlagPotential bull flag/wedge gold pocket retracement, wait for the breakout, backtest and for it to go up. :) 1D SRSI is oversold, 4 hour SRSI is pointing up, MACD about to cross bullish. 1HR SRSI is overbought, wait for it to reset.


XYOUSDTDue to the failure of the descending channel, we expect the channel sizes to decrease and close the short position

$XYO TO 0.0175point 2 on chart(0.0175) stronger than point 1 (0.2256) for buying order.
the most of your money must put there.

XYO, a lot of potential use cases. Keep an eye on this.XYO appears to have broken from it's Falling wedge
If it fails to break through the 2 golden lines I have marked and hold them as support,
I plan on accumulating more at the point of the breakout as a potential retest.
Besides that, the market has been doing it's usual scares. I have not been focusing so much on my assets but that does not mean I do not monitor the market.
Don't get scared and miss out on the opportunities you will regret later in your life.
If you want to succeed, you need to be able to stomach your emotions and understand what and why you are investing.
If you believe in it, stop making it seem like it's a lie you tell yourself to feel cool.
Merry Christmas, and lets hope for a Better Next Year.

XYO Network with nice volume support bounce...XYO Network with nice volume support bounce...
... has just flipped the MA Ribbon bullish on 4h chart.
Looks nice - What do you think? 😎
Drop me a nice comment if you'd like me to analyze any other cryptocurrency or a coin-comparison.
*no financial advice
do your own research before investing

XYOUSDT Technical Analysis💎 XYOUSDT has formed a wedge pattern. The price is at a major support zone. After the breakout it can go for a pullback and retest before continue the bullish move
🌐 Tradingview
💵 Invest Only 5% of your Portfolio
🎳 Entry/Pullback now or from 0.03603 - 0.03333
☕️ TP1 0.03987
🍺 TP2 0.04496
🍻 TP3 0.05000
🍾 TP4
🍷 TP5
🍸 TP6
🍹 TP7
🎁 TP8
🚫 SL 0.03281 - 0.03050
Good Luck 🎲
Check the Links in Description and if you LIKE this analysis, please support our page and Ideas by hitting the LIKE 👍 button. ❤️ Your Support is really appreciated! ❤️
Traders, if you have your own opinion about it, please write your own in the comment box. We will be glad for this.
Feel free to request any pair/instrument analysis or ask any questions in the comment section below.
We will have more FREE forecasts in TradingView soon
Have a profitable day 😊👍🏻

XYO, Daily TIMEFRAMEI'm expecting the Coin App will continue to catch on and more crypto enthusiasts will discover this coin. We'll see!


XYO next entry 0.64I'm happy with an 11% profit on an XYO swing trade this week. I expect the next entry to be around 0.64 with a bounce to between 0.78 and 0.84.


XYO Another Round If this works out the reward ratio is nice so why not
XYO is the best performing asset of the year it always surpasses your expectations

XYO USDT Long SetupXYO having a monster move
Just printed a new ATH
Will wait for a retracement to my buying zone


XYOUSDT Daily TimeframeSNIPER STRATEGY (new version)
It works ALMOST ON ANY CHART.
It produces Weak, Medium and Strong signals based on consisting elements.
NOT ALL TARGETS CAN BE ACHIEVED, let's make that clear.
TARGETS OR ENTRY PRICES ARE STRONG SUPPORT AND RESISTANCE LEVELS SO THEY CAN ACT LIKE PIVOT POINTS AND REVERSE THE WAVE (or act like a mirror that can reflects light) BASED ON STRENGTH OF THAT LEVEL.
ENTRY PRICE BLACK COLOR
MOST PROBABLE SCENARIOS TARGETS GREEN COLOR
LEAST PROBABLE SCENARIOS TARGETS RED COLOR
TARGETS ARE NOT EXACT NUMBERS THEY ARE MORE LIKE A ZONE.
DO NOT USE THIS STROTEGY FOR LEVERAGED TRADING.
It will not give you the whole wave like any other strategy out there but it will give you a huge part of the wave.
The BEST TIMEFRAMES for this strategy are Daily, Weekly and Monthly however it can work on any timeframe.
Consider those points and you will have a huge advantage in the market.
There is a lot more about this strategy.
It can predict possible target and also give you almost exact buy or sell time on the spot.
I am developing it even more so stay tuned and start to follow me for more signals and forecasts.
START BELIEVING AND GOOD LUCK
HADIMOZAYAN
