YFI (& ALTCOINS) SHORT Hello, YFI is a great project, definitively the first alt I will want in my ptf once the storm has passed. BUT, now alts are suffering, and DeFi coins even more as, despite other alts, they were in a bubble. All defis are experiencing falls of 60%+ and in some cases even 90%.
The difficult part is that defi coins do not have a significant history, so there are not many supports/resistences to base an analysis on.
However, YFI charts shows a H&S that signal that the fall is not over yet. Also, we were rejected from the Fibo retracement area, meaning than this is not a simple retrace.
I traced a vertical line to show where the target based on pure TA would be, even if with crypto this has to be taken with caution as as this kind of target are usually unreliable due to prior parabolic rises. However, I traced 3 possible targets on the chart. I will wait YFI there to accumulate.
YFIBTC trade ideas


YFI / BTC — 4h chart / price prediction for Yearn.Finance DeFiPrice clearly looks like Head & Shoulders setup. If it goes below 2.0 this can trigger selloff during late autumn and possible to reach 1.5 this year, where nearest support is located. Good luck!✌️

YFIBTC completing final leg of Butterfly | It can be 900% moveThe priceline of yearn.finance ( YFI ) is completing the final leg of bullish Butterfly , the targets as per the Fibonacci sequence of Butterfly are:
Potential reversal or buying zone: 1.15570 to 0.32152 btc
Fibonacci projection or sell zone: 1.80300 to 3.37288 btc
Regards,
Atif Akbar (moon333)

$YFI - Head and shoulders patternI spotted this and then clicked onto Twitter to see that every moron has seen the same thing.
Argument for:
$YFI is on a support line that's been tested a few times now so buyers must be getting fatigued at this point. More than the pattern, that makes me think we could see a drop to the support below.
This just happens to track with another support further down that was established prior.
Argument against:
It's always important to remember that crypto is a manipulated market, and being part of a crowded trade (especially in the short-term) isn't always a brilliant place to be.
My verdict:
Most likely, further downside. I'm not in $YFI right now, instead building a position on $CORE.


it really doesn't get much simpler than thisihns + decreasing rsi, weak right side volume, and volume agg tool shows sellers clearly in control for the first time since binance has listed this coin.
due for a dump imho
not financial advice.
stay safe.

Is YFI continue downtrending?Take a look. We may be forming a possible H&S as Simon said
The short position will only be indicated if we drop below that level and starts an accumulation pattern
The first target will be the 0.382 Fibonacci retracement level

YFI dump or rallyBearish head and shoulders formation endangers YFI. Must hold support at 2btc. but high probability will reach 1.8 but still can be a false breakout or just a wick. Target of heads and shoulders is 0.04 btc.
If prices bounces or consolidate of 2btc, price will form a double bottom formation and star ascending completing a W.

Yearn.Finance (YFI) Losing Momentumprice formed a head and shoulder pattern
If bears will able to take a control and neck line broken
declining price to supports marked with dash line available
failing always possible,in this case price can got to 261.8 fibo extension level
If this signal failed.
for now, we face with three consecutive black candle which can leading to bearish price action
(Almost look like three black crow pattern)
RSI entered the neutral area and MACD is prevailingly bearish
Don't forget : "Plan your trade and trade your plan."
GOOD LUCK

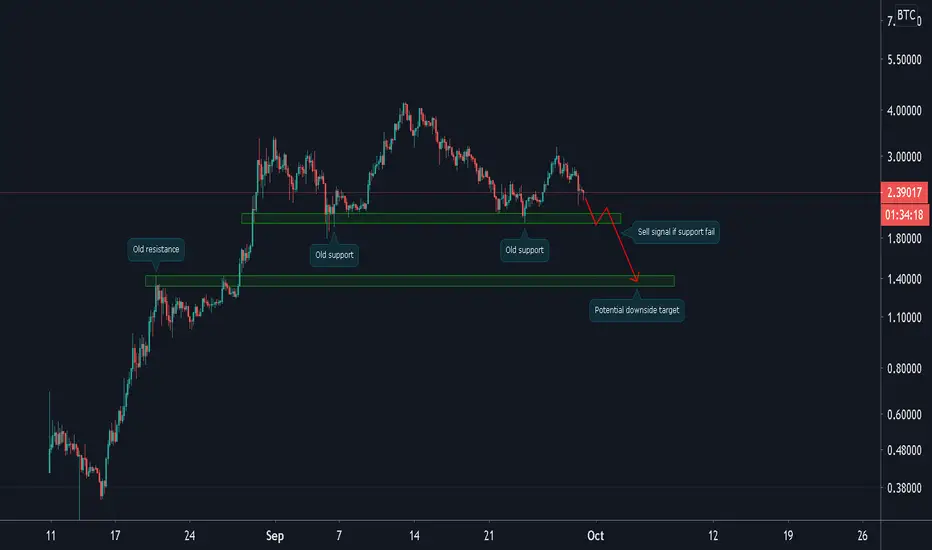
YFI/BTC (Key Area of Support Retest?)💎Technical Analysis Summary💎
BINANCE: YFIBTC
-YFI unable to break the 3 BTC resistance area
-It is now going back to a previous key area of support
-With this, we can see a potential Bearish H&S pattern
-If you are looking to play Short position
-I recommend to Sell once the key support failed
-The downside target is 1.4s BTC range
``````````````````````````````````````````````
Trading Involves High Risk
Not Financial Advice
Please Exercise Risk Management
``````````````````````````````````````````````
If You Like My Daily Published Ideas
A little Help By Supporting My Channel
Through Leaving A Thumbs Up, Comment & Follow
Happy Trading! --> Thank You! :)
``````````````````````````````````````````````
$YFI - long legged doji forming on the weeklyLooks like a long-legged doji on $YFI weekly chart.
$YFI just touched the support again. I'd consider this a pretty good long entry.
As ever, dependent on BTC behaving itself.


YIFI - GOING BYE BYE ???Yifi is in a well overdue correction already and im pretty sure this H&S that is pretty clearly forming will see it going back down to about... 1.3 BTC
Im not getting involved but "What goes up, Must come down.."

YFI an absolute beastBottomed at the support of a rising channel with bullish divs. Not necessarily straight up, can go much higher with time then depicted on the chart.

YFI Next Target Mapped At 37%, Up To 114%By the request of many, here we have the next target for YFIBTC.
First, we saw prices moving below EMA10/50 on the retrace.
Now, prices are moving back up...
The trading volume is starting to increase...
The MACD and RSI are clearly starting to curve.
Expect YFI to print some additional growth.
If support breaks, the red arrow comes into play.
Namaste.

$YFI - quick chart update - needs to break that resistance$YFI update on my previous chart. Needs to break that resistance.
Would potentially buy that support again with a tight stop - obviously a 3rd touch isn't great, but this still has a massive DeFi narrative behind it.

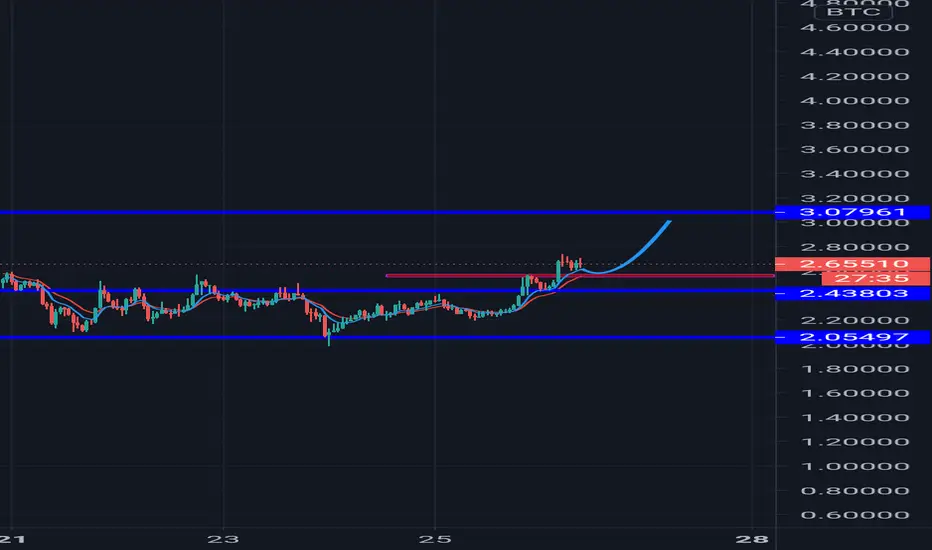
LongLooking for a some relief on YFI, if it finally manages to break through 2.40460 btc resistance.
Currently sitting on 61.8% fib level & horirzontal support, while this area holds, scenario is active.
The market is always interesting, unexpected and risky. No one knows for sure what will happen. Technical analysis only aims to find the advantage in translation. Warning: Do not risk more than 1% of your account in any trading orders.
Idea is not the financial advice!

YFIBTC FAST BUY NOW $CRYPTO
Welcome Traders >> We Have Here Opportunity And Direction For $YFIBTC
! Tools Details On Chart !
♦️ We Have Trend Area
♦️ We Have Fibonacci Area ( Target )
📚 Vision 📚
🔷 The Price Break Out Trend And Now Going To Fibonacci Area And It,s Our First Tp 🔷
♠️ Stop Lose Close 4H Candle Down Trend
!! Please Take care Trading Is Very Risk Don't Risk On Any Position
$CRYPTO

YFIBTC - Long - Potential 47.30%YFIBTC - Long - Potential 47.30%
Enter- 2.10779
TP1- 2.33209
TP2- 2.54392
TP3- 3.07975
SL- 1.74641
Happy Trading! Interesting pitch on YFI as it crosses the 200 moving average! Let us know how you get on!
