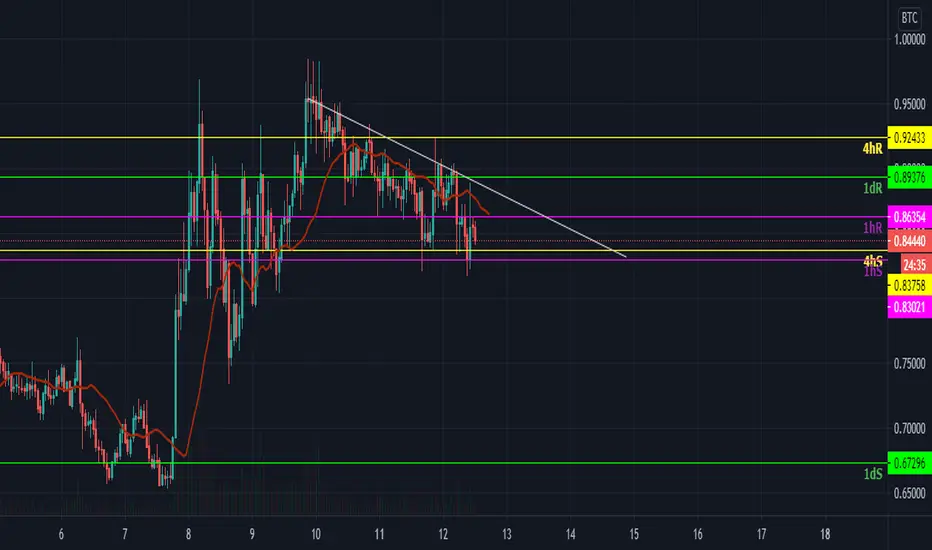
$YFI, If the entire Alts market is moving up, #YFI will move up$YFI
Volume increasing as its testing the 1st important resistance on the way up at ~1BTC
Waiting for a flip at current level as signal of continuation
Bot took an entry on 3commas_io (20%+ up atm)
If the entire Alts market is moving up, #YFI will move up as well
YFIBTC trade ideas


Crypto|YFI/BTC|Long and shortLong and short YFI/BTC
Activation of the transaction only when the blue zone is fixed/broken.
Working out the local support and resistance levels of the triangle.
The "forecast" tool is used for more noticeable display of % (for the place of the usual % scale) of the price change, I do not put the date and time of the transaction, only %.
The breakdown of the upper blue zone - long.
Breakdown of the lower blue zone - short.
Working out the stop when the price returns to the level after activation + fixing in the red zone.
Blue zones - activation zones.
Green zone - take zone.
Red zone - stop zone (S-SL short stop, L-SL long stop).
Orange arrows indicate the direction of the take.
Red arrows indicate the direction of the stop.

Yearn.finance (YFI) Consolidates Further, Still Bullish!Since my chart on 9-Jan., shared below, YFIBTC (Yearn.finance) continues with its bullish consolidation.
Previous chart:
We can see the bullish bias on this chart as prices continue higher now challenging the EMA50 magenta line.
We could see two scenarios mainly develop here:
1) We could see prices moving straight up if EMA50 is easily taken out.
2) On a second note, we might get a retrace at EMA50 follow by higher prices.
This is the bullish perspective we are looking at.
Any trading within the purple trendlines and the bulls have the upper hand.
If prices break and close below the last low, we can expect to see lower prices.
Thanks for reading.
Namaste.


YFIBTC is inside a bullish pennant 🦐$YFI.X is testing the daily resistance. IF the price will have a breakout and turn the current resistance into new support, According to Plancton's strategy (check our Academy), we can set a nice order
–––––
Follow the Shrimp 🦐
Keep in mind.
🟣 Purple structure -> Monthly structure.
🔴 Red structure -> Weekly structure.
🔵 Blue structure -> Daily structure.
🟡 Yellow structure -> 4h structure.
⚫️ Black structure -> <4h structure.
Here is the Plancton0618 technical analysis, please comment below if you have any question.
The ENTRY in the market will be taken only if the condition of the Plancton0618 strategy will trigger.


YFI UP ONLY (10R)Started accumulating YFI in this range, with bids down to $21,000.
BTC pair has reclaimed an important historical level, and currently sitting right on support.
USD pair momentum has already turned up on the 1H and 2H, and will soon also turn green on the 3H and 4H if trend continues into the larger time frames.
Avg Entry: $22,444
TP1: $43,996
TP2: $66,532 (1.618 fib)
SL: $18,000


Yearn.finance (YFI) vs DFI.Money (YFII) | Chart AnalysisThe last time we looked at YFIBTC and YFIIBTC both pairs/charts were moving together... Basically the same but this is not the case anymore.
While DFI.Money (YFIIBTC) went on to print a lower low and is yet to cross above EMA10, YFIBTC is in a better position as you will see next.
(You can find the full YFIIBTC chart on the related trade ideas below).
Yearn.finance chart analysis by Alan Masters
Here we have a clear higher low when we compared 5-Nov. with 3-Jan.
Price is already trading above EMA10 and aiming to close above EMA21 today.
The trading volume has been green for the past 3 days.
Bullish cross on the MACD is young but clear and the RSI above 50 gives everything away.
The bulls are now in control of this chart, the green arrow signaling higher prices is what we expect next...
WAIT! Remember, things can always change.
So make sure to do your own research, use a stop-loss or build a plan/strategy before you trade.
This is Alan Masters.
Thanks a lot for your support.
Namaste.


YFIBTC - BreakOut Happening Now - 120% Gains Incoming? This is not financial advice - I am a noob and I am just learning TA. Leave a comment if you have anything to correct.
Looks like YFIBTC is breaking out of a long term wedge with some reasonable volume. Gaining against BTC already, showing all signs of turning for the upside. MACD, RSI, Volume, OBV+MA starting to trend together.
In the longer term - 80% - 120% gains seem likely. In the short term - we are already seeing a +20% day - but a trade to keep an eye on and look for a good entry.
Couple of interesting points on the chart:
50 MA and major resistance around 1.00-1.05 - watch this point for a true breakout - would show strength if we can close above these levels.
If we continue the uptrend and break 1.05 - next levels to watch:
1.20
1.37
My targets:
~1.40
~1.64
~2.05


