YFI - time to bounce upYFI is still in accumulation range with pattern similar to XRP (difference is that XRP range was slightly rising) and is sitting at RSI diagonal support line. I am expecting bounce up to break fibb 0.382 S/R range and push for fibb 0.886 range (like some alts already did). Note: from current level
Key stats
About Yearn.Finance
Related coins

YFIUSD 1W updateOk. If historic trend pattern continues....would expect sideways movement between low 4k and mid 5k with possible spike to 10k-ish possible (6-7 months based on past performance?) in the mean time. Would consider entry points below 5K to be reasonable to HOLD for long term profit taking as low 4K su
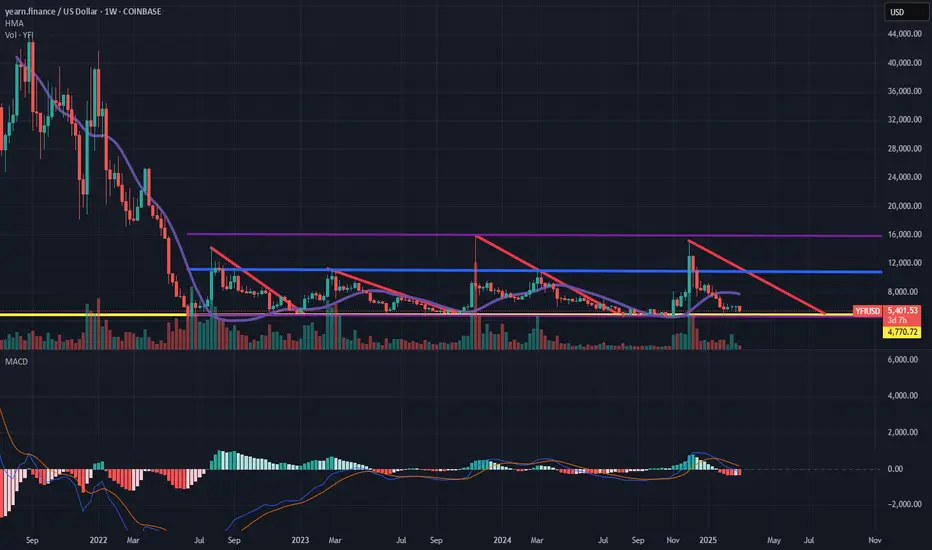
YFI simple tradeEasy enough. Breakout and re-test of what was previously a resistance now becoming support. Meets the 3:1 reward/risk criteria.

Look up!True story there's not enough YFI for everyone and it hit 90k before BTC just saying.. 🤷♂️
"You know yfi and btc have different supply/market cap scenarios right???"
"Ya, but... but.. but.." BOOM
Yahh ummm Number still go up bra! it don't matter to the memeholics so then why should I care

YFIUSD: Repeating descending triangle patternAs AlanSantana so keenly observed and was spot on in the analysis previously posted on TV...YFIUSD looks to be repeating this pump and dump descending triangle pattern.
Watch again for breakout once it approaches the descending resistance line again.
Will follow.
Good luck traders!

YFI looking great for a (+90%) YFI is passing the $11 region with huge bullish momentum it is above vwap from 2021 and is breaking a consolidation for almost 2 years that could result in +90% increase up to $22.200,00 mark, the targe is in confluency with fibonacci levels, monthly level, big order block region and the value area

YFI Ready to break out?simple cup and handle, nothing fancy figure worth sharing, thanks for stopping by, good luck!!

YFIUSD - Incredible Alt SeasonBased on the last bull run I expect YFI to out perform BTC and price to move Higher than anything BTC can attain.
The up move might look very aggressive (it does) But I do expect huge gains on this alt
Daily timeframe
1M ??? Or am I losing it

Yearn.Finance (YFI)Yearn finance provides promising features for staking and yield farming. Anyway, YFI is currently oscillating in a consolidation zone shaped like a triangle. Let's see if YFI can break this triangle upward or not.

YFI will riseYellow oscillation range triangle, support position at the lower boundary is expected to rise and break through the upper boundary in the future

See all ideas
Summarizing what the indicators are suggesting.
Oscillators
Neutral
SellBuy
Strong sellStrong buy
Strong sellSellNeutralBuyStrong buy
Oscillators
Neutral
SellBuy
Strong sellStrong buy
Strong sellSellNeutralBuyStrong buy
Summary
Neutral
SellBuy
Strong sellStrong buy
Strong sellSellNeutralBuyStrong buy
Summary
Neutral
SellBuy
Strong sellStrong buy
Strong sellSellNeutralBuyStrong buy
Summary
Neutral
SellBuy
Strong sellStrong buy
Strong sellSellNeutralBuyStrong buy
Moving Averages
Neutral
SellBuy
Strong sellStrong buy
Strong sellSellNeutralBuyStrong buy
Moving Averages
Neutral
SellBuy
Strong sellStrong buy
Strong sellSellNeutralBuyStrong buy
Displays a symbol's price movements over previous years to identify recurring trends.
Curated watchlists where YFIUSD is featured.

DeFi Tokens: Finance 2.0
24 No. of Symbols

ETH-based crypto: Find your utility
38 No. of Symbols

Up-and-coming crypto: New kids on the block
30 No. of Symbols
See all sparks
Frequently Asked Questions
The current price of Yearn.Finance (YFI) is 5,638.800000 USD — it hasn't changed in the past 24 hours. Try placing this info into the context by checking out what coins are also gaining and losing at the moment and seeing YFI price chart.
The current market capitalization of Yearn.Finance (YFI) is 190.59 M USD. To see this number in a context check out our list of crypto coins ranked by their market caps or see crypto market cap charts.
Yearn.Finance (YFI) trading volume in 24 hours is 15.37 M USD. See how often other coins are traded in this list.
Yearn.Finance price has risen by 6.00% over the last week, its month performance shows a 6.43% increase, and as for the last year, Yearn.Finance has increased by 14.12%. See more dynamics on YFI price chart.
Keep track of coins' changes with our Crypto Coins Heatmap.
Keep track of coins' changes with our Crypto Coins Heatmap.
Yearn.Finance (YFI) reached its highest price on May 12, 2021 — it amounted to 95,000.000000 USD. Find more insights on the YFI price chart.
See the list of crypto gainers and choose what best fits your strategy.
See the list of crypto gainers and choose what best fits your strategy.
Yearn.Finance (YFI) reached the lowest price of 4,038.890000 USD on Jun 18, 2022. View more Yearn.Finance dynamics on the price chart.
See the list of crypto losers to find unexpected opportunities.
See the list of crypto losers to find unexpected opportunities.
The current circulating supply of Yearn.Finance (YFI) is 36.65 K USD. To get a wider picture you can check out our list of coins with the highest circulating supply, as well as the ones with the lowest number of tokens in circulation.
The safest choice when buying YFI is to go to a well-known crypto exchange. Some of the popular names are Binance, Coinbase, Kraken. But you'll have to find a reliable broker and create an account first. You can trade YFI right from TradingView charts — just choose a broker and connect to your account.
Crypto markets are famous for their volatility, so one should study all the available stats before adding crypto assets to their portfolio. Very often it's technical analysis that comes in handy. We prepared technical ratings for Yearn.Finance (YFI): today its technical analysis shows the buy signal, and according to the 1 week rating YFI shows the neutral signal. And you'd better dig deeper and study 1 month rating too — it's sell. Find inspiration in Yearn.Finance trading ideas and keep track of what's moving crypto markets with our crypto news feed.
Yearn.Finance (YFI) is just as reliable as any other crypto asset — this corner of the world market is highly volatile. Today, for instance, Yearn.Finance is estimated as 3.92% volatile. The only thing it means is that you must prepare and examine all available information before making a decision. And if you're not sure about Yearn.Finance, you can find more inspiration in our curated watchlists.
You can discuss Yearn.Finance (YFI) with other users in our public chats, Minds or in the comments to Ideas.