YFIUSDT 1W AnalysisYFI ~ 1W Analysis
#YFI This is the lowest support block for now. Buy gradually from here with a short term target of at least 20%+ from this support.
YFIUSDT trade ideas

YFI | Long | Yield Farming Support + Spot Demand |(May 21, 2025)YFI | Long | Yield Farming Support + Spot Demand | (May 21, 2025)
1️⃣ Quick Summary:
Yearn Finance is sitting at a key support level and just gave an entry opportunity. With open interest cooling down and price stabilizing, this looks like a solid setup for a cautious long, especially if momentum builds.
2️⃣ Trade Parameters:
Bias: Long
Entry Zone: Around current support – confirming the entry as the level held
Stop Loss: Around 5% below entry to manage risk
TP1: $6,100
TP2: $7,500
TP3: $8,500
TP4: $9,162
Final TP: $11,919
Looking to compound if price climbs steadily—this trade has multi-leg potential.
3️⃣ Key Notes:
✅ Price held a key support zone and is reacting positively—bullish bias from here.
✅ Yearn simplifies DeFi by automating yield farming—strong utility for passive DeFi users.
✅ YFI has no pre-mine, strong community governance, and a suite of yield optimization tools (Vaults, Earn, Zap, Cover).
❌ If BTC or ETH weakens heavily, YFI might not hold—watch macro sentiment closely.
❌ This is a cautious entry—confirm strength before sizing up.
4️⃣ Follow-Up Plan:
If we clear early targets with strength, I’ll look to update this with a compounding plan and new resistance levels.
Please LIKE 👍, FOLLOW ✅, SHARE 🙌 and COMMENT ✍ if you enjoy this idea! Also share your ideas and charts in the comments section below! This is best way to keep it relevant, support us, keep the content here free and allow the idea to reach as many people as possible.
Disclaimer: This is not a financial advise. Always conduct your own research. This content may include enhancements made using AI.

YFI Cup and HandleWe can see a Cup and Handle on YFI (AGAIN)
Profit would be 20% up, if not higher to 14000$.
Check out my last YFI analyse, as it follows its chart Patterns.
BUT we don't have a rising volume, that one is missing, but worth a try!

YFIUSDT | Long Setup | Fib Reaction | (May 2025)YFIUSDT | Long Setup | Fib Reaction + Triangle Break Potential | (May 2025)
1️⃣ Short Insight Summary:
YFI is showing a small triangle correction, reacting well to key Fibonacci levels around $5,000–$5,135. Momentum suggests another leg up could be forming, especially if VWAP holds and buyers step in again.
2️⃣ Trade Parameters:
Bias: Long
Entry: Around $5,830 after correction confirms
Stop Loss: $4,862
TP1: $7,475
TP2: $8,561
TP3: $9,162
TP4: $11,919
TP5: $27,179
Partial Exits: Start locking profits at TP1 and manage the rest as structure develops
3️⃣ Key Notes:
✅ A lot of buying took place between $5,000 and $5,135 — solid Fibonacci support zone
✅ We're close to previous short-term highs, and money flow (on 30m chart) shows temporary outflow but with potential for re-entry
✅ A larger correction might still play out, so I'm waiting for a clean setup and VWAP reaction confirmation before entering
✅ If VWAP fails, there's a strong lower VWAP zone acting as a secondary support — worth watching closely
4️⃣ Optional Follow-up Note:
I’ll be monitoring for a cleaner breakout after this triangle finishes. Updates will follow if structure shifts or entry becomes invalidated.
Please LIKE 👍, FOLLOW ✅, SHARE 🙌 and COMMENT ✍ if you enjoy this idea! Also share your ideas and charts in the comments section below! This is best way to keep it relevant, support us, keep the content here free and allow the idea to reach as many people as possible.
Disclaimer: This is not a financial advise. Always conduct your own research. This content may include enhancements made using AI.

YFI/USDT | Long Bias | Healthy Open Interest | (April 2025)YFI/USDT | Long Bias | Strong Trend + Healthy Open Interest | (April 27, 2025)
1️⃣ Insight Summary:
YFI/USDT is showing a strong and clean uptrend, with open interest supporting the move. No major spot panic selling is detected, and delta flow remains healthy — setting the stage for a potential continuation.
2️⃣ Trade Parameters:
Bias: Long
Entry Zone: Watching for a small correction toward 6,114 or direct continuation toward 7,475
Stop Loss: Below recent liquidity grab zones or local structure lows
TP1: 7,475
TP2: 8,561
TP3: 9,162
TP4 (Hope Target): 11,919
3️⃣ Key Notes:
✅ Trend is clean and strong, backed by fresh open interest — new positions are being added, not closed.
✅ No major spot panic selling detected — the rally looks organic and sustainable for now.
✅ Delta flow remains healthy, supporting the continuation of the bullish momentum.
✅ Liquidity grabs have been aggressive in this market — stop-losses must be respected carefully.
❌ Risk comes mainly from sudden market maker liquidity sweeps — sharp moves can happen without warning.
4️⃣ Follow-up:
I will continue to monitor YFI/USDT closely and will post updates if we get the correction toward 6,114 or if price directly breaks higher toward the key targets.
Please LIKE 👍, FOLLOW ✅, SHARE 🙌 and COMMENT ✍ if you enjoy this idea! Also share your ideas and charts in the comments section below! This is best way to keep it relevant, support us, keep the content here free and allow the idea to reach as many people as possible.
Disclaimer: This is not financial advice. Always conduct your own research. This content may include enhancements made using AI.

YFIUSDT buy in the pink area and sell on 44000hello dear friends u can get some profits by buy and sell yfi see the chart and it is the best analysis for yfiusdt chart
like if you get profit by the analysis

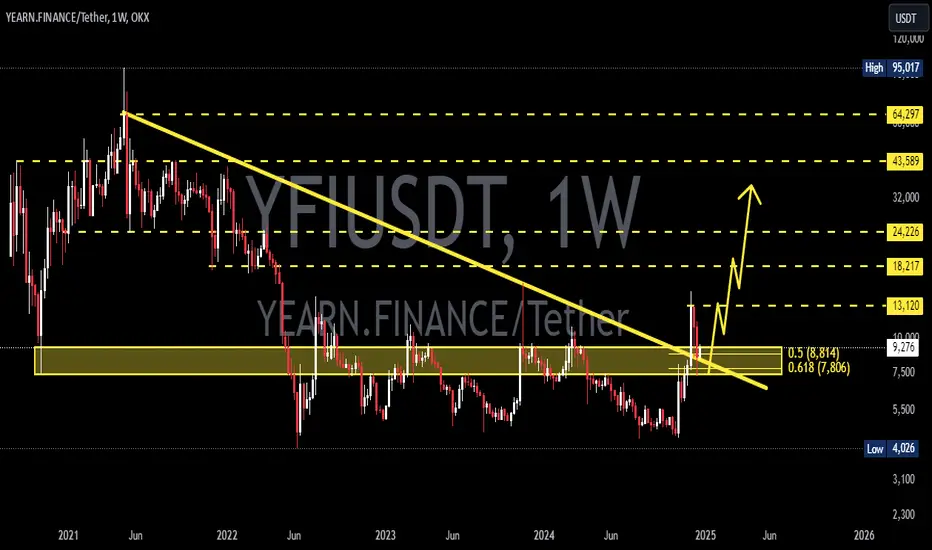
Yearn-Finance: Your Altcoin Choice (S2)I will start with the long-term linear chart and then move to the main chart above. This is a theme that I've been repeating across multiple charts trying to show that the market is trading at bottom prices.
The linear chart also shows clearly where a pair stands, in this case, trading at bottom prices.
I am trying to show, based on facts and market data, that the Altcoins market is not really in a bad bull market but rather in a neutral, long-term sideways period from where a bull market can start.
After a bull market comes a bear market, after the bear market we have a transition period which is the sideways market. Then a new bull market can start.
This is YIFUSDT (Yearn-Finance) long-term:
Of course there are ups and downs, swings, within this sideways period but this nothing compared to bull market action. In a bull market, we will have straight up, long-term higher highs and higher lows; maximum growth accompanied with huge bullish momentum and new All-Time Highs.
When the candles become almost invisible and flat, it means the market is neutral and sideways, the transition phase. From this a new bull market can develop and that's exactly what will happen. 2025/26. We are early, it will be great.
» Yearn-Finance
Just now, 7-April 2025, YFIUSDT produced a long-term double-bottom, hitting the lowest price level since June 2022, a major development.
— June 2022 marked the bear market bottom.
— April 2025 is likely to mark the end of the transition phase, the last low before the next major bull market.
The only possible way to describe what is happening now is only as an amazing opportunity, something not seen before for this pair and something seen only once every four years within the Cryptocurrency space.
That's it. We are in the buy-zone, accumulation zone, long-term support; time to buy we are set to grow long-term.
Growth potential is huge and tremendous and this is valid for all Cryptos, most of them. This is a generalization of course, each chart/pair needs to be considered individually because not everything will grow.
YFI has been around for a long while but bullish only for six months, between November 2020 and May 2021.
Here is one piece of evidence why I think this bull market will go beyond 2025, possibly.
By May 2021, YFIUSDT peaked, All-Time High and started a major bear market. Four years later, YFIUSDT is trading at bottom prices. A bull market cannot end in 30 days, a single month, since this pair is trading at bottom prices, it means it will grow for months and months to come. If it repeats the same pattern as in 2021, that would be at least 190 days going up. Last time it grew more than 1,150%. This time it can be anything, but prices are much lower today compared to the start of the previous bullish phase.
If strong bullish action starts in May, six months growing would put a new All-Time High in November 2025. If there are two waves rather than one, it can go beyond 2025 until 2026.
This pair can easily produce 10-11X, but there can be more.
If the bu-action goes into 2026, we can easily get 20-30X. If the action stops in late 2025, the potential can be capped at 11X. These are just projections, the market tend to surprise and always go beyond all expectations. The end result can be much different to anything we project or expect.
Prepare to be surprised.
The best is yet to come.
Namaste.

YFIUSDTYearn Finance has reached it's support zone and we are expecting it's price to reach higher prices in the near future.
By sharing your ideas in comment will help us understand financial markets better

YFIUSDT 1WYFI ~ 1W Analysis
#YFI Buy gradually from here with a short -term target of at least 20%+. This is a strong support for now.

YFITo me YFI it is the next BTC.
with only 34k tokens in circulation and listed on top t1 exchanges, such projects are diamonds and same it is YFI.
very curious to see what price it would reach in full bull market, if never comes ???
i bet 1$ that it would catch 150k if not more
this is my personal opinion, do not invest unless you are pretty sure on what you do.
please do your own research.

YFIUSDT 1WYFI ~ 1W Analysis
#YFI This is the lowest support for now. Buy from here if you still have a Conviction on this coin with a minimum target of 20%+

YFI Daily chart analysisYFI Daily chart analysis
my way is to trade the charts and my this chart show its perfect time to enter the trade rather then enter at fomo time a perfect chart
enjoy support my idea to reach more community
cheers targets entry exit all are clear

YFIUSDT 1WYFI Update ~ 1W
#YFI So far it is still maintaining its Bullish structure. and the current price successfully retested this rupport line + this Golden ratio. Buy gradually from here with a target of at least 20%+ from here.
YFIUSDT.4HThis analysis of the YFI/USDT pair on the 4-hour timeframe offers a detailed examination of the current technical landscape. My focus is to decipher key trends, potential directions, and strategic price levels that could influence trading decisions.
Price Action and Trend Analysis:
YFI has been undergoing a notable downtrend, with a significant retracement from the local high. The price has broken through previous support levels, suggesting a bearish outlook in the short term. Current market price is near $8,926, which is close to testing the next support.
Key Levels to Watch:
Resistance Level (R1): $12,567 marks the nearest resistance. This level formerly acted as a support, and its retest could serve as a crucial barrier for any bullish recovery.
Support Levels (S1 and S2): The immediate support is at $7,984. A break below this could lead the price toward the secondary support at $5,917, indicating a potential acceleration in bearish momentum.
Technical Indicators:
MACD: The Moving Average Convergence Divergence (MACD) is currently in the bearish zone with the histogram increasing in negative territory. This suggests that bearish momentum is intensifying.
RSI: The Relative Strength Index (RSI) is approximately 36, which is nearing oversold conditions. This might indicate that the selling pressure could pause or a potential reversal if it reaches more extreme levels.
Volume and Market Sentiment:
The market volume appears to align with price movements, supporting the current trend's legitimacy. Market sentiment leans heavily bearish, as reflected by price actions and technical indicators.
Conclusion and Trading Strategy:
Given the observed technical factors, YFI appears to be in a bearish phase with potential for further declines. Traders should watch the $7,984 support level; a confirmed break below this could open up possibilities towards $5,917. Conversely, any bullish reversal would need to reclaim $12,567 to shift the intermediate trend. Caution is advised, as bearish momentum is strong, and it is crucial to look for confirmation signals before taking any significant positions. Risk management should be a priority, considering the potential for heightened volatility.
Summary:
This analysis suggests preparing for further potential downtrends but remaining vigilant for signs of reversal near key support zones. It's essential to monitor incoming trade volumes and price reactions at these critical levels to adjust strategies accordingly.

yfiTo reach the upper lines and break this green box, it must break the two red boxes. Check for buys at the blue dots.

YFIYFI a pioneer in the DeFi space, has established robust support and resistance levels within its current range-bound structure. I’ve set an alert at the resistance level to capitalize on a breakout opportunity. With a strategic entry, I’m targeting a potential 140% upside, contingent on volume confirmation and market momentum

YFIUSDT Falling Wedge Breakou!YFIUSDT technical analysis update
YFI's price is breaking out of a falling wedge pattern after 325 days of formation. On the weekly chart, the price is bouncing from major bottom support, which can be considered bullish for YFI
Regards
Hexa

YFI Cup $ Handle breakoutFinally YFI starts moving after breaking his lower lows with a cup and handle formation.
I drawed the possible first goal to reach at a usual C & H. Also we touched the old high. If we break it we would also break the old structure so we can get higher highs soon.
Excited to watch YFI more in the future. Good Volume coming in

Yearn. Finance ( YFI)YFI usdt Daily analysis
Time frame daily
Risk rewards ratio >2.5 👈👌
Target 11515 $

YFI is another #DeFi project which is still in accumulation phas💰 #YFI is another #DeFi project which is still in accumulation phase🧐
TSXV:YFI spent 896 Days of accumulating inside a falling wedge formation🔥
At least I expect the retest of the Major Supply Zone📈
🎯1 Target - 17940$
🎯2 Target - 23575$
🎯3 Target - 30040$
🎯4 Target - 45600$

YFI Skyrockets to Massive 900% Gains with RisologicalYearn Finance (YFIUSDT) delivered remarkable profits on the 4-hour timeframe, leveraging the precision of the Risological swing trading indicator. The trade capitalized on a strong bullish momentum, hitting all defined targets with ease.
Key Levels:
TP1: 5117 ✅
TP2: 5587 ✅
TP3: 6057 ✅
TP4: 6348 ✅
Technical Analysis:
The trade initiated at an entry price of 4827, confirmed by strong bullish cues from the Risological trend line. These indicators consistently highlighted upward momentum, guiding the trade through multiple profit-taking levels.
The stop-loss, placed at 4592, provided a secure cushion against potential reversals, although the bullish trajectory remained uninterrupted. YFI demonstrated a steady ascent, achieving all targets within the anticipated time frame.
This setup underscored the efficacy of the Risological swing trading indicator in capturing and maximizing profits during a trending market.

YFI Looking Bullish#CryptoWhale100Billion Alt Coin Analysis: YFI
🚀 Bullish Trend Alert for YFI! 🚀
My analysis indicates that YFI may experience a bullish trend in the medium term. The current price is hovering around the support level of $5300. If it manages to hold this level, we can expect the price to rise to the next resistance level at $8400 and potentially break out.
🔍 Technical Indicators:
RSI: Currently in the oversold region, indicating that ATOM is undervalued and may experience a bullish reversal soon.
MACD: Showing signs of a bullish crossover
Buy: At the current price or lower.
Hold: Maintain the position and consider adding more if the price breaks through the resistance level.
Stop-Loss: If the price drops below the support level of $5000, consider buying or setting stop-loss orders.
📈 Your Thoughts?
Shoot me a message with your Technical Analysis to share your thoughts and trading strategies. Let's discuss where ATOM might go next!
👍 Press the Thumbs Up and leave a comment below with your ideas on ATOM's future movements.
Follow and like! I'll keep making more of these charts.
Thank you for the support!
🔗 Previous Chart Links for Reference Below
#CryptoWhale100Billion #YFI #CryptoAnalysis #TradingStrategy #BullishTrend #TechnicalAnalysis #CryptoCommunity

YFI Will it pass 100k?YFI very volatile due to low supply. When it moves it moves big. Normally YFI will pass BTC prices.
