YFIUSDT AnalysisHello friends.
Please support my work by clicking the LIKE button(If you liked).Thank you!
Everything on the chart.
open pos: market and lower
target: 42k - 46k - 50k
after first target reached move ur stop to breakeven
stop: ~33000(depending of ur risk). ALWAYS follow ur RM .
risk/reward 1 to 3
Good luck everyone!
Follow me on TRADINGView, if you don't want to miss my next analysis or signals.
It's not financial advice.
Dont Forget, always make your own research before to trade my ideas!
Will be very APPRECIATE FOR UR DONAT/coins :)
Open to your questions or suggestions(Looking for investors!).
YFIUSDT trade ideas

YfiusdtTarget for hold can grow 300%
Can pay reward than this idea wallet YFi:
0x2430af6118c604030851ab92745f5243acfa4740

Yearn finance Yearn finance has been on correction wave (wave 4) using Elliot Wave principle. The last wave will soon begin. The target is being stated on the chart.... Send it 🚀 🚀 🚀


YFIUSDTThis is my bullish perspective on this pair, I would personally dedicate a buy order to this one.
-NFA

YFIUSDTYFIUSDT is in the correction phase. There is a chance that the price will rebound.
Waiting to buy in the blue zone, target 62620

YFI/USDT long p.s my first ideaBINANCE:YFIUSDT
yfi a fairly new project, but with great support ,confirmed for long after a long time can go to nearly 40k
trade on your own research .just my idea

YFI is ready for Breakout Buy the coin when no body is buying it and when no body is talking about it. Dont buy anything which is already hyped up and is already 10x and 20x up.

🆓yearn.finance (YFI) Nov-9 #YFI $YFIYFI has conquered the $34000 zone and it can continue to advance towards the $42000, $52000 and $64000 zones in the near term. But if it loses the $34000 zone again, we can continue accumulating it at the $30000 zone
📈RED PLAN
♻️Condition : If 1-Day closes ABOVE 34000$ zone
🔴Buy : 34000
🔴Sell : 42000 - 52000 - 64000
📉BLUE PLAN
♻️Condition : If 1-Day closes BELOW 34000$ zone
🔵Sell : 34000
🔵Buy : 30000
❓Details
🚫Stoploss for Long : 10%
🚫Stoploss for Short : 5%
📈Red Arrow : Main Direction as RED PLAN
📉Blue Arrow : Back-Up Direction as BLUE PLAN
🟩Green zone : Support zone as BUY section
🟥Red zone : Resistance zone as SELL section

YFI longYFI has been accumulating and compressing in price since May 2021 and is ready for a big move over the coming weeks/ months.
The YFI/BTC chart is also at support on the weekly.
There is a bull flag on the 4HR and breaking of the flag is good entry confirmation.
TP Zones marked.

YFI the crown jewel of DeFi to rise >$40K will get you $50KYFI has fallen and left to be dead in the waters. It is slowly regaining itself to stand back up again approaching a key level to clear $40K
32K is acting clearly a solid support and a foundation for next explosive move up
Target-1 $41,000
Target-2 $50,000

YFIUSDT Technical Analysis⏳ Spot
💎 YFIUSDT has broken above the major resistance and the triangle. After a Bullish move we expect that it goes down for a Pullback and a retest. After that We can open our buy trade
🌐 Tradingview
💵 Invest Only 5% of your Portfolio
🎳 Entry Now or at 33846.61 to 35188.62
☕️ TP1 36640.17
🍺 TP2 39625.45
🍻 TP3 42912.00
🍾 TP4 46362.87
🍷 TP5 50000.00
🍸 TP6
🍹 TP7
🎁 TP8
🚫 SL 32121.18 to 33846.61
Good Luck 🎲
Check the Links in Description and If you LIKE this analysis, Please support our page and Ideas by hitting the LIKE 👍 button. ❤️ Your Support is really appreciated! ❤️
Traders, if you have your own opinion about it, please write your own in the comment box. We will be glad for this.
Feel free to request any pair/instrument analysis or ask any questions in the comment section below.
We will have more FREE forecasts in TradingView soon
Have a profitable day 😊👍🏻

YFI parallel trend lines potential to increase 100% to 200%#YFIUSDT
$YFI is near an ascending support, as it is so undervalued so if price hold this support and break out from resistance zone, then can head up toward parallel trend lines to touch $69160 and in long term potential to touch $106000 and $123300.

YFIU/USDT
Signal Trade spot form Binance YFIUP/USDT
YFIU/USDT Entry 34671.29
TP1 35482.50
TP 36517.80
SL 34153.99
...........................................................................
YFIUP/USDT EntryBUY 0.2382
SELL LIMIT 0.2540
A team of more than 20 people monitors Crypto currencies, signaling that everyone who sees it can buy it.
The hoondax team has smart software tools. Our team will continue to transmit this signal.
Introducing Sport Trading in the Binance Market
Thank you

YFIUSDTHello Crypto Lovers,
Mars Signals team wishes you high profits.
We are in a daily time frame.
As you can see, the price is moving close to the resistance line, and if it breaks and stabilizes above that, it can push to gain higher prices. We also see the bat harmonic pattern.
But if it can not break the resistance line with power, it may move to its support line.
Warning: This is just a suggestion and we do not guarantee profits. We advise you analyze the chart before opening any position.
Wish you luck

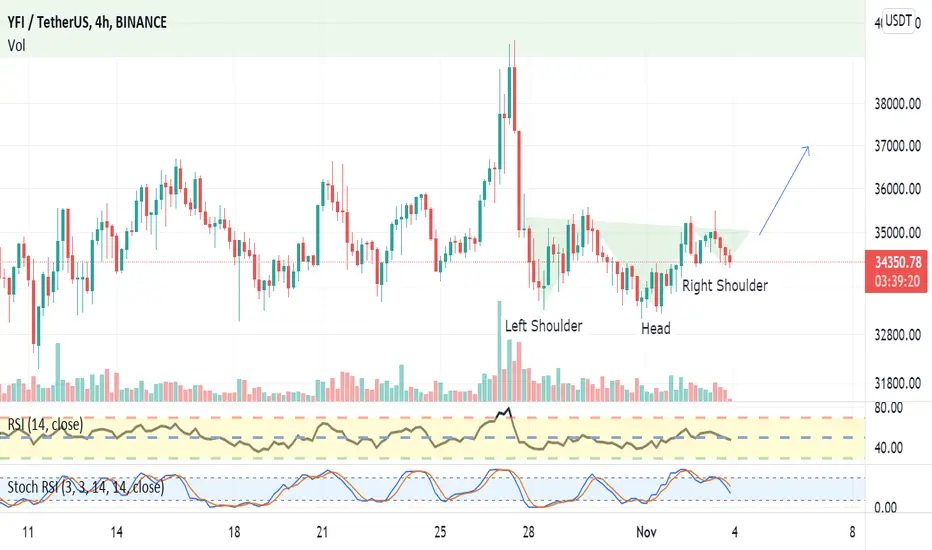
CRYPTO - YFI - Inverse Head and Shoulders pattern. Get longCRYPTO - YFI - Yearn Finance. Inverse Head and Shoulders pattern. This is a reliable reversal pattern people. The right shoulder is almost complete. There may be a little more downside that could almost create a triple bottom but I think the strength in the RSI is indicator that now is the time to get long.
Volume - Not much doing which makes me sad. Would like to see bigger green candles on the ups.
RSI - Was 40 on the head and it 47 on the right shoulder. Selling is getting weaker which points to a move sooner rather than later.
STO RSI - Fast Stochastic RSI is 37. I would it expect it to be closer to 20 on the turn which means you may be able to get it a tiny bit cheaper. Round the 40K mark but not worth the risk of missing.
Target 1 = 36900.,
Stop loss = 33,100.
YFI up to something or is it just me being paranoid ?few month ago => BTC 60K = YFI 93K
now => BTC 64K = YFI 35K ? seriously ?? R U KIDDING ME ?
YFI has a very good correlation with BTC price based on my experience . i can call it undervalued and underestimated ; it is also a very good an big project .
on daily time frame price chart has broken the recent down trend .
there is a very huge bullish behavior appearing on YFI/BTC pair on weekly time frame as you can see blow

YFIUSDT - Long - Potential 25.75%YFIUSDT - Long - Potential 25.75%
Exchanges: KuCoin, Binance, FTX, Huobi.pro
Signal Type: Regular (Long)
Entry Zone:
33068.65 - 34826.11
Take-Profit Targets:
1) 36488.67
2) 39474.04
3) 43747.59
Stop Targets:
1) 30761.56
Trailing Configuration:
Entry: Percentage (0.0%)
Take-Profit: Percentage (1.0%)
Stop: Breakeven -
Trigger: Target (1)

YFIUSDT Technical Analysis⏳ Spot
💎 YFIUSDT has broken above the symmetrical triangle. After the retest and rejection from the resistance zone it will continue the Bullish move
🌐 Tradingview
🏁 Short & Medium Term
💵 Invest Only 5% of your Portfolio
🎳 Entry at Market or at 35555.00 - 36575.00
☕️ TP1 41868.00
🍺 TP2 44836.00
🍻 TP3 51070.00
🍾 TP4 57333.00
🍷 TP5
🍸 TP6
🍹 TP7
🎁 TP8
🚫 SL 33377.00
Good Luck 🎲
Check the Links in Description and If you LIKE this analysis, Please support our page and Ideas by hitting the LIKE 👍 button. ❤️ Your Support is really appreciated! ❤️
Traders, if you have your own opinion about it, please write your own in the comment box. We will be glad for this.
Feel free to request any pair/instrument analysis or ask any questions in the comment section below.
We will have more FREE forecasts in TradingView soon
Have a profitable day 😊👍🏻

YFI - breakingYFI making a move out of the ascending triangle.
BBWP indicating a renewed expansion phase.
Look for a possible pullback to former resistance around 3678 to hold as support. Set stops just below.

YFI_USDTyfi is breaking ascending triangle , buy here and hold for targets showed in chart , defi in fire .stay tuned

YFI_USDTYFI is breaking ascending channel , buy here and holf for targets which showed chart . defi in fire , don't miss it

YFIUSDT is creating a pennantYFIUSDT is creating a pennant and an inverse head and shoulders. IF the price is going to have a breakout, According to Plancton's strategy (check our Academy ), we can set a nice order
–––––
Follow the Shrimp 🦐
Keep in mind.
🟣 Purple structure -> Monthly structure.
🔴 Red structure -> Weekly structure.
🔵 Blue structure -> Daily structure.
🟡 Yellow structure -> 4h structure.
⚫️ Black structure -> <4h structure.
