YFI/USDT : Breaking resistance zone ! BINANCE:YFIUSDT
Hello everyone 😃
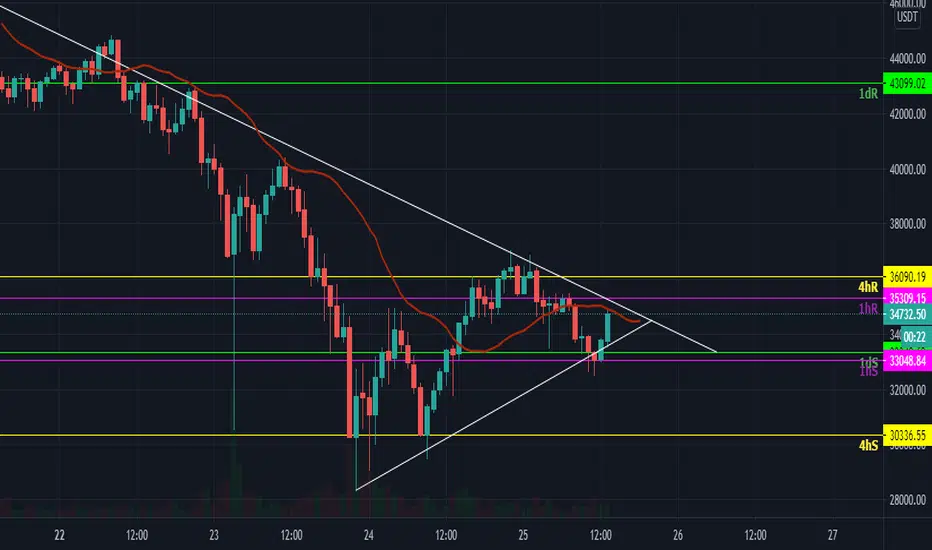
YFI is breaking resistance zone with current candle.
On my side, It can't be this easy for YFI to break but it's very possible !
Volatility had bullish crossover and now, It's moving upward to limited green zone.
We expect a retest above resistance and a hold after it..
After all, It could be great to take some advantage from YFI !
Attention: this isn't financial advice we are just trying to help people on their own vision.
Have a good day!
@Helical_Trades
YFIUSDT trade ideas

YFI long scalpThis is not a financial advice. Always do your own research and always put stoploss in your trade (SL) :) If you want more detailed info how to study and read charts or just need help with some coin, just write to me here personal message, i will try to answer to everybody... i can help you :) all for free, don't worry, BE HAPPY!
If u like the analysis, please feel free to ask any question about this TA or crypto or any coin and also leave a comment or like or share the idea, i really appreciate it because then my work makes sense :) thanks!


YFI usdt is really sufferingMassive drop on the 4h
Even the daily support and resistance is showing in the one hour chart!
SLight move away from the 4h support line.

YFI/USD - $40,000 in range if bullish momentum maintains!YFI has re-tested the support of this nice ascending channel as indicated by the yellow arrows.
So long this holds, I see us moving to 40k quite soon and then possibly set a new ATH when we touch the top of this channel.
YFI is a great buy here and this is also confirmed by the YFI/BTC pair.
Indicators are curving nicely and unless the market takes a new dump, YFI is clear to reach higher levels. Bias remains bullish so long we keep this support.
Like and follow if you liked this idea! Also join my crypto community to stay in touch and watch my technical analysis videos on YouTube. :)


YFIUSDT Hello to you all. Mars Signals team wishes you high profits at all times.
The price is fluctuating inside a rectangle. Now the price is at the bottom.
If it is able to go up and break the upper line of the rectangle, it will go in the direction of the arrow.
Yet if the price does not have enough support to go up, it break to the bottom of the rectangle and go in the direction of the arrow.
Warning: This is just a suggestion to you and we do not guarantee profits.
Wish you luck!

Can YFI reach 60k before BTC?YFI & YFII both lagging behind in this bull run.
Expecting YFI to go higher once BTC stabilizes.

YFI Buy a break setup.YFIUSDT - Intraday - We look to Buy a break of 38083 (stop at 36166)
Daily signals are bullish.
Short term oscillators have turned positive.
A break of bespoke resistance at 38000, and the move higher is already underway.
Price action continued the aggressive move higher and looks for follow through buying today.
Our profit targets will be 43829 and 46888
Resistance: 38000 / 40000 / 42000
Support: 35600 / 34000 / 31500

yearn.finance (YFI) - February 26Hello?
Dear traders, nice to meet you.
"Like" is a huge force for me.
By "following" you can always get new information quickly.
Thank you for always supporting me.
-------------------------------------------------- -----
We have to see if we can get support and climb in the 26467-31948 section.
If you fall in the 26467-31948 section, you can touch the 14927-20530 section, so you need to trade carefully.
The next volatility period is around March 14th.
-------------------------------------------------- ------------------------------------------
** All indicators are lagging indicators.
So, it's important to be aware that the indicator moves accordingly with the movement of price and volume.
Just for the sake of convenience, we are talking upside down for interpretation of the indicators.
** The wRSI_SR indicator is an indicator created by adding settings and options from the existing Stochastic RSI indicator.
Therefore, the interpretation is the same as the conventional stochastic RSI indicator. (K, D line -> R, S line)
** The OBV indicator was re-created by applying a formula to the DepthHouse Trading indicator, an indicator that oh92 disclosed. (Thank you for this.)
** Check support, resistance, and abbreviation points.
** Support or resistance is based on the closing price of the 1D chart.
** All explanations are for reference only and do not guarantee profit or loss on investment.
Explanation of abbreviations displayed on the chart
R: A point or section of resistance that requires a response to preserve profits
S-L: Stop Loss point or section
S: A point or segment that can be bought for profit generation as a support point or segment
(Short-term Stop Loss can be said to be a point where profits and losses can be preserved or additionally entered through installment transactions. It is a short-term investment perspective.)
GAP refers to the difference in prices that occurred when the stock market, CME, and BAKKT exchanges were closed because they do not trade 24 hours a day.
G1: Closing price when closed
G2: Cigar at the time of opening
(Example) Gap (G1-G2)

YFI > 55KYFI is in a short-time ascending channel and can grow to 55K soon
so propose to wait some time to make a good profit from it


YFI usdt - break of formation for YearnDecent rises in the bear market.
EMA is still downtrending.
Will we see it reach those resistance levels though.

YFIUSDT heading to 40k!!!YFIUSDT is currently in a bull flag, we might see a break to 40k soon!! You can trade this with leverage to catch quick profit though.

YFI usdt - Almost a 36% drop in price from its highYFI is suffering in this bear market.
We see slight pushups only to be quashed.
Low trading volume.
Now is a good time to buy, because eventually it gains parity with btc.

YFIUSDT daily with strong bullish movement! New ATHTechnical analysis regarding the price of YEARN FINANCE in relation of dollar Tether for the next scenarios, based on daily movement.
Very strong cryptography with solid principles and bases to position itself over the long term!
Analyzing the current scenario, I believe that you will be able to reach these price levels, making new ATH.
Rising tops / bottoms in the daily period giving us indications of a strong upward trend. Moving Averages taking parallel spacing and that of 34 periods supporting the price ~just look at the graph.
We will see YEARN FINANCE with new maxims in these next moments! (projection of channels using Fibonacci, which he respects a lot)
disclaimer
*** In accordance with CVM Instruction No. 598, of May 3, 2018, Art. 21, I declare that the recommendations of this analysis reflect solely and exclusively my personal opinions and perceptions and that they were prepared independently and autonomously. Not being considered a purchase and/or sale recommendation. ***
Any questions do not hesitate to contact me. I'm happy to be able to help you in the best way I can. 🙏


YFI usdt - Climbing EMA but falling support levelsEMA is climbing on the smaller time frames.
Trading Volume is good. But with this downtrend all support level prices have fell.
