YFIUSDT trade ideas


YFI/USDT DEFI! Watch this one! hasnt taken off yetbuy the break out / retest of the triangle
adam and eve bottom
DEFI dex!!! (uni taken off, is YFI next?)

YFI Breaking Its Crucial ResistanceFrom couple of months YFI is trying to break the level of 40000 and everytime sellers drag YFI from that levels
This time its holding the levels obove 38000 and Chart also looks good woth Bullish RSI and MACD
I am.entering here with 2x
It can reach to 50000 and 60000
DYOR before entering any trade.

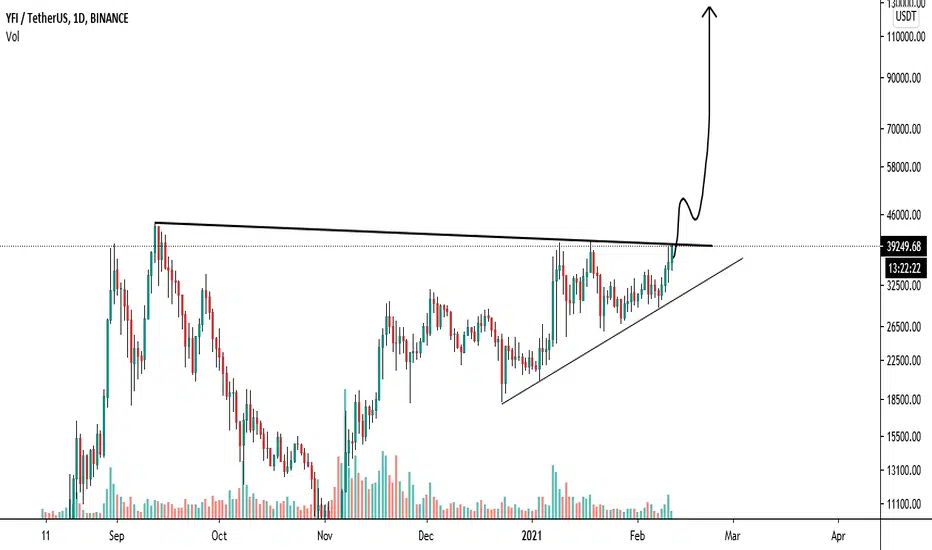
YFI Breakout Setup | YFI All time highYFI cryptocurrency price is ready to break above the trend line.
YFI cryptocurrency token price can move higher and higher after breakout above the 40K.
Buy when price breakout above 39500.
Funny thing about bitcoin price is that YFI will be more expensive than bitcoin in very short time. after breakout above the 44.4K All time high.
Buy below 40000
Stop : Daily close below 25000
Target : 45K , 58K , 70K , 95K , 120K
YFIUSDT - Who invested?preconditions:
-global uptrend
-locally uptrend
-accumulation
-key level
-limit player
Push like if you think this is a useful idea!
Thanks for your support!

YFI / USDT - BRAKEOUT TO 200k this is yfi ,the leader of defi wich started it all. it it will be the first to climb its restiance and fly like a true bluechip ! have fun and see you on the other side.
always use 3 x to avoid ADL


YFI break out soon YFI had its sell off, had its exploit, and increased supply from 30k to 36k. Sold off, now we are looking to go higher. The project team have used the newly minted 6,000 coins to pay anyone who lost money in the exploit (which will be paid back to the project through usage fees). Almost every defi project has seen gains, YFI being the one the started it all is well over due for a major pump.
If break up to upside, next stop 40k (short term) long term 100k)
If it fails to break out, support at 28k

Yfi/USDT - Part 2 - 20% profit/2 Targets. CongratulationHello dear friends.
Congratulations to everyone again who took advantage of this trade.
Thank you for following me.
I ask everyone - observe risk management, money management, do not overstate the lot in the position. Trade with stop loss and be smart about your trade.
I am also mistaken, but I am mistaken, and one bad recommendation leads to big loss - if you do not follow the points that I wrote to you above.
Respectfully all, Your Opptrade

Crypto|YFI/USDT|Long *H.rLong YFI/USDT *High risk
Activation of the transaction only when the blue zone is fixed/broken.
The idea is to work out the resistance level .
* Possible closing of a trade before reaching the take/stop zone. The author can close the deal for subjective reasons, this does not completely cancel the idea and is not a call to the same action, you can continue working out the idea according to your data, but without the support of the author.
+ Maybe right now we will go even lower, then it's okay, the idea is not activated and simply canceled.
The "forecast" tool is used for more noticeable display of % (for the place of the usual % scale) of the price change, I do not put the date and time of the transaction, only %.
Blue zones - activation zones.
Green zones - take zones.
The red zone - stop zone.
Working out the stop when the price returns to the level after activation + fixing in the red zone.
Orange arrow - the direction of take.
Blue arrow - neutral scenario without activating the trade.
The red arrow - the direction of the stop.
P.S Please use RM (risk management) and MM (money management) if you decide to use my ideas, there will always be unprofitable ideas, this will definitely happen, the goal of the system is that there will be more profitable ideas at a distance.

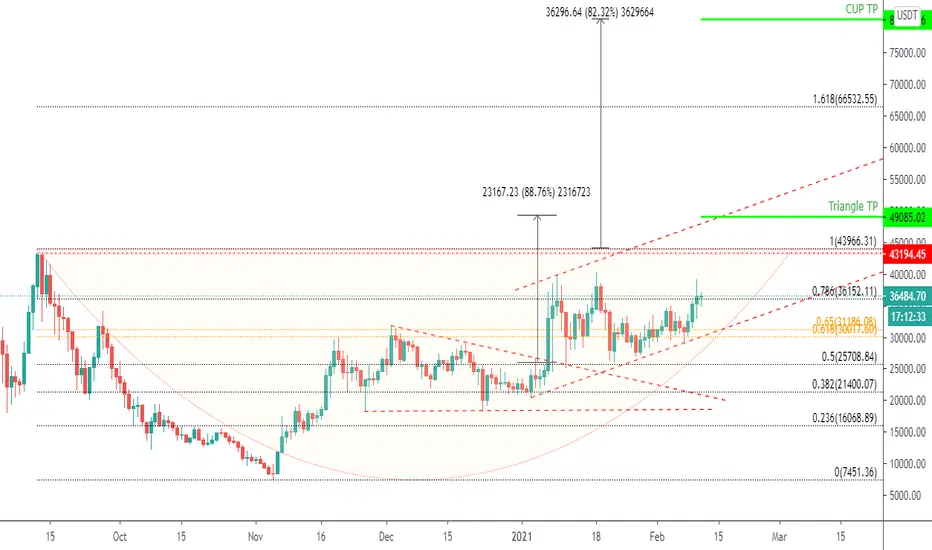
YFIUSDT is about to break a CUP formationHey all,
I'll keep it short. Look at the weekly and the daily charts. We are above the previous highest WEEKLY close right now and heading up to test the previous highest DAILY close . MACD is curling up in the daily. What usually happens is that we break a previous resistance and come back to test it. So, I expect YFIUSDT to test the previous highest daily close and come test the previous highest weekly close. Then? Once we get a close above the previous highest daily candle, the sky is clear.
I estimate price to up as high as $63,000 and I got this target by assuming the price will move up the same amount with the depth of the cup.
This is NOT a financial advise. I am just sharing my analysis with you to get a feedback from the community.
Thank you!


YFI to 100KYFI is breaking the triangle pattern and keep an eye on this it is going to make us millionaires


Yfi/USDT - Price exit from the triangle.Also a coin for thought.
Now I am not giving any open recommendations, I am just writing to you what suits me for long positions, and you already think.
I do not trade for you, you take on all the risks.
And each of you should understand trading, if you crave quick money out of thin air - sorry, this is not a casino. This is not a lottery. This is a full-fledged job, and no project will bring you any profit if you don't even know what it is about.


YFI 1H BUYAlso set some Buy orders near the Trendline
Remember no more than 5% of the deposit in one trade
SL: next sell signal
