YFI/USDT BINANCE4H hollow candles
Price range inside the ascending white triangle.
Rank #42
yearn.finance Price (YFI) = $31,512.92
+6.15%
0.9402 BTC
Good Luck
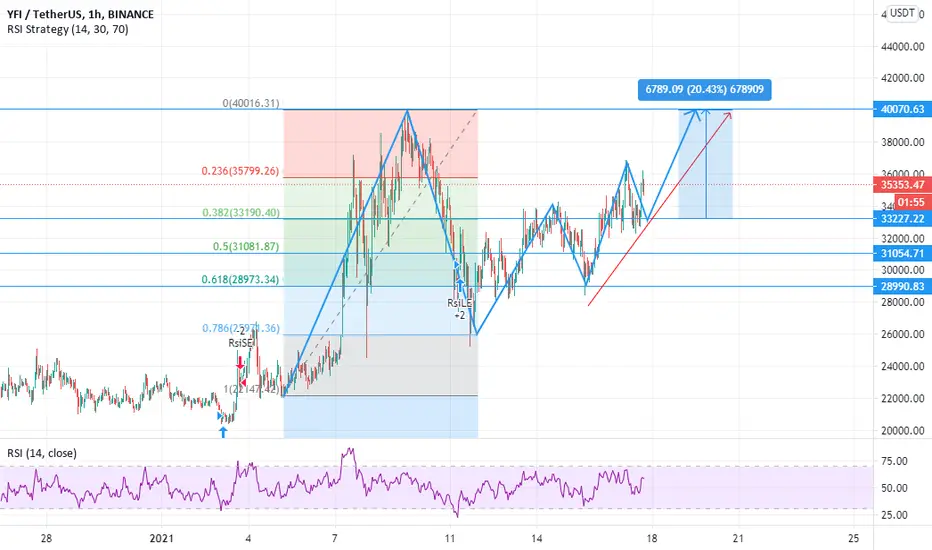
#CryptoHellas
YFIUST trade ideas

Upward movement in very close futureYFIUSDTPREP can move upward very soon from 30760 to at least 33000

YFI subtle triangleDebatable if this larger triangle exists, but I believe it is there. PA trying to breakout of it now but currently there is deep bearish divergences. Measured move of the large triangle is 74k.

YFIUSDT 1/22/2021Note: NOT A FINANCIAL ADVICE TO BUY/LONG OR SELL/SHORT
______
Due to BTC this coin did not playout well. Accepting some loss on it.
I'm still observing if count is still valid.
not sure for now.
_____
1D
Bearish Divergence
4HR
Bearish Divergence
1HR
Bearish Convergence
How to trade?
_______
Note: NOT A FINANCIAL ADVICE TO BUY/LONG OR SELL/SHORT

YFI/USD - At critical support - will it hold?YFI is in a critical spot in the larger pattern testing the ascending support line and previous top support line.
If we fall from here, then we're going much lower. Next support levels are on the chart at $25k and $21k.
Unfortunately the daily indicators are not encouraging, both MACD and RSI can fall much more.
Unless we get some nice buy pressure soon, I don't see how YFI can last another drop from BTC / overall market. Nevertheless, if that happens the first support line is not that far down.
Unless we get some buy pressure soon, I do not recommend buying here, wait for price to give more signs of reversal.
Like and follow if you liked this idea!

YFI / Final analysis 2021.01.21Final analysis: The trend will be determined in a few hours. Given that BTC dominance is being maintained, we are probably nearing the end of the market downturn and the uptrend will begin in another hour. In this diagram, three possible trends are identified.
Red, green and white arrows


Crypto|YFI/USDT|Long and short *High riskLong and short YFI/USDT
Activation of the transaction only when the blue zone is fixed/broken.
Working out the support and resistance levels triangle.
*Possible closing of a trade before reaching the take/stop zone.
The "forecast" tool is used for more noticeable display of % (for the place of the usual % scale) of the price change, I do not put the date and time of the transaction, only %.
The breakdown of the upper blue zone - long.
Breakdown of the lower blue zone - short.
Working out the stop when the price returns to the level after activation + fixing in the red zone.
Blue zones - activation zones.
Green zone - take zone.
Red zone - stop zone.
Orange arrows indicate the direction of the take.
Red arrows indicate the direction of the stop.
P.S Please use RM (risk management) and MM (money management) if you decide to use my ideas, there will always be unprofitable ideas, this will definitely happen, the goal of the system is that there will be more profitable ideas at a distance.


YFI UPDATE 2021.01.19If the candle is closed above bb --> 60,000$ , the upward trend will continue and it can be achieved in 4 models with different colors.
If the candle is closed above 60,000 bb, the upward trend will continue and it can be achieved in 4 models with different colors.
The chart is a bit confusing but it will be a climb in summary, you can check and analyze the trend by choosing any color.

YFI/USDT — formation of an ascending triangleThe asset came close to the resistance at the level of the previous local maximum. At the same time on the 4-hour timeframe chart is forming an ascending triangle. Since the YFI is in a clear uptrend, this pattern usually indicates a continuation of the bullish movement. Before the final upward impulse, a pullback to the bottom of the triangle is likely to occur, where buy orders can be placed. The buy zone is marked green on the chart.
If the nearest resistance is broken through, YFI will rise to an all-time high, which is now at $43,678. The continuation of growth is also indicated by the fluctuation of the RSI indicator above 50 and a bullish MACD cross.
Until the triangle is broken through, the best strategy would be to gradually buy YFI within the figure using the GRID bot from 3commas. To execute the trading strategy, follow these steps:
Head over to the GRID Bot by choosing it from the main menu in your 3Commas account.
Select USDT Market and YFI/USDT pair;
In the Grid Bot tab, go to the Manual strategy settings;
Set the upper limit price to 43,678 and the lower limit price to 33,930. Number of grid lines: 10. Set the quantity per grid parameter according to the amount you wish to spend on each trade;
Click the Create button, then sit back and let the Grid Bot go to work!


YFI important momentGreetings
amid the rise of the major cryptocurrencies, the defi hype has declined. And all eyes are on ether and bitcoin.
I suggest to look at YFI once again to evaluate its global prospects for next 3-6 months, as the past idea is relevant but for more local work
Total return on the idea with updates around 140%.
Let's have a look at the daily chart first,
we can see that price has formed a larger symmetrical triangle, with a base of 800%. The price is now at the upper boundary of the triangle. Although there is still a long way to the apex and it is possible that the price will return for another spiral to the lower boundary of the triangle.
Also worth considering a possible repetition of the head and shoulders fractal, this bearish pattern has formed quite clearly at the moment.
The next chart for the analysis of 4 hours, on which the upward channel was formed, and the local figure of the falling wedge. For the continuation of the movement in the channel, the price is hindered and cornered by the trendline of the main triangle.
Operating options
1. Breaking through a triangle
2. trade inside the triangle from the boundaries when the local trend develops.
Always use stop loss, and do not use trading leverage greater than x3.
A trader should always have tomorrow.
If you found this information useful, please like it and subscribe, so as not to miss anything.


YFI V2 - target 69420YFI has been lagging defi majors such as AAVE and SNX
long awaited v2 yVaults have released and should propel YFI back to parity with AAVE and SNX
Price targets:
50k
69.42k

YFI.USDT (Y21.P6.E2).Looking for an entry.StalkingHi All
(ref.W.chart)
YFI is coming along nice. In my previous post, I caught the breakout and cashed in the profits.
Now revisiting the chart, I see it coming along nicely and if it plays out the higher high, meaning continues a macro trend, then I will be very interested once it breaks resistance and does the retest for the former resistance.
Such charts or price action give lots of % on the support area as I stated.
Look a my PARSIQ chart or the 1INCH chart, you will see the move there.
Lets hope it comes along and more importantly we don't miss it.
All the best,
S.SAri.
NOTE: The entry at the lower time frames requires its own strategy. This cannot be covered here as we don't know how it would look like at the time if or when it comes.
PREVIOUS POST to this topic


YFIUSDT 1/18/2021Note: NOT A FINANCIAL ADVICE TO BUY/LONG OR SELL/SHORT
______
Technical Analysis
Make an entry on a pullback
1D
Bullish Divergence
4hR
Bullish Convergence
1HR
bearish divergence'
targets
finally setting on to motion
_______
Note: NOT A FINANCIAL ADVICE TO BUY/LONG OR SELL/SHORT


Keep an eye on YFIYFI make a great support here , it can move to top of the channel , take care of alts

YfiYearnfinance trendline set from previous break and brought over to now.. seems to play like a violin..
