USDZAR | 19.05.2025BUY 18.0000 | STOP 17.7800 | TAKE 18.2800 | Price movement is in the descending medium-term channel. We expect an upward correction in the local range from the important level of 18.0000.
ZARUSD trade ideas

3rd touch after Fallout after Truth about South Africa revealed.Despite the MSM's denial about the white genocide in South Africa (no one can honestly deny that whites are murdered because of owning productive farmland now); and with Zimbabwe as a cousin-example, which mirrors black on white hatred, the truth is out now. Investors will react accodingly.
I'm looking for a bounce off the 14-period/3-month EMA, which will act as a magnet. It's unlikely that change will come without initial implosion.

USDZAR-BUY strategy 3 hourly chart GANNThe pair has reached objective, and we are oversold now. This suggests we may consolidation, and feel we may see move near 18.1450 again in coming sessions.
Strategy BUY @ 17.8950 - 17.9350 and take profit near 18.1175 for now.

USDZAR-SELL strategy 90 Min chart Regression channelThe pair is under pressure, and considering the USDX I think we will see lower over time. I have aborted BUY strategy (even-though NEUTRAL stance) and am going back to yesterday's sell idea.
Strategy SELL @ 18.0350-18.0750 and take profit near 17.8875 (as yesterday)

SA government visit to USAthe Rand will strengthen tomorrow when Cryril Ramaphosa visit Donalld Trump to mend relationships

USDZAR BUYING OPPORTUNITY After studying the markets movements for the past few weeks,and also considering the past movements (Technical analysis) i was able to predict that USDZAR is going Long(up) which is a buying opportunity. Already the market is in a up trend ,but now is the perfect chance to place buy trades.

USDZAR-NEUTRAL BUY strategy 3 hourly chart GANN The pair failed to build on the decline below 18.0000 as promising it looked. We are basically trading within a larger band, and makes it difficult to get the trend direction. I will try to see how the longer periods fare this moment in time. I think we have a chance seeing higher, but am not fully convinced either side to be honest.
Strategy BUY @ 18.0450-18.0850 and take profit below resistance 18.2100.

USDZAR-NEUTRAL SELL strategy 6 hourly GANN SQThe pair still may go little higher over time, but my NEUTRAL SELL stance is due to the fact we have higher GOLD prices once again, and also shorter time frames are slightly negative, and my trend type indicator suggest deeper move lower.
Overall indicators still provide a chance of some recovery, but feel focus is down first.
Strategy SELL @ 18.0750-18.1150 and profit level somewhere 17.8875 for now.

USDZAR Bearish Optimism.Hi there,
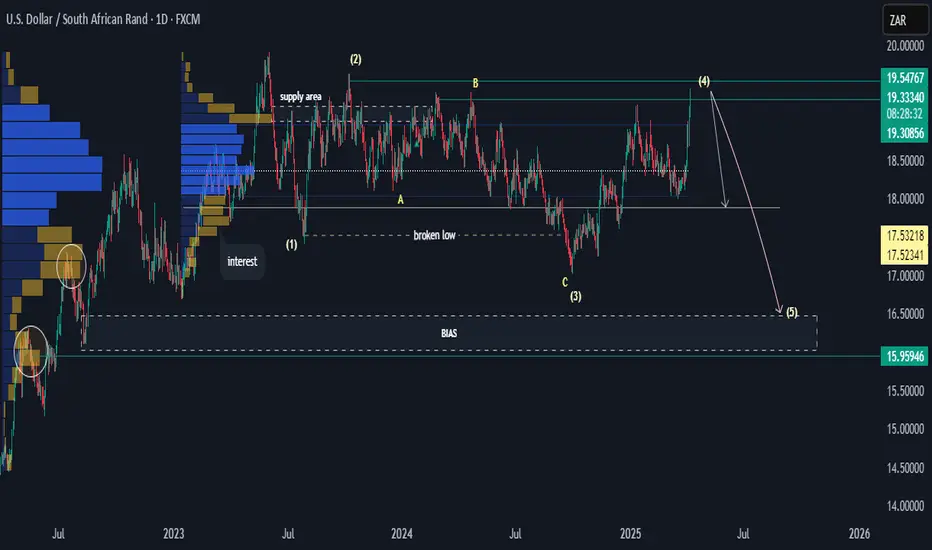
On USDZAR, it seems that we don't have much upward momentum left, do we? The price has reached the highs of the 19.31-19.55 area, and we might see a decline that could potentially mark the end of wave 4.
The Wave 5 is a bit tricky there; it may fall to the 18 area, which is a zone of interest, or it could potentially drop further down to 16.5.
Although prices may drop to 15.960 from the high of 17.174, my bias is in favour of 16.5, with two price targets at 18.5 and 18.0.
Happy trading and have a great week.
K.
Not trading advice.
Time to take a breather Mr ZAR?The rand has been on a tear since the second week of April which as seen it pull the pair all the way down onto the psychological rate of 18.00, all the way from the previous all-time high of 19.92. The rand benefited from the global search for yield and at +10%, the 10-year SA government bonds still holds juicy carry trade returns for international investors. Additionally, the SARB has also toed the line with the Fed and has opted to stand by its hawkish bias. I don’t expect a move on rates from the SARB before the Fed cuts by another 25bps. Expectations are for the Fed to cut rates by 50bps in total for the remainder of the year so I expect the SA repo rate to remain above 7% for the rest of 2025, especially given last week’s news that there will be changes to the country’s inflation targeting regime. A new lower inflation target will imply that real rates will remain higher for longer which is rand supportive as it will attract more inflows to SA government bonds, on paper.
The recent surge in gold prices coupled with renewed risk-on sentiment following Trump’s tariff pause, has turned the USDZAR into a runaway freight train. The latest SA trade balance increased further to R24.8 million in March 2025 which is rand positive.
The three factors mentioned above, carry trade appeal, risk-on sentiment and the SA trade surplus, does strengthen the case for the rand bulls but has the rand ran a little too hot over the past few weeks? I believe it has and it will have to pull back to fetch some fresh liquidity before we see the pair break below the 18.00 mark.
The pair is currently attempting to break and hold below the 61.8% Fibo rate at 18.13 and the 200-day MA at 18.17. I expect the support to hold at these levels and for the pair to climb higher and fetch liquidity around 50-day MA level at 18.52 before we see a substantial break below 18.00.
It will be risky jumping in front of this freight train as the rand can pull the pair deeper towards 17.60 and 17.65 if the neckline from the downward channel does not hold. I’m keeping stops tight but rates below 18.00 do look like promising buy zones.

USDZAR-BUY strategy 3 Hurly chart HEIKIN ASHIThe pair went down as expected, and now settling in at the lower levels. GOLD is moving lower again, and likely will go south below $ 3,100 I feel. The pair has room to correct to near 18.2750 or slightly higher before lower again.
Strategy BUY @ 18.0350-18.0750 and take profit near 18.2475 for now.

USDZAR-NEUTRAL SELL strategy 6-hourly chart GANNThe pair is indecisive to say the least. I feel over time we should see higher levels, but short-term its a bit cloudy. Right now resting support area 18.2100-18.2350 and a few negative indicators. One I use (not shown) is negative, and carries some credibility when combined with others. For now I see 17.9500 possible, before we return higher.
Strategy SELL @ 18.2350-18.2650 and take profit near 18.0350 for now.

USDZAR Bullish Setup Developing Near Key Support🕰 Weekly Overview:
Price held firm at a key weekly support zone last week, suggesting buyers are stepping in to defend the level.
📉 Daily Chart Explanation:
Sellers have lost momentum, and recent candles show signs of bullish pressure beginning to emerge. This could indicate a potential shift in market sentiment.
⏱ 4H Chart Explanation:
Price has clearly broken above the descending trendline and reclaimed the 50EMA with strong momentum. If price retraces into the discounted zone, it may offer a favorable long opportunity.
📌 Plan:
Bias: Bullish
Entry: Wait for retracement to discounted zone (near broken trendline or 50EMA) and look for price action confirmation
Targets:
TP1: Recent high in 4h
TP2: Next resistance in weekly
Invalidation: Break below 4H structure and EMA50

USDZAR-SELL strategy 3 hourly chart - Regression channelThe pair has reached it objective near 18.4650 and from there fell sharply again. it was due to the fact we have a peak above the channel, and indicators are slightly negative due to the pullback, which means there are plenty of sellers out there.
Strategy SELL @ 18.3450 - 18.3850 and take profit near 18.1875 - 18.2250 area.

USDZAR-BUY Strategy 12 hourly - FIB The pair has moved from the lower 18.10s and had some recovery to 18.3200 area and then settled lower. we are in a wider range, but considering the distance from cloud support breal and where we are at, this seems a little large. If we consider the view that we have bottomed qhich it feels to be the case, we should have a recovery 18.4950 again.
Strategy BUY @ 18.1750-18.2350 and take profit near 18.4650.

LONG USDZARThere seems to be huge demand for USD especially on the USDZAR pair.
The pair has printed the lowest prices it will reach during the month of May 2025, and probably June 2025 as well.
As such, we will be trading upwards from hereon.

USDZAR | 09.05.2025BUY 18.1600 | STOP 17.9500 | TAKE 18.5100 | The price has been declining smoothly and evenly for the previous 2 weeks towards the medium-term strong support range. At these levels we consider buying of this pair and corrective price reversal towards the nearest values of local resistance 18.5100 - 18.6800.

USDZAR-NEUTRAL BUY strategy 6 hourly chart GANNThe pair is a bit under pressure still, but considering overall view, we will turn the tide from the lower levels I feel.
Strategy BUY @ 18.1350-18.1650 and take profit near 18.3750 for now.

Bullish Look for potential Reversal bullish candlestick pattern formation upon the retest of daily demand zone

USDZAR-BUY strategy 12 hourly chart - Regression channelThe pair has moved little lower, but looking with a longer view point, we are approaching oversold levels (not extreme), but below channel. It is difficult to guess how far below the channel we may go, but with a careful approach we should start buying into the weakness slowly.
Strategy BUY @ 18.0000-18.0850 range and take profit near 18.4375.

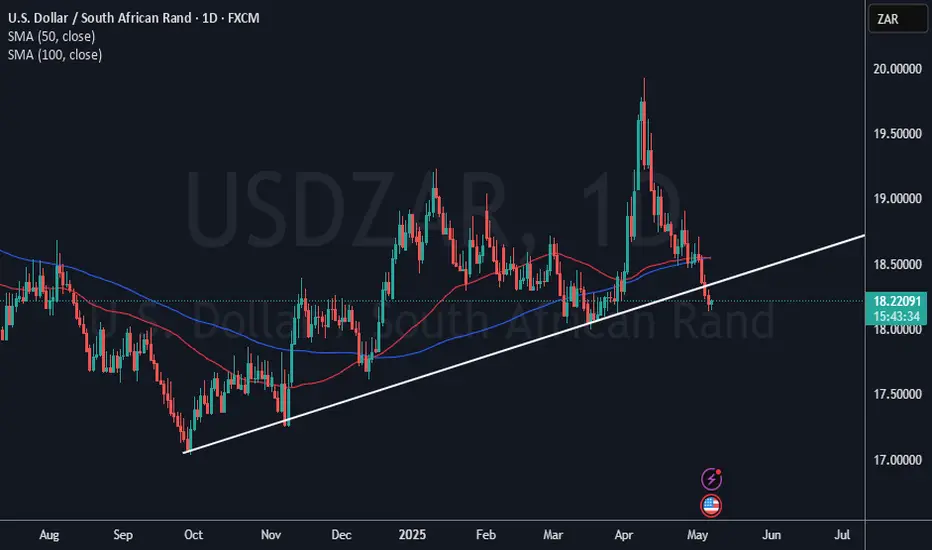
USD ZAR SELLBroke the Ascending Channel just like how it Broke the Descending one when starting the recent bullish move
We now looking for USDZAR Sell Opportunities for the next few months
I believe DXY will continue falling in order to relieve emerging markets from High Inflation levels

USDZAR-NEUTRAL BUY strategy 3 hourly chartWe managed first to move towards 18.3300 area after the BUY signal, but we fell short of objective.
Now we are under pressure, and it feels we may see a little lower. However, I prefer BUY strategy still due to the fact some indicators still provide some upwards possibilities.
Strategy BUY @ 18.1500-18.1750 and take profit near 18.3375 for now.

USDZAR LONGI am looking for entry LONG. The main trend is up,
i had an earlier post on idea of going long.
This is the zone now. Although there is a trendline that looks broken, I WILL LOOK AT PRICE ACTION.