USDZAR ShortsUSDZAR has been climbing up rapidly this week, I would like to see price decline from around 18,95 towards 18,71.
ZARUSD trade ideas

USDZAR - SELL strategy 6-hourly chart GANN FANThe pair moved convincingly beyond 18.5300 and that was the catalyst for 18.7300 - 18.8500 area. As mentioned, I had preference on break of 18.5300 not to BUY (sad sad) but to wait for higher sell levels. I do not trade the pair all the time, and am trying to support it trying to provide ideas. Now we have reached 18.80s and RSI is now nicely confident quite extreme. Amidst the trade wars we should expect either side movements and these will be volatile no doubt.
Strategy SELL @ 18.8350 - 18.8800 and take profit near GANN support 18.6250 for now.

USDZAR-BUY strategy 3D chart Heikin AshiI am always interested looking at the other chart types, and time-frames. Short-term we may see some obstacles for the pair and corrective activity is possible. Also this chart based on 3 daily movements suggest resistance 18.5400-18.5500, and it has positive signs for much higher levels to be seen. However, we have not broken out of the range as yet.
From medium-term perspective (not long-term which suggest lower over time) we may see 18.8500 - 19.00 area based on MACD and Fisher form.
Strategy BUY @ 18.4150 - 18.4600 and take profit near 18.8050 first.

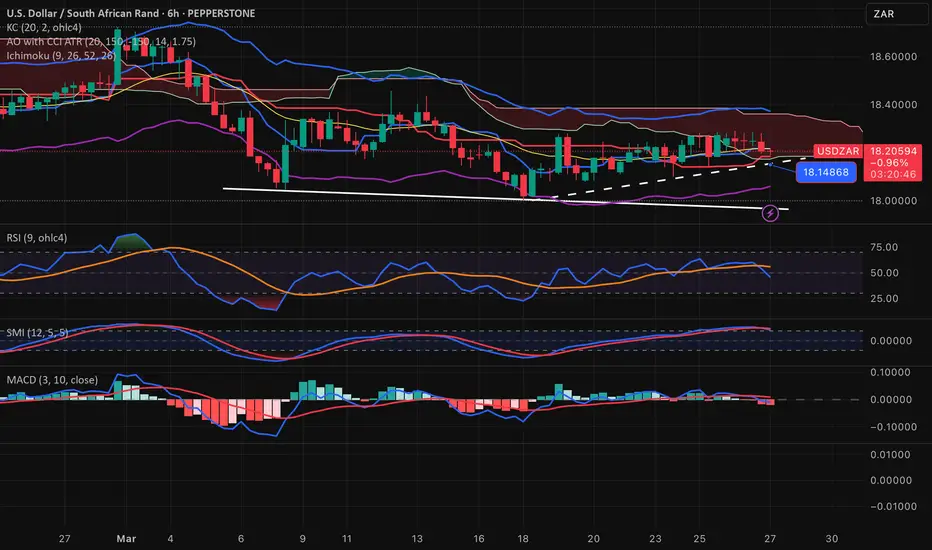
USDZAR LongUSAZAR is now net long on the regression break.
It is running into heavy resistance above. I am not taking this trade.

ALL THE TARGET REACHED ON USDZARCheck Out All My Previous Post About USDZAR.
God is good all the time,My analysis was successfully.
Let chill and enjoy the profits,Non Farm Payroll is coming up on Friday.
Let be ready to prepare it.

USDZAR-SELL strategy Monthly ChartThe pair from a long-term perspective, may be a lot lower. Reasons possibly are, ROUNDED TOP or S-H-S pattern whereby the Right Shoulder (RS) is being formed still. That is why maybe we may see a move closer to 19.0000 area before lower again. The neckline is lower 17.3500.
This translates somewhere a possible 15s handle USDZAR in the longer term. Anyway, this is just looking at the pair considering all our options.
Strategy SHORT-TERM still a BUY likely on break 18.5500 area, but SELL when right shoulder has been completed.

USDZAR-SELL strategy 9 hourly chart GANN SQThe pair trades in a very wide range, and my yesterday's ideas.. painted a lower price expectation, and this was not the case. The main issue is, we are within a very large regression channel range, and not seen here, we are at the top end of this now and even beyond it. Same as with the GANN SQ 18.4200 - 18.5300 is the current range, and lower down 18.1600 area. Needless to say, if we break convincingly 18.5300 the next target is 18.7300. For now, we are overbought (not extreme), and GOLD is lower, which also helped the pair moving higher, plus the news from SA yesterday.
We are above CLOUD support as well, adding to the BUYING mode as well.
Strategy SELL @ 18.4900-18.5300 and take profit near 18.3750 for now. If we break beyond 18.5300 would not make it a BUY per se, but a chance to SELL higher up with a more extreme overbought state, would be my strategy.

FIRST PROFIT BOOKED,USDZAR FINALLY BROKE 18:45I am now looking forward to hit 1863 as my main Target for these week.

USDZAR-SELL strategy 6 hourly chart - Regression channelThe pair has rejected 18.4100-18.4500 area (top of regression channel), and now we have settled between 18.2400 - 18.3300 area it seems. The overall picture suggests downside pressure, and for that reason I think we will move back towards 18.1350 again.
Strategy SELL @ 18.2900-18.3300 and take profit near 18.1650 for now.

USDZAR-SELL strategy 6-hourly chart - regression channelThe pair has moved lower 18.1200 area in line with SELL strategy, but fell short heavily sad to say. Thereafter, we spiked and we have finished the day with a hammer top.
The regression channel sloping down ward, shows the expected parameters, and usually a move beyond that, would trigger a move back towards the mid-range of the channel.
the 18.3850 area highlighted some days back, is significant, and it changes the scope a bit. However, for now in line with slight overbought levels and the quick spike, and being slightly above the regression channel top, suggest we may see a pullback again.
there is some dangers of higher levels due to positive indicators, and that is why patience is warranted before selling should be done.
Strategy SELL @ 18.4500 - 18.4950 and take profit near 18.2750 when seen.

USDZAR BUYERS ARE IN CONTROL.These coming week, Am expecting a retest of 18.30,before we go up to 18.65 or else the price will do easy of movement to reach 18.65.
Let all have a profitable week guyz.
#usdzar
#traders

USDZAR is going to hit 1845 to 1860 these coming week...Buyers are in control, As you can see on the charts,There is Shortening of the thrust,Spring dips below support and close near it high.
Volume substantially less than the volume where support first occured.
#USDZAR

Usdzar Sell 1:4 Probability!Reason for selling
1. Complete 3 waves structure
2. MACD divergence 15 min TF
3. Gaps need to be filled up
4. Engulfing candle on 15 min TF
5. C wave of the corrective structure needed.
Entry: 18.35340
SL: 18.49040
TP: 17.82000

USDZAR | 28.03.2025BUY 18.1500 | STOP 18.0000 | TAKE 18.3300 | Movement in the main ascending channel.

USDZAR-SELL strategy 9-hourly chart Line Brk (2)The pair is still technically on the downside, and we respected 18.3500 area very well. The indicators are half heart negative and feel we should see lower levels in the coming sessions.
Strategy SELL or ADD @ 18.2350-18.2750 and take profit near 18.0250 for now.

USDZAR -BUY strategy 9-hourly chart HeikinThe pair remains in an upside pressure mode, and there are some good reasons to be found for it: 1. GOLD should retreat towards $ 2,930 at least 2. USDX is positive 3. indicators support move higher for now.
I prefer to look at the long hourly charts, since the shorter ones are tug-and-war under the current range trade scenarios. The 9-hourly shows little more overall possibilities right now.
Strategy UNCHANGED BUY @ 18.2150 - 18.2450 (or feel free slightly higher). The profit level is now somewhere 18.4150.

USDZAR-SELL strategy 6-hourly HeikinIt remains to be an unclear direction, and each day it appears to be one direction or another. I really hate that :)
Today, is a SELL day, we are negative indicators.. (more than shown).. pressure downward and feel we test 18.1500 going towards 18.0000 test once again.
Strategy SELL @ 18.1950-18.2350 and take profit near 18.0350 for now.
USDZAR- BUY strategy 3 horuly chart Heikin AshinThe pair is starting to look little better on the charts,. We are above the cloud support 18.2200 area and we are approach regression channel top 18.3050 area. Since the channel is downward, it suggests a breach above let's say 18.3350, would indicate higher levels before lower again. Based on today's chart, I feel BUYING is the way to go for short-term trade.
Strategy BUY @ 18.2150-18.2450 and take profit near 18.3450 for now. Monitor as you might get better mileage out of it.

USDZAR-NEUTRAL SELL Strategy 6 hourly chartThe pair is in fact ranging within a large area, but breaking it down, over all we should see lower from direction point of view. The current state suggests upside pressure but as long we are below 18.3800-18.4000 and not broken, we should see a test of 18.0000 again. Then 3-hourly chart is negative slightly.
Strategy SELL @ 18.2000-18.2400 and add below 18.3300 area, if seen. I am preferred NEUTRAL but for those willing to stick out there neck, this is my ideas currently, without having a position right now.

USDZAR-SELL strategy 6 hourly chart KAGIThe previous update worked fine, and thereafter we started our decent again. The move lower is a little more severe, and it feels technically speaking, we may see a test of 17.9650.
Strategy SELL @ 18.0950-18.1350 and take profit near 17.9750 - 17.9850 area.

USDZAR -NEUTRAL 3 hourly chart KAGIThe pair has tried higher yesterday in the 18.22s area, and now this AM lower 18.1450. The technical picture is improving and its lesser negative, but same time I am not feeling confident either way, whether up or down. The descending triangle suggest overtime to see higher levels again, is my personal viewpoint.
Strategy consider a range trade 18.0350 - 18.3200 for now. will update if more concrete ideas will arise.

Upward correctionDollar Rand is in a downward trajectory, but has found bullish interest which may lead to a rise towards the above resistance.
Price action may move between 18.4000 and 18.0000, upon a major breaking to determine the intended direction.

USDZAR-NEUTRAL BUY 3 hourly chart strategy KAGII am not very convinced that we will turnaround as yet. The issue being, longer-term charts showing still negativity for the pair for 6-hourly and beyond. The 3-hourly chart seems to have some positive indicators, and its oversold slightly. That is why am a careful BUY, and prefer neutral stance.
1. Strategy BUY @ 18.0750-18.1150 and take profit near 18.2750
2. Strategy SELL @ 18.1500 - 18.1850 and take profit near 17.9850 based on 6-hourly chart.
