ZECBTC formed bullish BAT | A good long opportunityZcash is one of my favorite digital asset who gives short term trading opportunities almost daily for the day traders.
Currently being traded below exponential moving averages 10 and 20 with Bitcoin pair on day chart.
On short term 2 hour chart after a successful formation for bullish Shark pattern the ZEC moved up from potential reversal zone and now the price action has formed a bullish BAT pattern and at this time the priceline is floating in potential reversal zone of this BAT pattern.
Let’s dig this pattern deeper to examine how perfect this pattern is formed:
After completing the initial leg (X to A) the A to B leg is retraced between 0.382 to 0.50 Fibonacci and then B to C leg is projected between 0.382 to 0.886 of A to B Fibonacci projection area and last leg (C to D) is retraced between 0.786 to 0.886 Fibonacci and now the price action is moving in potential reversal zone of this bullish BAT and now we can expect bullish divergence at any time from this area.
The Indicators:
We can use different indicators to get help enter this trade like the moving average convergence divergence (MACD) is strong bearish and stochastic is in bear cross so we can wait for MACD to turn weak bearish from strong bearish or stochastic to give bull cross then place our buying orders.
The Targets:
The buying and sell targets according to harmonic BAT pattern should be:
Buy between: 0.006296 to 0.006273 sats
Sell between: 0.006350 to 0.006431 sats
Stop Loss:
The potential reversal zone of this pattern can be used as stop loss in case of complete price action closes below this level.
This is short term trading idea not a long term idea, I will be keep posting more trading ideas
ZECBTC trade ideas


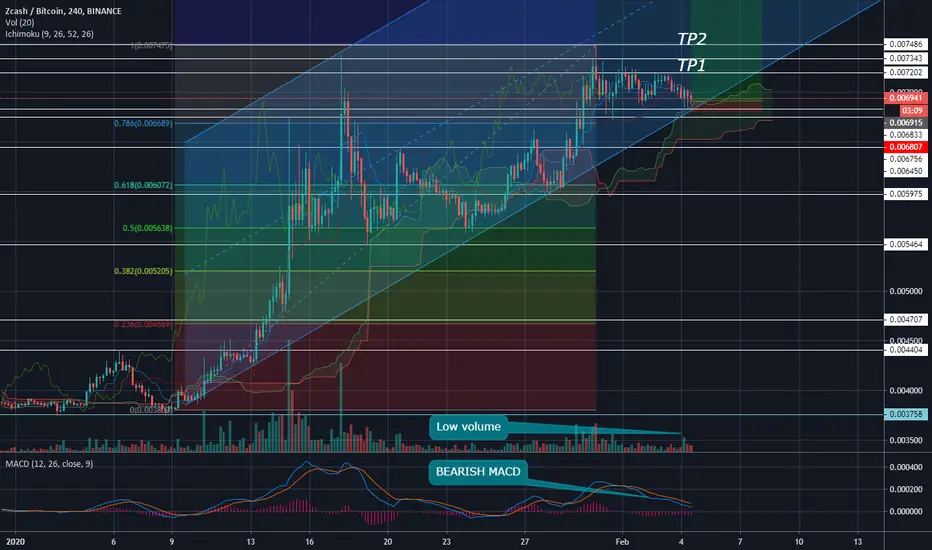
ZEC/BTC BINANCE4H hollow candles
once the price broke downtrend line, we might see a breakout.
price broke uptrend parallel channel before.
Low volume
fibonacci retrecement
Ichimoku cloud
Bearish MACD might cross
3 target areas
Good Luck

ZEC accumulation almost completeZEC has been consolidating after its 100% move for almost 2 weeks now. Whales have probably filled their bags at 6863 level, as well as at the bottom side of the wedge. Once we close above the topside of the wedge, as well as the strong resistance of 7255 we can expect a big move up. You can stop out below the bottom side of the wedge, or below the support level, depending of your risk tolerance.

ZCash Close to PumpHello Traders,
ZCash seems to be close to finish its Elliot Wave 2 in a huge bullish triangle. It would be an excellent coin to invest in the near future.
We suggest to open long when it break out of those triangle or when it goes to the base of the tiangle.
Please push like button, you are welcome to follow us on tradingview.


Zcash Super Strong | Next Target Mapped + Support LevelsHere we have ZECBTC (Zcash), one of the strongest altcoins within the cryptocurrency markets.
We can look at multiple signals here starting with EMA300 (grey line). This level is working as resistance and stopped ZECBTC from growing... This is clearly marked on the chart.
If EMA300 can be conquered, we will see prices flying up fast. But if instead EMA300 is too strong, we will see ZECBTC retrace and test the lower support (EMA200/EMA50).
The ascending triangle in light blue is another bullish signal on this chart. With such strong consolidation, prices are likely to continue straight up.
If we look at the long-term chart, this is only the beginning and there is room for much more growth... Charts below:
Dec 5, 2019 | Zcash Starts To Go Bullish, Lots Of Potential For Growth
Jan 13 | Zcash Enters Bull Phase, Huge Volume, Gaining Momentum
Thanks a lot for reading.
Namaste.


ZEC/BTC BINANCE 4H CANDLESZEC has not pump yet as other main altcoins
If price stays in the the uptrend parallel channel,
we have bullish movement
Low volume
BEARISH MACD
Fibonacci tells us another story but...
CALL FOR LONG
PROFIT UP TO 15,6%
STOP LOSS 1,5%
TP1 7202 SAT
TP2 7486 SAT
TP3 7991 SAT

$ZEC : new wave is coming ?$ZEC is drawing symetrical triangle
Looking for a BreakOut
Not a financial advice

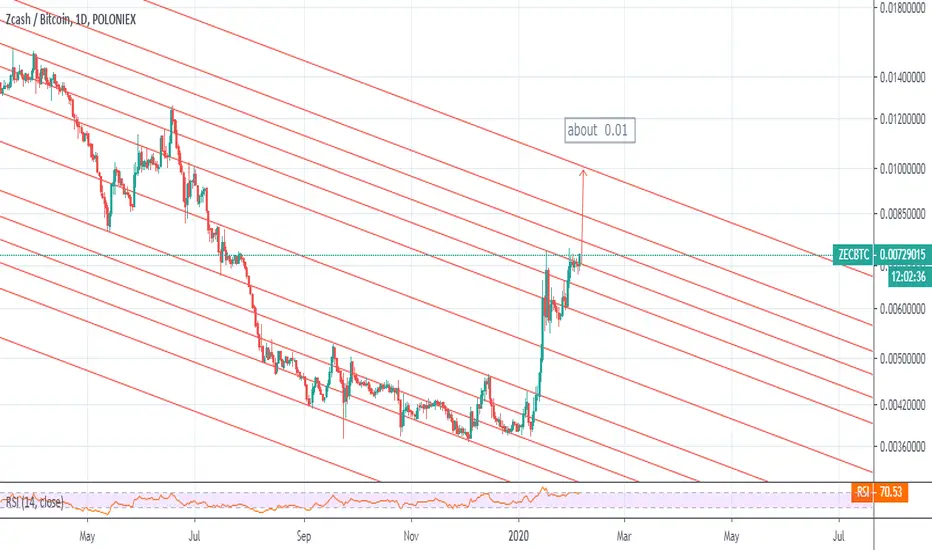
zec/btc trendlinezec/btc can up to 0.0086 or first down to 0.0064, after touch 0.0086
Zcash is halving in:
106 Days
and very bulish
Always be profitable ;)

ZEC Good Support line ,looks bullishZEC / BTC
Exchange : #BINANCE
Buy : 7120
Targets :
Tp 1 : 7700 (8%)
Tp 2 : 8270 (16%)
Tp 3 : 8900 (25%)
Stop loss zone : 6550~ 6500

Even $ZEC is killing it...👀Even $ZEC is killing it...👀
Crossing over ~690k sats resistance level w/ increasing volume...
UCTS Buy signal across every timeframe..
#ZEC

ZEC is pumping hard(just as expected). ZEC is pumping hard(just as we discussed a couple of days ago). Stunning 14% up.
Do not forget that "The trend is your friend" and I will be stacking sats until it works. When market structure gets broken/unattractive I will just go to the next promising setup.
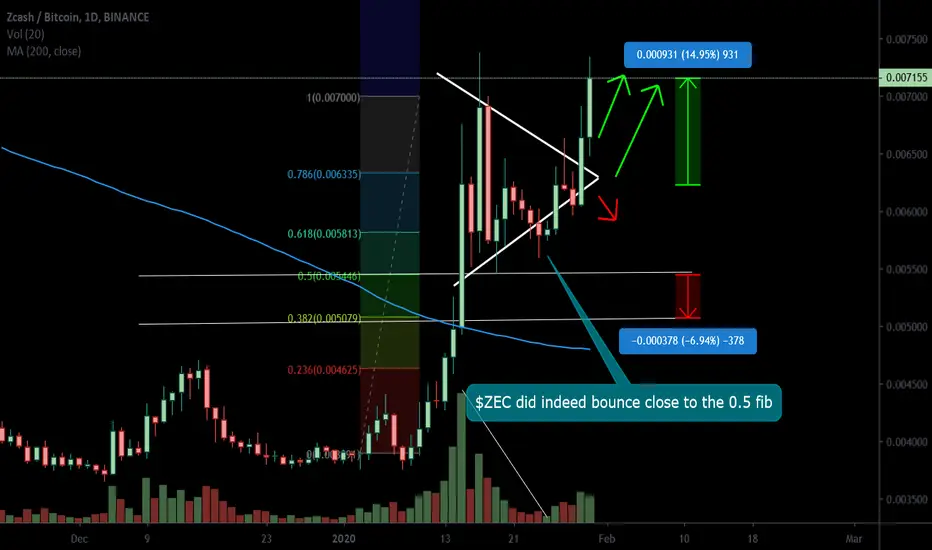
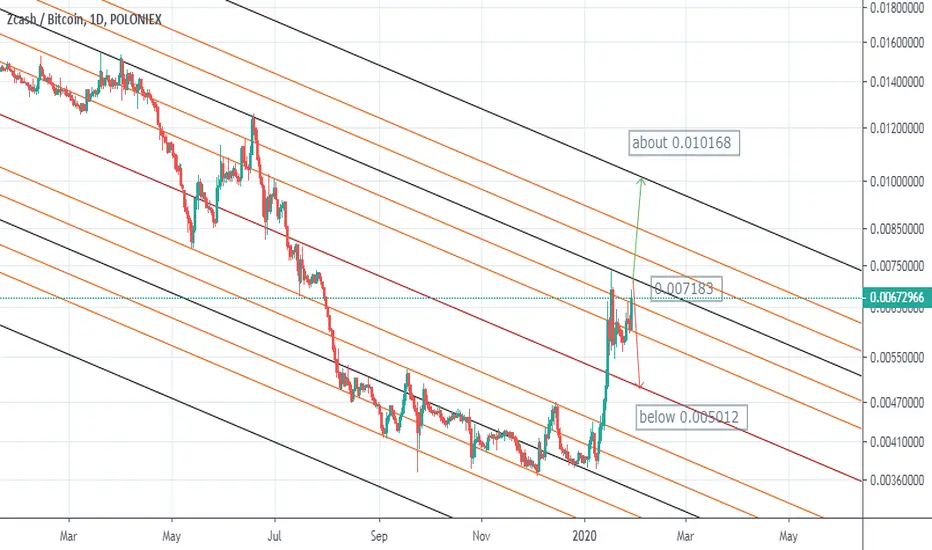
zeci think zec touch 0.007186 and then two case:
case 1( green way ): if zec can break 0.007183 then will go to hml line of chart about 0.010168
case 2( red way ) : if zec cant break 0.007183 then according to red way will go to ml of chart about below 0.005012
Will ZEC bounce again on this resistance?The StochRSI is low and ZEC is encountering a major resistance. There are chances for the price to bounce here.

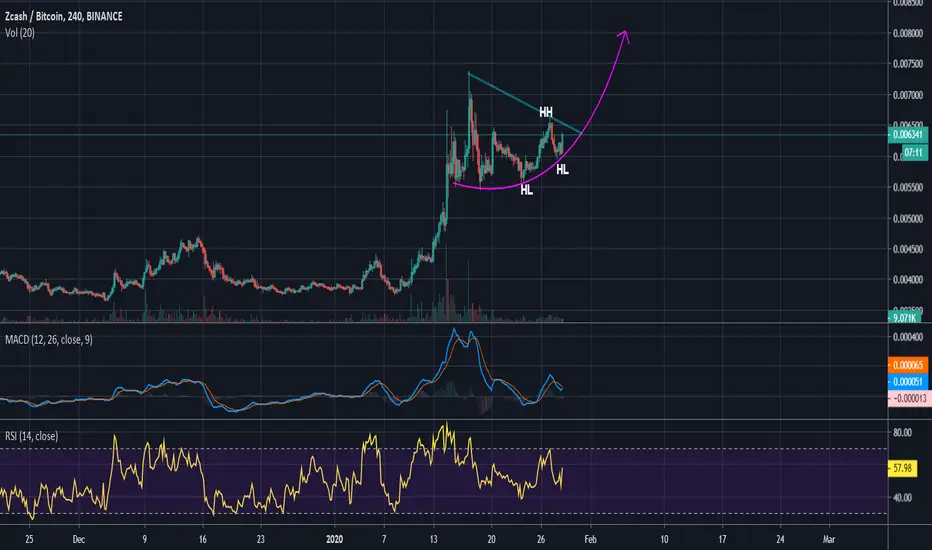
ZEC - Looking strong against BTC, Bullish Continuation PatternZEC has a great setup here. The 4-hour MACD has a near bullish cross over the signal line and the price action has bullish continuation pattern that is starting to make higher highs and higher lows. I'm long here.
$ZEC did indeed bounce close to the 0.5 fib$ZEC did indeed bounce close to the 0.5 fib. A breakout of the symmetrical triangle here will be quite bullish.
We might cool of a little before/if we continue upwards. So far well known #alts and large caps are performing well.
($DASH , $ZEC, BCH, $EOS)

ZEC Beautiful Chart ,looks bullishZEC / BTC
Exchange : #BINANCE
Buy : 5992
Targets :
Tp 1 : 6450 (8%)
Tp 2 : 6950 (16%)
Tp 3 : 7500 (25%)
Stop loss zone : 5600 ~ 5550
