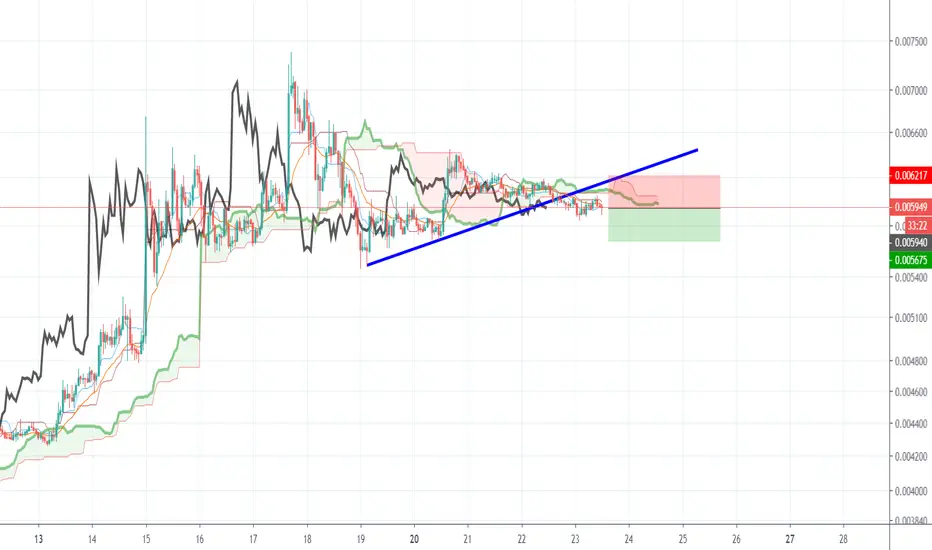
Zcash broke down from the Symmetrical triangle!Zcash broke down from the Symmetrical triangle!.
Price will test the 0.5 fib level soon. Failure to bounce there will lead us to a bigger/deeper correction.
Altcoins market is still strongly correlated to Bitcoin price action. No new entries on ZEC for now.
Still positive that this is more of a correction in an uptrend than a pump & scheme.
ZECBTC trade ideas

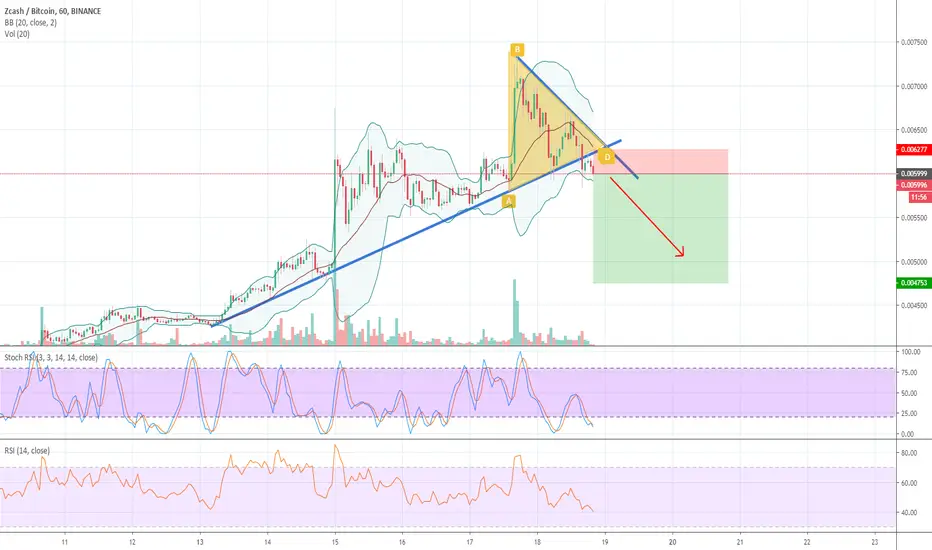
Massive dump INCOMING for ZEC : 20 % or more!A major support line has been broken. Moreover, we see a breakout to the downside of a symmetrical triangle. Seems very bearish and will probably follow the path of DASH or ETC.
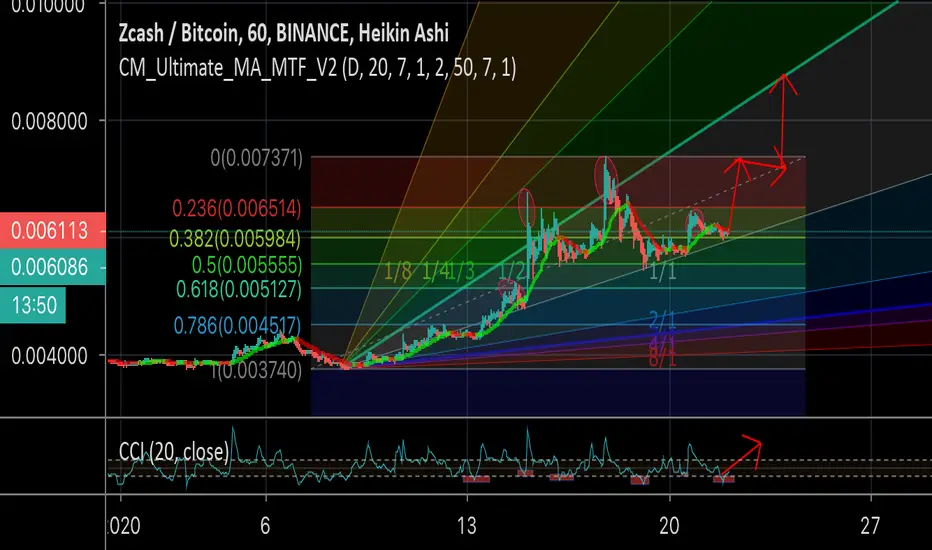
$ZEC, Over 65% run up in less than 10 days...$ZEC
Over 65% run up in less than 10 days...
UCTS Buy signal on the 2D signalling the start of the rally
Now testing again the ~.007 sats resistance level with volume retracing...
If crossed, then ~.008 as 1st target
Updating your SL to latest HL just in case it retraces
#ZEC

ZEC/BTC TA Update (Pump and Dump?)ZEC/BTC
ZEC pump over 90% from Swing Low up to 7000 sats area without even resting at 200D MA.
This coin hasn't built any support during its uptrend and I won't be surprised in the future if the price will drop drastically back to 200D MA.
I don't recommend opening a bids order as the RSI hits extreme overbought conditions.
Wait for a pullback at key support area, Do not FOMO today.

Zcash Starts To Go Bullish, Lots Of Potential For GrowthThe Zcash (ZECBTC) chart is now printing a very strong bullish candlestick to break above EMA10.
We are seeing good volume coming in after a new low was hit yesterday.
I can see that bullish divergence is showing with the RSI and yesterday's candlestick was a Doji.
Additional details, including targets, can be found on the chart.
Feel free to hit LIKE to show your support.
Thanks a lot for reading.
Namaste.


Why do the Bitcoin alternatives rally so hard right now?Hello Community,
i would like to discuss the Bitcoin alternatives with you guys. Why are they surging so hard compared to the market? Did i miss anything? Is Bitcoin getting heat from its competitors? Is this a change in Valuetation of Bitcoins longterm Value? Do they have fundamental advantages over bitcoin?
Best regards
Kai

ZCASH The mother of all falling wedges.. and the breakout!I am just posting this for fun, also I hope this does develop into the beginning of a massive uptrend for this asset, Cheers.

Zcash Enters Bull Phase, Huge Volume, Gaining MomentumZcash (ZECBTC) just broke the last high and is now trading above EMA100... Momentum is starting to build up.
Looking at the volume indicator, the green bars are becoming bigger, strong volume to break above EMA100 and the black trendline, we also have a very strong RSI.
Zcash can easily produce an impulse move to the upside next, based on the signals mentioned above.
You can find all the main targets and the most important resistance levels marked on the chart.
Make sure to leave a comment if you have any questions, it is my pleasure to answer.
Namaste.


A Long Shot...This is a big forecast timeline probs won't line up just posting to see how close it can be if it does play out...I don't leave much of my work to see how I come up with this for simplistic reasons and it's My Secret Sauce.

ZEC getting ready for a strong move against btc. Following up with my analysis from October. The sellers are having a hard time keeping this down against btc. The RSI continues to gain strength and Every dump is immediately followed up with big buy volume in this bottom range. I have re entered for a long term swing. Patience is key.


ZEC LONGzec btc 1w timeframe
- technically, ZEC broke through local downtrend and testing it right now
- volume is coming
- the price now at last correction level of Fib retracement
- support ~ 0.0039
- levels of upcoming resistance ~ 0.0049, 53, 64, 70, 86...
pretty safe deal, especially if you just buy spot on Binance or Bittrex.
#zec

Classic Tap and Go?I think so. I mentioned this as a possibility on the last zcash trade in the comments section but it does look like it may very well be. I'm not taking it personally because I need to cool off from the winning streak but it looks great.
God speed,
Me. Lucifer

Big picture speculation on ZcashI am a bullish on Zec, specially at this price level relative to Btc. Zcash is important, the only coin working towards complete layer 1 privacy. I see it as being worth 5% of Btc in a potentially upcoming bull market, and maybe more in future bull markets. How much demand will there be for a fully private digital gold? The number is in the trillions of dollars. As the stock to flow ratio becomes more reasonable and shielded addresses become easier to use and gain wider adoption, watch out for Zec.


$ZEC, $ZEC
Showing some recovery from ATL BTC (20%+) but don't get confused, it never broke a HTF resistance yet..
UCTS Showing a Buy signal on the 3D after a long period of time.
We will need to wait for a cross and R/S flip of ~470k sats level as further confirmation..
#ZEC
