ZEC 1DStochasticRSI bounced off the plotted ceiling. May have support on the way back down in the 40~ pt area.
Double top on RVI
Price is forming a wedge/channel downwards. However, it has strong psychological support between the .236 and .382 fib levels.
I would watch for a topside break of the wedge and buy near the bottom if other indicators support it at that time.
ZECBTC trade ideas

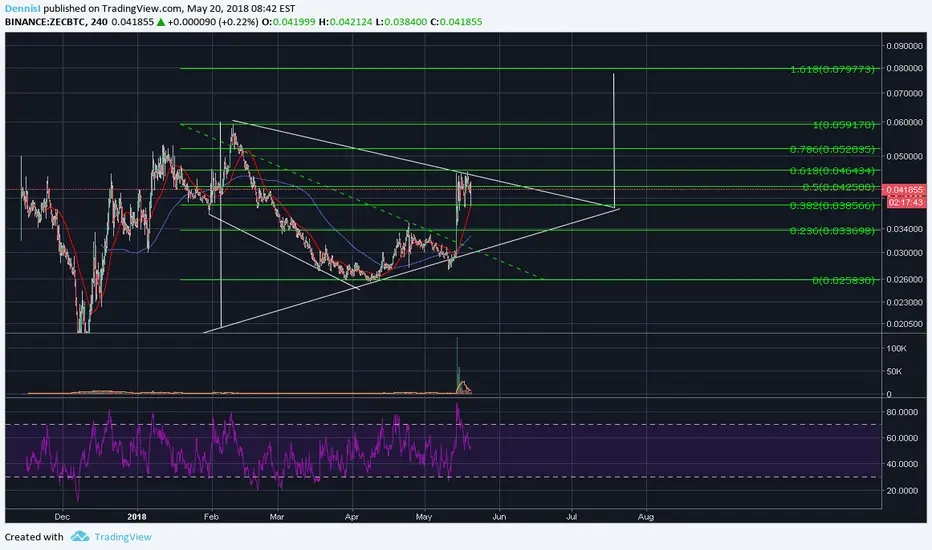
Zcash uptrend 100%+ gainZcash was consolidating for a long time since 10th of February till 1 week ago. That would be more than 100 days consolidation.
Now, after longer consolidation and after regaining 50% in 30 mins time on the 14th of May its was more than clear that Zcash is trying to push up.
Made an uptrend from 0.02
Uptrended from 0.0292 touched 0.0456 mark and retraced, but stayed above 0.0282 level and continously pushing upper price level in order to breach 0.045 mark.
After three attempts fails to do it and retraces to 0.0382 (while achieving 0.044 0.045 0.046 prices) and retracing.
Makes an uptrend from 0.0382 while continously retesting that level 5 times (even with strong pierces) didn't managed to breach that level from the upper side.
in the first cycle was uptrending (in sats and usd) more than btc actually lost in value which shows extreme bullishness at this moment (Zcash was uptrending while entire market was between 5 and 20% minus) was like +10% +20%.
Having in mind 0.0382 level held pretty well (desipite numerious retest), my personal take is that Zcash could double or maybe even go to 0.1 target or even 0.015 in last instance (but honestly) i m not expecting reaching that value in one instance.
on 0.082 level we have resistance, but since we are in form of falling wedge, i thing it could actually pierce through 0.045 and 0.056 resistances going straight to 0.082 level which would be next resistance level and (by my opinion) safe exit price for all people who rebuy under 0.04 sats.
Targets :
0.046
0.056
0.082 (as most probable)
0.15 was ATH at zcash (comparing to existant 0.038 we could conclude that price of Zcash is pretty much underpiced.
I do expect sharp upward momentum heading staight to 0.082 sats.
-This is not financial advice, it was meant to be used only as speculative and solely subjective point of view

ZCash vs Bitcoin Correction After Rally?ZCash has found the support at 76.4% Fibs that is btc 0.0265. From that point the uptrend has started and price reached btc 0.035 while breaking above the 200 Moving Average. On a corrective wave down, ZEC/BTC rejected the uptrend trendline followed by an explosive growth.
This time ZEC has reached the high at btc 0.045 and it seems that the uptrend is likely to continue as there are no signals at this point of a trend reversal. The next strong resistance is seen at 76.4% Fibs that is btc 0.05, that could be reached in a very short period of time.
But on a downside, the correction down is possible, down to the btc 0.036, where previously support was formed. Only break and close that support could invalidate bullish outlook and send price down to btc 0.026.

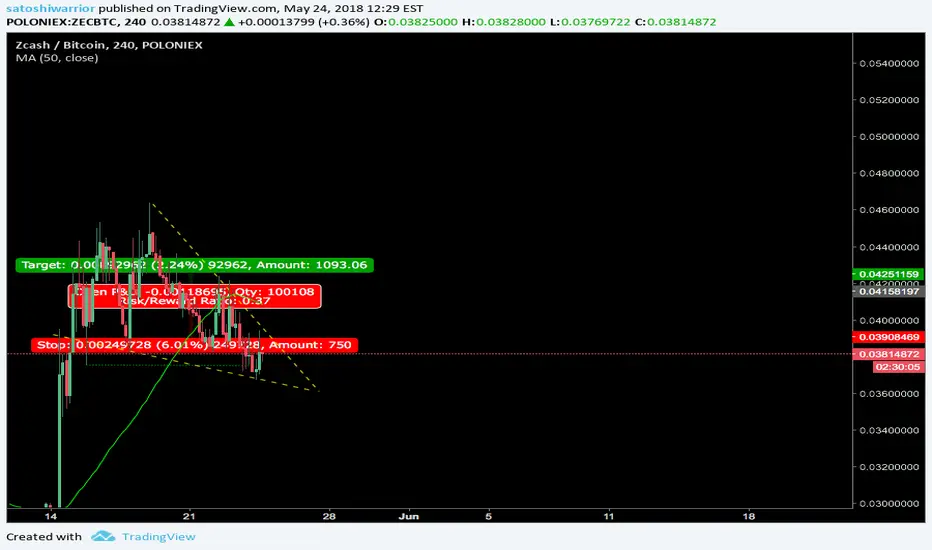
Potential $ZEC BreakLike the rest of the market, $ZEC entered a big selloff with $BTC today and has been recovering. Right now ZEC is on the .382 fib and it's right where the trendline meets. Just entered at the bottom of the triangle pattern anticipating a break to the upside. Need to have some volume to it and the volume monitors are flashing ZEC now so that's a good sign. If it breaks upwards it could retrace briefly on a pullback to retest the triangle before moving. That's another great entry point. Stop Loss set right below - if it breaks down it's an immediate sell.


ZCash potential good buy opportunity - Support TrendlineZCash didn't fair too well in the past few hours, Bitcoin's heavy drop today likely didn't help.
As I mentioned, I haven't followed ZEC much before, nor did detailed analysis. Please do additional research.
Observing it more closely however, it's BTC/ZEC pair seems to constantly find support across that orange trend line. It may now be a better buy opportunity (still DYOR).
I had analyzed the USDT/ZEC pair earlier, which may not have been the better trend to watch.

ZEC ShortZec just reached the .618 of the last major move and held for a moment before breaking. Created a perfect H&S shoulder and just breached the neckline.

ZECBTC long above 0.03822308 tp at the Blue line on the chartZECBTC long above 0.03822308 tp at the Blue line on the chart
If below ZECBTC meet big support at 0.02844469
Note: This is trading plan for longterm

Blackbox buy signal on ZECBTCOn May 14th 2018 our Blackbox generated a buy signal for Zcash on the ZECBTC pair. The algorithm has more than 56% chance of winning with a risk to reward ratio of 1:6. Bitcoin based pairs have an average loss of -23% and average win of 143% based on 316 historical buy/sell signals since 2013. We recognize this trade was published a few days late, however it is a live signal and we will post the sell signal when our algorithm alerts us.

Zcash - resistance needs to get broken Resistance and Targets
You can see the clear the orange line which is resistance.
The fib lvl give us the conformation.
After breaking that we rally to the green boxes :)

ZEC looks excitingthe trend is your friend .... is actually not the whole saying...
""the trend is your friend until the END"".. is the actual saying
majority of people are wrong when it comes to TA.. thats because they become euphoric in an upward trend.. and cautious in a downtrend'
infact you should do the exact OPPOSITE of the majority mass.
1. i know ZEC is being listed on GEMINI.. this could result in a final impulse wave up
2. you should not buy that at all because most likely that will be a sell into the volume.. easier for whales to get rid of their ZEC all at once.
3. buy zones are the green boxes
4. keep a careful eye on BTC.. which is making a falling wedge (bullish) and its breakout could result in a shortened ZEC wave in either direction.
thank you
please leave a like :)
it truly means a lot to me :D and keeps me going strong

ZEC - Zcash - Time for reload! Short temporarily.
Hi Folks!
We had a very good news regarding Zcash last time. It will be listed on Gemini Exchange. The price has exploded.
It may go even higher as looking at the big picture of ZEC we are very low according to Fibonacci levels (big scale). The second chart with bigger picture illustrates this.
Right now it is good time to stay vigiliant and reload or simply buy ZEC. We may encounter massive gain within following weeks/months.
So we observed finished Elliot Wave pattern (1-5). We have to prepare for the correction waves (A-C). Wait till it's finished.
Looking at the volume and Weis Waves we can see now demand is spent. Following green wave is signifiantly smaller than previous one.
Waiting for higher supply. Price should decrease then.
We assume perfect levels for reload would be at Fibonacci small scale at level between 0.03465900 and 0.03940200 (green rectangle).
Of course it has to be confirmed by Weis waves.
Technical analysis summary:
Elliot Wave pattern finished (1-5)
Expecting to have correction pattern (A-C)
Weis waves - demand is spent - significantly smaller green wave observed
Reload or buy at level of between 0.03465900 and 0.03940200 (green rectangle)
Waiting for the confirmation from Weis Waves indicator - trend reversal.
Stay tuned.
If you have any ideas/thoughts don't forget to question and comment in section down below.
If you want to be up-to-date don't forget to follow us.
Hugs!
WBM Team

ZECBTC waiting for retrace to buyThe last major swing high made it higher since my last chart so I had to redraw the fibs.
I would like to see it retrace a bit to around the 0.50 and 0.618 fib levels.
This is my preferred area to scale into an initial long position as I cannot chase price.
Depending on the price action I may take full/half profit just before the 0.382 fib level and trail the stop to lock in profit. If we make new highs from there, we can add to the position in similar fashion and trail the stop again.


ZCASH: GEMINI EXCHANGE LISTING: 24 HOURS = 53.25% PROFIT!!!Our " Crypto Bottom" Trade Indicator has correctly identified a buy in point on the 14th of May 2018.
Using this buy in point and selling at today's price, you would have expected to net 53.25% PROFIT!!!
The increase in price may also be explained by positive developments including:
April 14: Zcash releases first Overwinter compatible Zcash release, 1.1.0.
April 16: Zcash company releases list of merchants who accept ZCash.
April 21: Zcash announces that it aims to offer support for the main 3 platforms Windows, MacOS and Linux as a priority.
April 23: BitOasis digital asset trading exchange lists ZCash.
April 25: Guarda, who recently releases a Zcash mobile wallet for Android.
April 26: Dow Jones Marketwatch is announces it is now watching Zcash.
May 2: Goldman Sachs-backed Circle announced its support for Zcash in Circle Invest.
May 10: Zcash makes an investment in StarkWare Industries a new company developing STARKs. STARKs are a new cryptographic proof system which is scalable, toxic-waste-free, and post-quantum secure.
May 14: Gemini Exchange (owned by the Winklevoss Twins) announces it will list ZCash after recieving approval from the New York State Department of Financial Services (NYSDFS). It will commence trading on the May 22 2018.
(NEW) May 15: Reuters publicises Gemini Trust Co exchange listing of ZCash making it the world’s first licensed Zcash exchange.
(NEW) May 18 : Zcash Foundation announced a plan to prioritize ASIC-resistance research.
Analysis reveals that the increase in the price of ZCASH is being driven by it's listing on the Gemini exchange together with the general price recovery in the cryptocurrency markets.
*The "Crypto Bottom SIgnal" used in this analysis is included as part of the Crypto Trade Signals subscription.*

About it's potentialZCASH got a rocket launch, so what now ? It might be starting it's 3rd wave with lots of potential, for the short term, ~20 days, It may go to the 0.5 Fib. Target on chart, green flag !


ZCASH 100% POTENTIAL TRADEZcash has been in a triangle for some time and it approaching the period of breaking out, this breakout will be massive as it just turned back from exactly 78.6% of Fibonacci retracement.

Short opportunity ZECBTCTraders,
I spotted a nice opportunity to short ZECBTC and will explain you why:
This afternoon ZECBTC has fallen through the trendline it followed since the 15th may and it's currently in a falling wedge.
The partial decline it showed this evening (in other words: not reaching the upperside of the falling wedge) is a bearish signal.
It's currently @ support around 0.0395, but if we go lower and break 0.037642 we have (according to dow theory) 3 signs that the trend is reversing:
- Break of trendline
- Failed to make a higher high in a uptrend
- Price goes below a previous short-term minor sell-off low in an uptrend


ZEC Bull ZEC appears to have just entered it's bull cycle in terms of BTC
It also looks like a beautiful market cycle in the USD pair
Just bought a small position and will double it if ZEC gains 10%
15% Stop (soft stop)
100% TP
They're partners with JP Morgan, need I say more?
