ZECUSD trade ideas
ZCash Prediction for Swinging TradeZcash is a cryptocurrency aimed at using cryptography to provide enhanced privacy for its users compared to other cryptocurrencies such as Bitcoin. Zcash is based on Bitcoin's codebase. It shares many similarities such as a fixed total supply of 21 million units.
The following line can be broken if the line was broken below 50 then Bearish signal portrays while a Bullish uptrend is possible on a long term bear can sometimes be deceiving this upcoming days.
Zcash: Possible Buying OpportunityThe price is at the support zone formed by 56.00$ and SMA200. Now it is the key support zone for the buyers. If the price can stay above this support, we should be ready to see a new upward movement toward the previous market high. If the price breaks the support zone, we will see the further downward movement toward 20.00$ support.
As for now, we can try to catch a possible upward movement using the current position of the price. The price is above the support zone and we have reasons to open a long position. The trading idea is based on the price reversal from the support zone.
The long trade has the following entry and exit points:
Buy above 58.50$
Stop below 48.50$
Profit Target at 98.50$
Risk per trade must be no more than 5% of the capital.
Disclaimer!
This post does not provide financial advice. It is for educational purposes only! You can use the information from the post to make your own trading plan for the market. But you must do your own research and use it as the priority. Trading is risky, and it is not suitable for everyone. Only you can be responsible for your trading.
ZECUSD W1: BEST Level BUY/HOLD 300%+ gains (SL/TP)(NEW) Why get subbed to to me on Tradingview?
-TOP author on TradingView
-15+ years experience in markets
-Professional chart break downs
-Supply/Demand Zones
-TD9 counts / combo review
-Key S/R levels
-No junk on my charts
-Frequent updates
-Covering FX/crypto/US stocks
-24/7 uptime so constant updates
ZECUSD W1: BEST Level BUY/HOLD 300%+ gains (SL/TP)(NEW)
IMPORTANT NOTE: speculative setup. do your own
due dill. use STOP LOSS. don't overleverage.
🔸 Summary and potential trade setup
::: ZECUSD week/candle chart review/outlook
::: long-term accumulation in progress
::: BULLISH falling wedge on weekly TF
::: throwback stage now not complete yet
::: mid/long-term SUPER BULLISH OUTLOOK
::: super strong chart bullish outlook
::: short-term more downside expected
::: accumulation mid range will get re-tested
::: required now before bull run can resume
::: BULLS should get ready to BUY PULLBACK
::: we are setting up for a strong move
::: within next few weeks max (3-6 weeks)
::: recommended strategy: BUY LOW 36/38 USD
::: TP BULLS is 250/350% gain BUY/HOLD setup
::: SWING trade setup / no fast gains here
::: BUY/HOLD / do not expect miracle gains
::: SL is 20% max
::: good luck traders!
🔸 Supply/Demand Zones
::: N/A
::: N/A
🔸 Other noteworthy technicals/fundies
::: TD9/Combo update: N/A
::: Sentiment mid-term: BULLS/PRZ/REVERSAL
::: Sentiment outlook short-term: BEARS
ZECUSD: Downtrend (11.09.2020)On D1, the cloud is directing downward, indicating a downtrend.
On H4, the price fluctuates around the cloud, which indicates the formation of a correction.
Besides, on H4 and H1, the correction model in the form of a triangle is visually well visible.
We recommend selling on the breakdown of the downward correction model boundaries, or in case of false growth to the level of 68 (when RSI will reached overbought level on H1 and H4).
ZECUSDT Looks Really Strong 100% Growth PotentialWe have seen a good rally in ZEC Since its major drop in march
as of now it has turned its previous high of Feb into a support now after making a new Higher High in Aug as compared to Feb with Higher Low which indicates a good bullish momentum.
The price are trading above EMA 50, 100, 200 on Daily Time frame and it adds another boost to its momentum.
RSI and MACD are also Showing good signs of Upward Trends.
The potential TP's are marked in the Chart.
TP1 - 110
TP2 - 150
TP3 - 175
Open
SL Manually Daily Close below EMA100
This is not a financial advice.
DYOR
Thanks
Aanuj Tated.
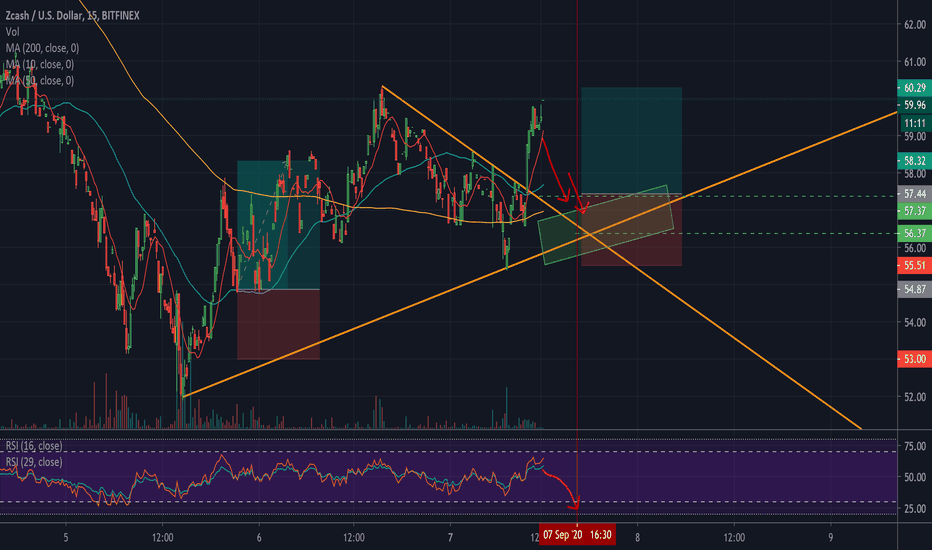
ZCash Needing a Dip to 56.37-57.37 to Cross trendlines to LongI've been having success at Scalping #Zcash and #Litecoin as of late. Their patterns have become quite prediectable. In this chart you can see where a descending overthrow trendline meets the underlying, more powerful uptrendline. If the price action meets at the exact spot needed, a long may be the best opportunity. Granted I may need other confluences such as the RSI and I'll take a look at the MACD. But after some major drops in Crypto overnight, it seems like they're trying to make a comeback. with resistance on Zcash being around the $60 mark, I wouldn't shoot for any higher than that as my Take Profit. Let me know what you think.
Here's a previous Zcash win using my double RSI strategy. The (Over sold on the 19, diference of 7 or more between the 16 ans 29 RSI, Crossed The 50 and the 200 MA was used as support. Was the perfect time to pull the trigger and land nearly a 20 pip scalp.
ZCASH Look for the next buy opportunity
Hi traders:
Looking at ZECUSD for the bullish potential.
We see price had a strong bullish impulse up breaking above the previous highs.
Price then start to form this larger deeper continuation wedge structure, good signs for more bullish momentum.
I like to see either a correction to form after the breakout, or one last push to the downside before the buy from bottom.
Ideal entry would be the wait for the confirmation breakout from the wedge structure, then lower time frame correction to enter.
Thank you


