ZECUSD trade ideas

ZCASH in uptrend for a whileTargeting $70, stop loss @58. It seems to be trending upward for a while, its a good price for long term investors as well.


Zcash: Strong Support Zone at 56USD and How to TradeIf we look at the 4H timeframe, we will see the bullish market correcting the previous upward movements. The price is not far from a solid support zone formed by SMA100, SMA200, 56.00USD support level, and the daily trend line. It looks like we have all reasons to expect the price reversal from this zone and a new upward movement in the direction of the main trend.
If the price reverses from this zone, we will have a possible buying opportunity. Here is an example:
Buy above 56.15USD
Stop below 53.55USD
Profit target at 63.95USD
Risk per trade must be no more than 3-5% from the capital.
If the price breaks the daily uptrend line, we will have to think about a new trading idea.
If you like my posts in such a format, please smash the LIKE button and subscribe. If you have your own trading idea for this market, please, share in comments.
Disclaimer!
This post does not provide financial advice. It is for educational purposes only! You can use the information from the post to make your own trading plan for the market. But you must do your own research and use it as the priority. Trading is risky, and it is not suitable for everyone. Only you can be responsible for your trading.

ZEC USD LONGTERM VIEW BULLISHZEC Bullrun Triggered
LONGTERM $500 000 ATH TARGET WILL BE IN GAME
ENJOY!

ZEC vuy under $50 target 180 USD and BeyondMarket structure similar to VET before parabolic move up.
I recommend buying 48- 50 USD and ride it all the way up to 3 digits
180-200 USD for the extended 5th wave impulse
Goodluck

ZEC immediate term movementfrom $61 we can see upwards movement, which would validate bull trend.
otherwise we will see a bit more sideways movement.
not financial advice.
stay safe.

ZEC PlanI'm expecting a move up to red, where i will sell partial or all of my position and wait for re-entry or look at other opportunities.
if it comes down to green, i will buy more.
not financial advice.
stay safe.

Demand for Zcash is not slowing down. Channel Broken can we boonZcash recovered rather well, and in a very solid position to continue demonstrate demand for this secure coin.
It can be anyone's guess where we go from here, but we do need volumes to really confirm the bull trend, for now we are confirming a double top, so, we definitively need to be above 60 soon, by July 22 it seems.
If price is not above 60 by July 22, correction might follow, unlikely, but watch out.
Looking for a breakout and hitting previous highs, with a dip and a breakout confirmation = ZCASH hodlers here.
So this is all very interesting, lets see how it works out.
__FRACTAL___
JULY 22
____REVIEW_____
------------------------------------------------------------------------------------
As you can see, as soon as that triangle failed to form, u get out and hopeful had your SL triggered before that. This is a perfect example, that even though TA had the right set up, the price action ultimately sets the trend, not you.
*LEGENDS**
BLUE = Bear/Resistance
Yellow = Bull/ Support
Vertical Lines: Fractal dates are moments of interest, where price and time collide to create oscillation.
~Explore the chart for possible scenarios of price actions - use zoom and scroll for better view.~
/*This information is not a recommendation to buy or sell. It is to be used for educational purposes only.*/
Feel free to request: your coin to be analyzed! Please keep those Stop losses in place!
Thank you,
_Ajion

ZECUSD Exponential Moving AveragesZECUSD
Pin Bar intersects Exponential Moving Averages Dynamic Support Resistance and Horizontal Support Resistance Line.

Zcash: Bullish Trend and How to Join ItWhat do you think about such a long trade?
The price is moving upward in the bullish trend. SMAs support the upward movement, and reversals from them give signals for buying. MACD and DMI are bullish.
We should be ready to see a correction movement below SMA50 to a strong support zone. It is formed by SMA100, SMA200, and 50USd level. The price reversal at this zone will give an opportunity to join the uptrend.
Of course, this trading plan can fail if Bitcoin continues the downward movement and the support zone in this chart won't be able to stop sellers. That's why we have to use the stop orders below the support and don't invest all money in one market.
P.S. as I don't use like-bots and other solutions that show great "interest" to my posts, I will be grateful if you support my work by your LIKEs and comment. Of course, if you can do it. The feedback from REAL people is priceless!
Disclaimer!
This post does not provide financial advice. It is for educational purposes only! You can use the information from the post to make your own trading plan for the market. But you must do your own research and use it as the priority. Trading is risky, and it is not suitable for everyone. Only you can be responsible for your trading.


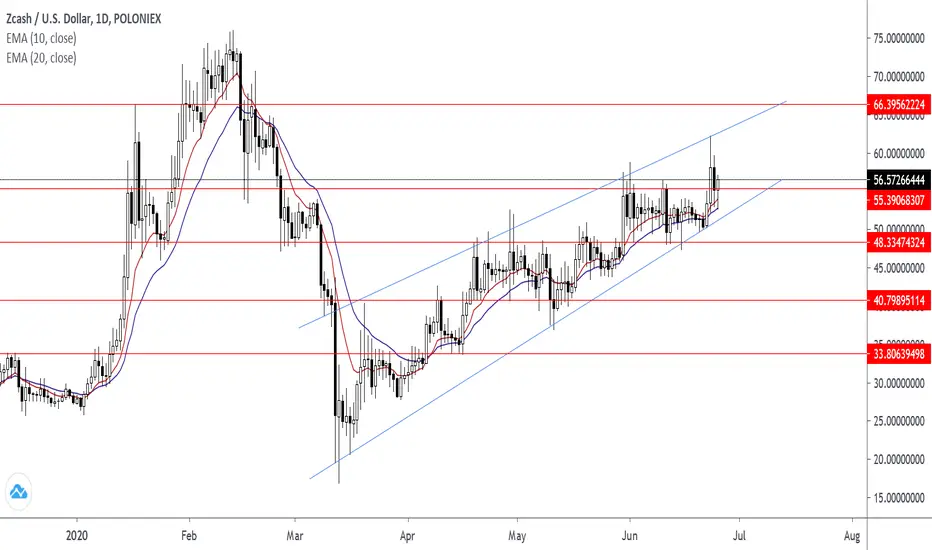
ZECUSD, Bearish in mid-termZEC rejected from top of falling channel and broke out of mid-term rising channel. I expect it to test long-term bottom again and could go for bottom of bearish channel if $26 does not hold.
If we see a bullish breakout from longterm channel $75 will be my target as range high.

ZECUSD: Analysis using Ichimoku 30/06/2020H4
On D1, the cloud is directing upward, indicating an uptrend.
Conclusion:
Locally, we recommend buying when the RSI reaches an oversold level on the H4.
H1
At H4, the cloud is directing downward, indicating a downtrend.
Conclusion:
Locally, we recommend selling when the RSI reaches an overbought level on the H1.

We still have at least 30% decline from there on ZECIn the most bullish case i can see on ZEC where:
1) This is a leading diagonal and not an ABC
2) We have bottom truncation
3) we only retrace to the 0.5
We still have a 30% decline from there